Abstract
Carcinoembryonic antigen-related cell adhesion molecule 6 (CEACAM6) is abnormally expressed in various malignant tumors and thus represents a potential biomarker, although information regarding its role in gallbladder cancer (GBC) is limited. This study aimed to evaluate the expression of CEACAM6 in GBC and the effect of CEACAM6 gene silencing on the proliferation, migration, invasion and apoptosis of human GBC cells. Immunochemistry was used to evaluate CEACAM6 expression in 95 GBC specimens and 40 peritumoral tissue specimens. GBC-SD and SGC-996 cell lines were used for in vitro experiments. CEACAM6 was knocked down by transfection of targeted small interfering RNA (siRNA), and reverse-transcription quantitative PCR and western blot analysis were used to detect knockdown efficiency. Cell Counting Kit-8 and colony formation assays were undertaken to evaluate cell proliferation. Variations in cell migration and invasion were detected by wound-healing and Transwell assays, respectively. Flow cytometry was applied to measure cell apoptosis and cell cycle distribution. CEACAM6 gene expression was significantly greater in GBC tissues than in peritumoral tissues, and its positive expression was associated with poor prognosis. CEACAM6 mRNA and protein expression in the CEACAM6 siRNA treatment group was significantly lower than that in the negative control group and the blank group. CEACAM6 knockdown inhibited GBC cell proliferation, migration and invasion but promoted cell apoptosis. Western blot analysis of invasion- and apoptosis-related proteins matrix metalloproteinase-2, Vimentin, BCL-2 and BAX further confirmed CEACAM6 mRNA depletion promoted cell apoptosis and inhibited invasion. Additionally, CEACAM6 mRNA depletion affected the progression of the GBC cell cycle to increase cell distribution in G0/G1 phase, and to reduce it in G2/M phase and S phase. These findings indicated that CEACAM6 overexpression may be related to the tumorigenesis and development of GBC. In summary, depletion of CEACAM6 mRNA suppressed the malignant biological behaviors of human gallbladder cancer cells.
Keywords: CEACAM6, gallbladder cancer, knockdown, proliferation, migration, invasion, apoptosis
Introduction
Gallbladder cancer (GBC) is the most common malignant tumor of the biliary system, ranking fifth among malignant tumors of the digestive system (1). It is characterized by early symptoms that are not obvious, and therefore it is difficult to diagnose, while its rapid invasion and metastasis occur early in tumorigenesis. The overall prognosis is extremely poor, and the 5-year survival rate of patients is only 5% (2,3). Early diagnosis, as well as effective inhibition of the proliferation of GBC cells and induction of apoptosis, has been the focus of researchers studying treatment approaches for GBC. We collected three cases of GBC and three specimens of benign gallbladder disease in the clinic. Through high-throughput gene chip technology, the gene expression of tissue specimens was detected and analyzed by whole gene expression profiling (Tian et al unpublished data). In descending order of absolute fold change (absoluteFC), P<0.0001 was used as the cutoff to check the chip results. After a thorough review of the available literature, carcinoembryonic antigen-related cell adhesion molecule 6 (CEACAM6; absoluteFC=10.60628, P=3.13011×10⁻⁵) was selected as the experimental index.
CEACAM6 is an important member of the immunoglobulin superfamily and is linked to the cell membrane by glycosyl phosphatidyl inositol, which is a non-specific cross-antigen. By binding to related proteins, CEACAM6 recognizes and binds to the E-box sequence in target gene DNA sequences to regulate gene activation and enhance transcriptional function. It has previously been reported that CEACAM6 was sparsely distributed on epithelial cells and vascular endothelial cells (4). Under the induction of oncogenic factors, the expression of CEACAM6 can be increased, which leads to the proliferation of tumor cells and increased cell proliferation (5). There is also evidence to support that CEACAM6 may have a role in the transition of cells entering S phase from G0/G1 phase, promoting cell transformation from normal protein synthesis to cell growth, which is more pronounced in pancreatic cancer cell invasion and metastasis (6,7). Therefore, considering the characteristics of CEACAM6 in cell regulation and its role in tumorigenesis, it was hypothesized that depletion of CEACAM6 gene expression may affect the biological behavior of GBC cells. In this study, immunohistochemistry was used to detect the expression of CEACAM6 in gallbladder tissues, and to evaluate whether silencing of CEACAM6 expression inhibited the proliferation, invasion and migration of GBC cells and induced apoptosis. These findings may provide novel avenues for early diagnosis and gene therapy of GBC.
Materials and methods
Patient samples
Gallbladder tissues were obtained from patients who underwent surgery at The First Affiliated Hospital of China Medical University (Shenyang, China) from October 2016 to July 2019. In addition, tissue microarrays of GBC specimens were purchased from Shanghai Outdo Biotech Co., Ltd. (cat. no. HGal-Ade100PG-01). Among them, 15 samples were collected from the hospital and 80 were included in the microarrays. Each microarray had a diameter of 1.5 mm, a thickness of 4 mm, and an integrality of >95%. The microarrays were processed using standard methods and underwent immunohistochemistry (8). A total of 95 specimens were obtained from 56 women and 39 men, with a median age of 67 years (range, 31–88 years). Based on the World Health Organization's 2019 tumor classification and differentiation criteria (9), 74 cases involved adenocarcinoma, six cases involved squamous cell carcinoma and 15 cases involved adenosquamous carcinoma. A total of 48 tumors were either highly differentiated (I) or moderately differentiated (I–II and II), and 47 tumors were poorly differentiated (II–III and III). The surgical findings revealed invasion of the surrounding tissue and organs in 41 cases, lymph node metastasis in 28 cases and distant metastasis in 14 cases. Follow-up data were available for 68 patients. All patients underwent cholecystectomy and did not receive any treatment before surgery. This study was approved by the Ethics Committee of The First Affiliated Hospital of China Medical University (approval no. 2018-207-2).
Immunohistochemistry
Tissues collected in the hospital (cancer tissues and peritumoral tissues from the same patient with GBC) were fixed with 4% paraformaldehyde for 48 h at room temperature, then washed, dehydrated and embedded in paraffin. A monoclonal antibody against CEACAM6 [cat. no. ab78029; Abcam; diluted with 1X TBS-0.05% Tween (TBST); 1:10,000] was stored at −20°C until use. Secondary antibodies diluted with 1X TBST (1:10,000) and EnVision™ Immunohistochemical kit were purchased from DAKO (Agilent Technologies, Inc.), and immunohistochemical staining was performed according to the EnVision™ two-step staining method. All slides were independently reviewed and graded by two senior pathologists, who randomly selected 10 high-power light microscope (magnification, ×200; Leica Microsystems GmbH) fields for each case. Immunohistochemical staining score = staining intensity score + positive cell score. The staining intensity of the cells was divided into 0 (negative staining), 1 (light yellow granules), 2 (brownish yellow granules) and 3 (brown granules). The method for scoring positive cells was: 0 (positive cell ratio ≤10%); 1 point (10% < positive cell ratio ≤25%); 2 points (25% < positive cell ratio ≤50%); 3 points (50% < positive cell ratio ≤75%); 4 points (75% < positive cell ratio ≤100%). Positive expression was considered for a total score >3 points (10–12). The negative control used 0.01 mol/l PBS (pH 7.4) instead of the primary antibody.
Cell culture
GBC cells GBC-SD and SGC-996 were purchased from the Shanghai Institute for Biological Science, Chinese Academy of Science and fetal bovine serum (FBS) was purchased from Gibco (Thermo Fisher Scientific, Inc.). The cells were cultured in DMEM (Gibco; Thermo Fisher Scientific, Inc.) supplemented with 10% FBS and 1% penicillin-streptomycin (Gibco; Thermo Fisher Scientific, Inc.). All cells were cultured at 37°C with 5% CO2. Medium was replaced depending on cell confluency and the cells were passaged using trypsin (Gibco; Thermo Fisher Scientific, Inc.).
Establishment of CEACAM6-depleted GBC cell lines
For CEACAM6 knockdown, small interfering RNA (siRNA) targeting CEACAM6 mRNA and a non-target negative control (NC) were purchased from JTS Scientific. The siRNA sequence based on CEACAM6 gene information was initially screened, and two sequences were selected for the experiment. GBC-SD and SGC-996 cells were seeded in six-well plates (5×10⁵ cells/plate), and transfection was performed when the cells had reached 70–80% confluence. siRNA and Lipofectamine® 2000 (Invitrogen; Thermo Fisher Scientific, Inc.) were diluted separately with DMEM for 5 min, and mixed and incubated at room temperature for 20 min. The prepared mixture was added to the cells (final volume, 2 ml), gently mixed and then placed in an incubator. After 24–48 h, the medium containing siRNA and Lipofectamine® 2000 was replaced with fresh medium. siRNA sequences were as follows: CEACAM6 siRNA1, sense 5′-GCGAAAGAGUGGAUGGCAATT-3′, antisense 5′-UUGCCAUCCACUCUUUCGCTT-3′; CEACAM6 siRNA2, sense 5′-CCACUGCCAAGCUCACUAUTT-3′, antisense: 5′-AUAGUGAGCUUGGCAGUGGTT-3′; NC siRNA, sense 5′-UUCUCCGAACGUGUCACGUTT-3′, and antisense 5′-ACGUGACACGUUCGGAGAATT-3′.
Experimental grouping
The cells were divided into four groups: siRNA1 group, siRNA2 group, siNC group, and blank (untransfected) control group. The NC group consisted of GBC cells transfected with scrambled sequences, and GBC cells that were not transfected with any plasmid were selected as the blank group. After transfection, mRNA and protein expression were detected by reverse-transcription quantitative PCR (RT-qPCR) and western blotting, respectively. The degree of knockdown was determined to select the better candidate for subsequent experiments.
RT-qPCR
Total RNA was extracted using RNAiso Plus (Takara, Bio Inc.), according to the manufacturer's instructions. Total RNA concentration was measured with a Nanodrop 1000 (Nanodrop; Thermo Fisher Scientific, Inc.) and the concentration was adjusted. RT was then performed using PrimeScript™ RT Master Mix reagent kit (Takara, Bio, Inc.), as follows: 37°C for 15 min, 85°C for 5 sec and 4°C cooling for 30 min. Finally, amplification was performed using TB Green® Premix Ex Taq™ II kit (Takara, Bio, Inc.), and the quantification cycle (Cq) value was detected by an amplification instrument (ABI7500; Applied Biosystems; Thermo Fisher Scientific, Inc.). All protocols and reaction conditions were performed in accordance with the manufacturers' instructions. The amplification program was as follows: 95°C for 30 sec, followed by 40 cycles at 95°C for 5 sec and 60°C for 34 sec. In order to establish the melting curve of the PCR product, after completion of the amplification reaction, samples were incubated at 95°C for 15 sec, 60°C for 60 sec and 95°C for 15 sec. Relative quantification analysis was conducted according to the 2−ΔΔCq method (13). CEACAM6 primers were synthesized by Shanghai Sangon Bioengineering Co., Ltd. All experiments were performed three times independently. Primer sequences were as follows: CEACAM6, forward 5′-GCGGATCCTATATGTGCCAAGCC-3′, reverse 5′-GCGGATCCTATATGTGCCAAGCC-3′; GAPDH, forward 5′-TGACATCAAGAAGGTGGTGAAGCAG-3′ and reverse 5′-GTGTCGCTGTTGAAGTCAGAGGAG-3′.
Western blotting
The experimental cells, NC cells and blank cells were trypsinized and washed with PBS. The protein was extracted with RIPA (Beijing Solarbio Science and Technology Co., Ltd.) lysis buffer (containing 1% PMSF) at 4°C. The protein concentration was determined by BCA, and the blended protein sample was mixed with the loading buffer to be boiled and denatured. Proteins were resolved by SDS-PAGE on a 10% gel (Beyotime Institute of Biotechnology). The resolved proteins were then transferred to PVDF membranes at low temperature, and blocked for 1 h at room temperature in 0.5% skim milk powder dissolved with TBST. Membranes were incubated in anti-CEACAM6 (1:20,000; cat. no. ab134074; Abcam), GAPDH (1:10,000; cat. no. ab181602; Abcam), BAX (1:5,000; cat. no. 50599-2-Ig; Proteintech Group, Inc.), BCL-2 (1:2,000; cat. no. 12789-1-AP; Proteintech Group, Inc.), Vimentin (1:5,000; cat. no. 10366-1-AP; Proteintech Group, Inc.) and matrix metalloproteinase-2 (MMP-2; 1:500; cat. no. 10373-2-AP; Proteintech Group, Inc.) overnight at 4°C, and washed three times with 1X TBST for 10 min each time. Then the membranes were incubated for 1 h at room temperature with a secondary antibody (cat. no. PV-9003; 1:10,000; OriGene Technologies, Inc.) and washed three times with 1X TBST for 10 min before treatment with enhanced chemiluminescence working solution (ELC Advance kit; Beyotime Institute of Biotechnology) and scanning by Bio-Imaging Systems (MicroChemi4.2). ImageJ 1.4.3 software (National Institute of Health) was used to process the images and to analyze the gray value of the protein bands. The relative expression levels of the target proteins were calculated as the ratio of the gray value of each group of target proteins to the corresponding GAPDH expression. All experiments were performed three times independently.
Cell Counting Kit-8 (CCK8) assay and colony formation assay
GBC cells in logarithmic phase were transfected for 24 h, trypsinized and seeded in a 96-well plate at a density of 3,000 cells/well. Following the manufacturers' instructions, the absorbance (450 nm) at different time points (0, 24, 48 and 72 h) was measured, and the optical density (OD) value was determined by a microplate reader (Gene Company Ltd.).
For colony formation assay, after 24 h of transfection of cells in the logarithmic phase of growth, the cells were seeded into 6-well plates at a concentration of 1,000 cells/well and then cultured in medium containing 30% FBS for 10 days. Cell colonies were fixed with 4% paraformaldehyde for 20 min at room temperature and then stained with crystal violet for 20 min at room temperature. Cell colonies were then observed and counted.
Cell apoptosis assay
Cells were transfected with CEACAM6 siRNA or NC siRNA for 24 h, then trypsinized and washed using precooled PBS. After centrifugation (300 × g, 5 min, room temperature), the supernatant was discarded and cells were gently resuspended in 195 ml buffer solution. Then, 5 µl Annexin V-FITC and 10 ml propidium iodide (PI) (Beyotime Institute of Biotechnology, Inc.) was added to each sample and incubated at room temperature for 15 min in the dark. Flow cytometry (BD FACSAria™ Cell Sorter; BD Biosciences) was performed immediately after adding 300 µl binding buffer to each sample. Cell cycle distribution was analyzed using FlowJo 7.6 software (FlowJo LLC) and western blot analysis was performed to detect the expression levels of BAX and BCL-2.
Cell cycle analysis
After 24 h of transfection of GBC cells in the logarithmic phase, the cells were washed with precooled PBS, fixed in 70% alcohol at 4°C for 12 h, and then washed with PBS that was removed by centrifugation (300 × g, 5 min, room temperature). An appropriate volume of PI staining solution with RNase was prepared according to the kit instructions (Cell Cycle and Apoptosis Analysis Kit; Beyotime Institute of Biotechnology) and the cells were resuspended in the staining solution and incubated for 30 min at room temperature in the dark. Red fluorescence was detected by flow cytometry at an excitation wavelength of 488 nm, and cell DNA content analysis was performed using Flow Jo 7.6 software.
Migration and invasion assays
GBC cells in the logarithmic phase were transfected for 24 h, resuspended in serum-free medium and seeded into the upper chambers of Transwell plates, whereas complete DMEM (supplemented with 10% FBS) was added to the lower chambers. All chambers of Transwell plates were coated in Matrigel (cat. no. 354234; Corning, Inc.) to explore the invasive ability. Briefly, 60 µl diluted Matrigel (1:6) was added to each of the upper chambers and incubated at 37°C for 30 min to polymerize Matrigel into a gel. After 24 h incubation at 37°C, the medium and cells on the upper side of the chambers were removed, and cells on the bottom of the chambers were fixed with 4% paraformaldehyde for 20 min at room temperature. Crystal violet staining was performed for 20 min at room temperature, then the staining agent was washed away with water. Cells penetrating the membrane in the Transwell chamber were counted by light microscopy (Leica Microsystems GmbH). Western blot analysis was performed to detect expression levels of MMP-2 and Vimentin.
Wound-healing assay
After 24 h of transfection of GBC cells in logarithmic phase, the cells were seeded in six-well plates and grown to 90% confluence. The cell layers were scratched using a sterile 200-µl pipette tip to create a wound gap. The plates were then washed with PBS and cultured in medium at 37°C with 5% CO2 for 24 h. Images were captured at 0 and 24 h using a microscope and the wound area was measured with ImageJ 1.8 software.
Statistical analysis
All analyses were performed using IBM SPSS Statistics 25.0 (IBM Corp.). Associations between CEACAM6 expression and the patients' clinicopathological characteristics were evaluated using the χ2 test or Fisher's exact test, as appropriate. The overall survival rates were evaluated using Kaplan-Meier curves and the log-rank test. The measurement data were expressed as the mean ± standard error. The independent Student's t-test was performed to compare the mean of two groups and one-way ANOVA followed by Tukey's post hoc test was used for comparisons between multiple groups. P<0.05 was considered to indicate a statistically significant difference.
Results
Expression of CEACAM6 in GBC and peritumoral tissues
Among the 95 cases of patients with GBC, there were 40 matched pairs of carcinoma and peritumoral tissues. Among them, CEACAM6 was highly expressed in 10 cases of both carcinoma and peritumoral tissue specimens, while five cases exhibited low expression in both carcinoma and peritumoral tissues. There were 18 cases of high expression in carcinoma but low expression in peritumoral tissues, and seven cases of low expression in carcinoma but high expression in peritumoral tissues (Table I).
Table I.
Expression of CEACAM6 in gallbladder carcinoma and peritumoral tissues.
| Characteristic | Low expression in peritumoral tissues | High expression in peritumoral tissues | χ2 | P-value |
|---|---|---|---|---|
| Low expression in gallbladder carcinoma | 5 | 7 | 4.84 | 0.027 |
| High expression in gallbladder carcinoma | 18 | 10 |
CEACAM6, carcinoembryonic antigen-related cell adhesion molecule 6.
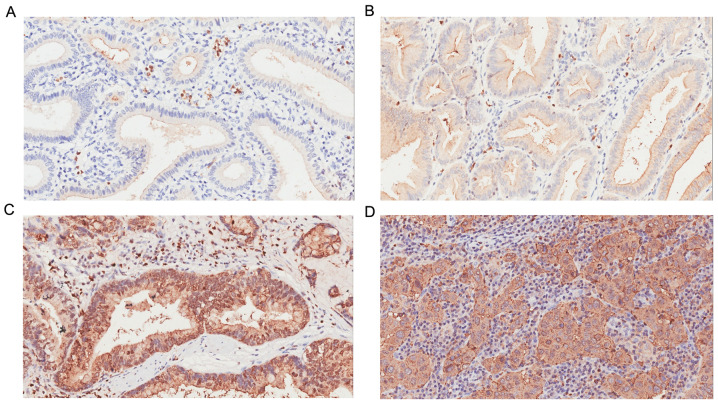
GBC specimens had significantly stronger CEACAM6 expression than the matched peritumoral tissues (Fig. 1). However, CEACAM6 expression in the GBC specimens was not significantly associated with sex, age, pathological type, tissue invasion, lymph node metastasis and distant metastasis, but was related to the pathological classification (Table II).
Figure 1.
CEACAM6 staining (A) Negative expression of CEACAM6 in peritumoral tissue. (B) Positive expression of CEACAM6 in well-differentiated gallbladder carcinoma tissue. (C) Positive expression of CEACAM6 in moderately differentiated gallbladder carcinoma tissue. (D) Positive expression of CEACAM6 in poorly differentiated gallbladder carcinoma tissue. Magnification, ×200. CEACAM6, carcinoembryonic antigen-related cell adhesion molecule 6.
Table II.
Relationship between CEACAM6 expression and clinicopathological characteristics of patients with gallbladder cancer.
| CEACAM6 expression | ||||
|---|---|---|---|---|
| Characteristic | High | Low | χ2 | P-value |
| Sex | 0.620 | |||
| Male | 22 | 17 | 0.264 | |
| Female | 41 | 15 | ||
| Age | 0.825 | |||
| ≤60 years | 17 | 11 | 0.049 | |
| >60 years | 46 | 21 | ||
| Pathological type | 0.282 | |||
| Adenocarcinoma | 51 | 23 | 1.159 | |
| Squamous cell carcinoma | 3 | 3 | ||
| Adenosquamous carcinoma | 9 | 6 | ||
| Differentiation degree | 0.036 | |||
| I, I–II, II | 27 | 21 | 4.401 | |
| II–III, III | 36 | 11 | ||
| Tissue invasion | 0.828 | |||
| No | 36 | 18 | 0.047 | |
| Yes | 27 | 14 | ||
| Lymph node metastasis | 0.062 | |||
| No | 47 | 20 | 3.489 | |
| Yes | 14 | 14 | ||
| Distant metastasis | 0.087 | |||
| No | 52 | 29 | 2.936 | |
| Yes | 11 | 3 | ||
CEACAM6, carcinoembryonic antigen-related cell adhesion molecule 6.
CEACAM6 expression is associated with survival among 68 patients with follow-up data
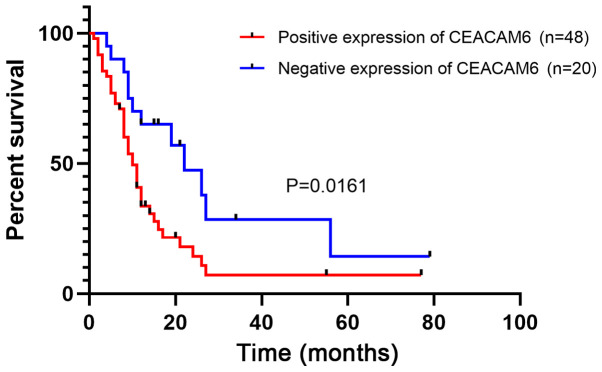
A total of 68 of the 95 patients had available postoperative follow-up data, which were obtained using telephone or mail. At the end of the follow-up period, 22 patients were alive and 46 patients had died, with an average survival interval of 14.6±17.8 months. A total of 41 of the 68 patients had high expression of CEACAM6, and the Kaplan-Meier analysis revealed that positive expression of CEACAM6 was associated with poor long-term survival (Fig. 2).
Figure 2.
Kaplan-Meier analysis of the association of CEACAM6 expression with overall survival in patients with gall bladder cancer (n=68). CEACAM6, carcinoembryonic antigen-related cell adhesion molecule 6.
Expression of CEACAM6 in each group
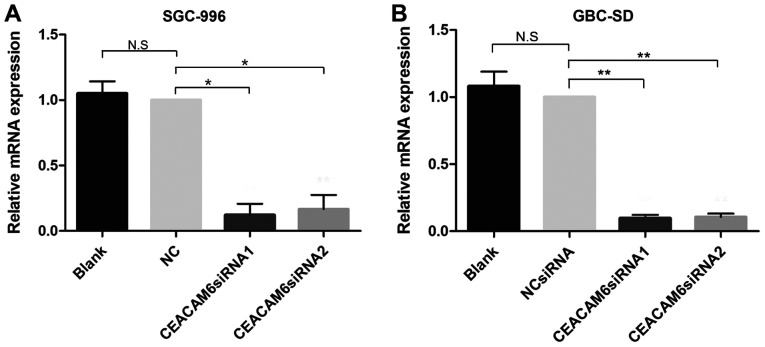
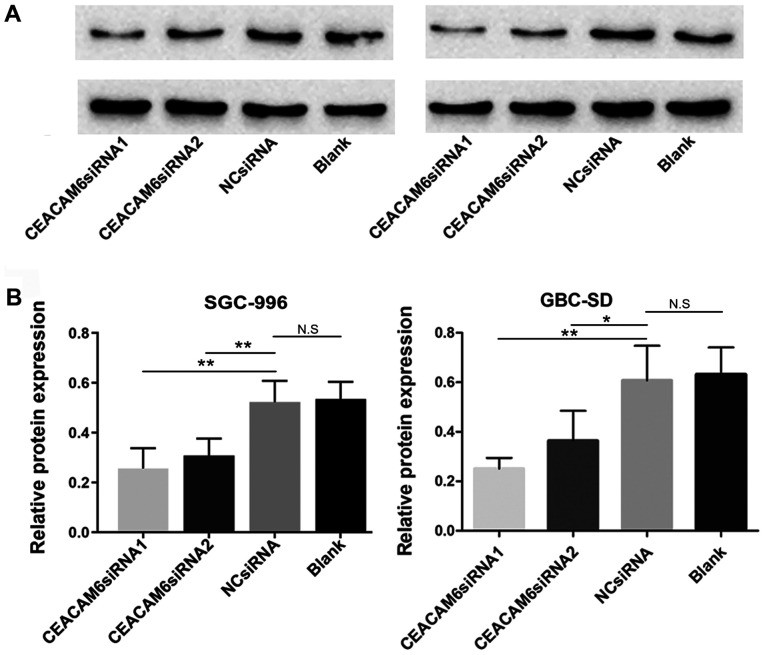
RT-qPCR revealed that following transfection with the candidate siRNAs, CEACAM6 mRNA expression in SGC-996 and GBC-SD cells was significantly lower than that in the NC and blank control groups after 24 h of transfection (P<0.05; Fig. 3). Western blotting, and further semi-quantification also found that 48 h after transfection, CEACAM6 protein expression was significantly reduced (P<0.05; Fig. 4). Furthermore, the results also demonstrated that the depletion efficiency of CEACAM6 siRNA1 was more effective than that of CEACAM6 siRNA2, and thus was used in the subsequent experiments.
Figure 3.
CEACAM6 depletion efficiency was evaluated by RT-qPCR in (A) SGC-996 and (B) GBC-SD cells. Relative mRNA expression represents the ratio of CEACAM6 siRNA group to the NC siRNA group. GAPDH was used as an internal control. The data represent the mean ± standard deviation of three independent experiments. *P<0.05, **P<0.01 vs. NC group. CEACAM6, carcinoembryonic antigen-related cell adhesion molecule 6; NC, negative control; n.s., not significant; siRNA, small interfering RNA.
Figure 4.
CEACAM6 protein depletion efficiency (A) evaluated by western blotting. (B) Semi-quantitative analysis of protein expression of CEACAM6 represented as the ratio of the target protein to its corresponding GAPDH loading control. The data represent the mean ± standard deviation of three independent experiments. *P<0.05, **P<0.01 vs. NC group. CEACAM6, carcinoembryonic antigen-related cell adhesion molecule 6; NC, negative control; n.s., not significant; siRNA, small interfering RNA.
CEACAM6 knockdown inhibits the proliferation of GBC-SD and SGC-996 cells
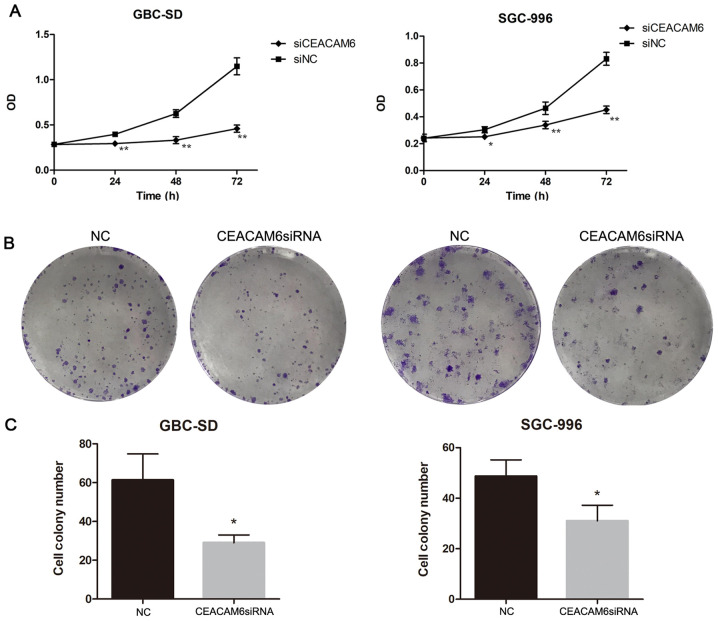
To evaluate the effect of CEACAM6 depletion on the proliferation of GBC cells, CCK8 and colony formation assays were performed. Compared with the NC group, the cell proliferation of the CEACAM6 siRNA group was significantly decreased (P<0.05; Fig. 5A). Furthermore, the colony formation assay showed that the number of cell colonies was also decreased as a result of CEACAM6 knockdown (P<0.05; Fig. 5B and C).
Figure 5.
Effect of depletion of CEACAM6. (A) Changes over 3 days in GBC-SD and SGC-996 cells measured by CCK8 assay. (B and C) Colony formation analysis of the cell colony number after transfection with CEACAM6 siRNA and NC siRNA in GBC-SD cells and in SGC-996 cells. *P<0.05, **P<0.01 vs. NC group. CEACAM6, carcinoembryonic antigen-related cell adhesion molecule 6; NC, negative control; siRNA, small interfering RNA.
Knockdown of CEACAM6 promotes apoptosis of GBC-SD and SGC-996 cells
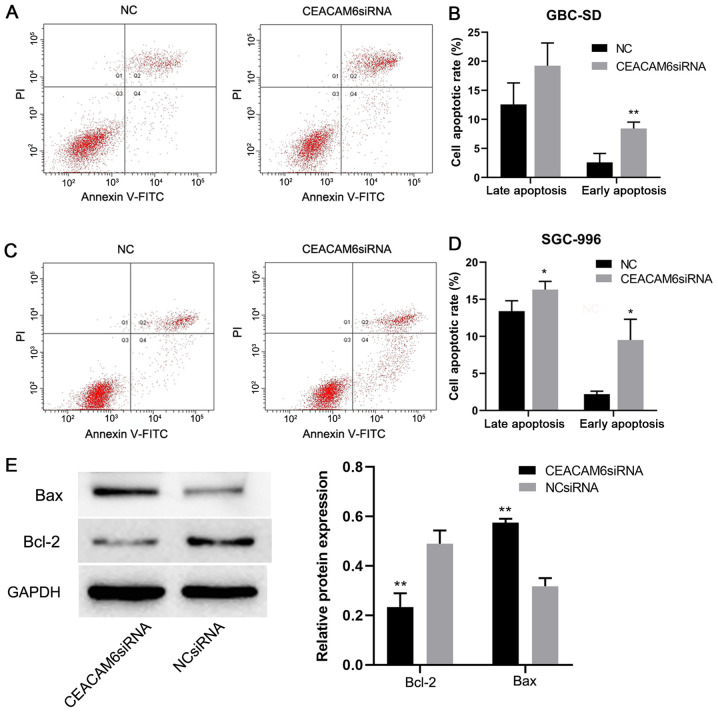
After 24 h of transfection, the early apoptotic rate of GBC-SD and SGC-996 cells in the CEACAM6 siRNA group was significantly higher than that of the NC group (P<0.05; Fig. 6A-D). BCL-2 expression in the CEACAM6 siRNA group was significantly lower than that in the NC group, and the expression levels of BAX in the CEACAM6 siRNA group were significantly higher than those in the NC group (P<0.01; Fig. 6E). This suggested that depletion of CEACAM6 could promote the apoptosis of GBC cells.
Figure 6.
Effect of depletion of CEACAM6 on apoptosis. (A and C) Flow cytometric analysis of apoptosis of SGC-996 and GBC-SD cells with Annexin V/PI staining. (B and D) Early and late apoptotic rates in SGC-996 and GBC-SD cells. (E) Expression levels of BAX and BCL-2 in the cells transfected with siRNA targeting CEACAM6 and the NC group. *P<0.05, **P<0.01 vs. NC group. CEACAM6, carcinoembryonic antigen-related cell adhesion molecule 6; NC, negative control; siRNA, small interfering RNA; PI, propidium iodide.
Knockdown of CEACAM6 affects the cell cycle progression of GBC-SD and SGC-996 cells
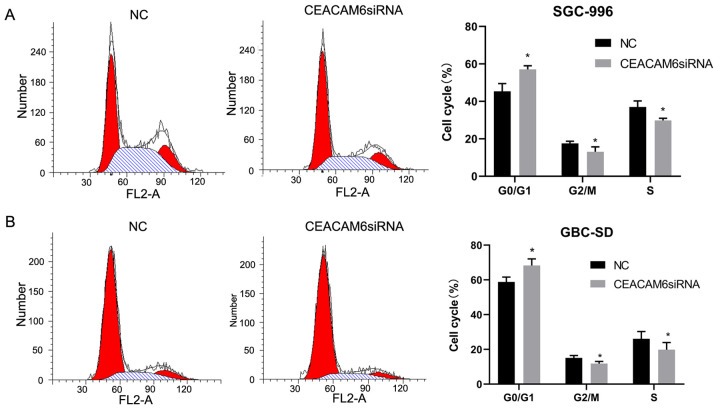
The effect of knockdown of CEACAM6 on the cell cycle distribution of GBC-SD and SGC-996 cells was further analyzed. In SGC-996 cells, 57.08±1.93% of cells transfected with siRNA targeting CEACAM6 were in G0/G1 phase, 13.09±2.61% were in G2/M phase and 29.82±1.17% were in S phase (Fig. 7). Of cells in the NC group, 45.39±4.12% were in G0/G1 phase, 17.54±1.16% were in G2/M phase, and 37.06±3.18% were in S phase. In GBC-SD cells, 68.3±3.8% of cells treated with siRNA targeting CEACAM6 were in G0/G1 phase, 11.84±1.22% were in G2/M phase, and 19.85±4.1% were in S phase. Among NC group cells, 58.8±2.83% were in G0/G1 phase, 15.1±1.42% were in G2/M phase and 26.09±4.18% were in S phase. The results showed that the percentage of cells transfected with siRNA targeting CEACAM6 in G0/G1 phase was increased, but the percentage of cells in the G2/M phase and S phase were reduced compared with cells in the NC group (P<0.05; Fig. 7).
Figure 7.
Depletion of CEACAM6 affects cell cycle distribution. Flow cytometric analysis of cell cycle distribution of (A) SGC-996 and (B) GBC-SD cells transfected with CEACAM6 siRNA or NC siRNA. *P<0.05 vs. NC group. CEACAM6, carcinoembryonic antigen-related cell adhesion molecule 6; NC, negative control; siRNA, small interfering RNA.
Knockdown of CEACAM6 inhibits the migration and invasion of GBC-SD and SGC-996 cells
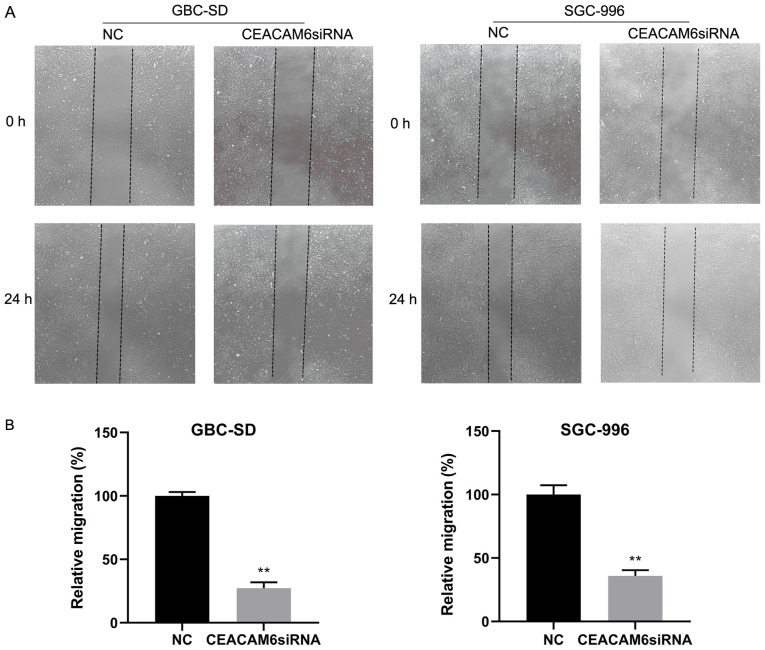
The results of wound-healing assays in GBC-SD and SGC-996 cells showed that the migratory ability of cells transfected with siRNA targeting CEACAM6 was significantly reduced after 24 h of transfection compared with the NC group (P<0.01; Fig. 8).
Figure 8.
Effect of CEACAM6 knockdown on wound healing. (A) Wound-healing analysis of cell migration after transfection of CEACAM6 siRNA and NC siRNA in GBC-SD and SGC-996 cells (magnification, ×50). (B) Relative migration is shown in relevant graph bars. **P<0.01 vs. NC group. CEACAM6, carcinoembryonic antigen-related cell adhesion molecule 6; NC, negative control; siRNA, small interfering RNA.
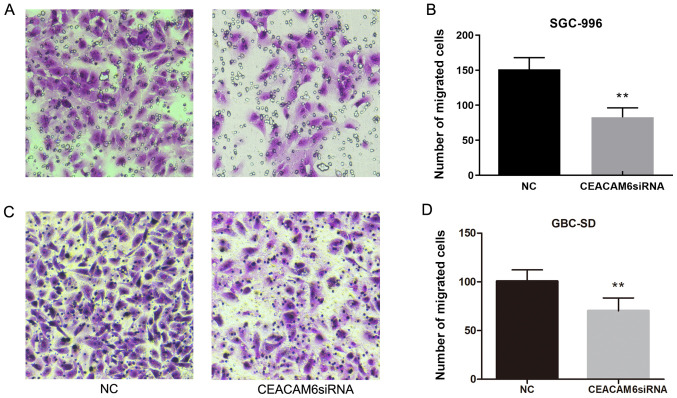
Transwell assays were further conducted to assess the migration and invasion of GBC-SD and SGC-996 cells. As shown in Fig. 9, the number of stained cells was reduced in cells transfected with siRNA targeting CEACAM6 compared with the NC group after 24 h of transfection (P<0.01). The results indicated that depletion of CEACAM6 could reduce the migration ability of GBC cells.
Figure 9.
Effect of CEACAM6 depletion on cell migration. (A and C) Transwell analysis of cell migration potential after transfection of SGC-996 and GBC-SD cells with siRNA targeting CEACAM6 and NC siRNA (magnification, ×200). (B and D) Cell counts are shown in relevant graph bars. **P<0.01 vs. NC group. CEACAM6, carcinoembryonic antigen-related cell adhesion molecule 6; NC, negative control; siRNA, small interfering RNA.
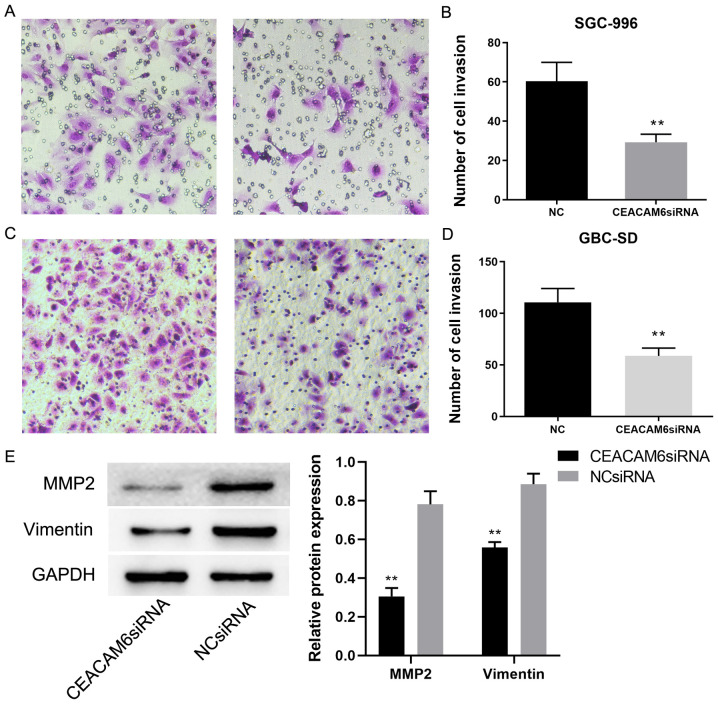
In a further experiment, the chambers of Transwell plates were coated in Matrigel to explore the invasive ability of GBC-SD and SGC-996 cells. It was found that there were fewer stained cells that had undergone transfection with siRNA targeting CEACAM6 compared with those in the NC group (P<0.01; Fig. 10A-D). MMP-2 and Vimentin expression levels in cells transfected with siRNA targeting CEACAM6 were significantly lower than that in the NC group (P<0.01; Fig. 10E). This indicated that depletion of CEACAM6 may reduce the invasive ability of GBC cells.
Figure 10.
Effect of CEACAM6 depletion on cell invasion. (A and C) Transwell analysis of cell invasion potential after the SGC-996 and GBC-SD cells were transfected with either siRNA targeting CEACAM6 or the NC siRNA (magnification, ×200). (B and D) Cell counts are shown in relevant graph bars. (E) Expression levels of MMP2 and Vimentin in CEACAM6 siRNA and NC groups. **P<0.01 vs. NC group. CEACAM6, carcinoembryonic antigen-related cell adhesion molecule 6; MMP-2, matrix metalloprotease-2; NC, negative control; siRNA, small interfering RNA.
Discussion
With improvements in imaging technology and public health awareness, the number of GBC cases diagnosed in China has increased in recent years (14). Early symptoms of GBC are not obvious, and the disease metastasizes early in its development with high mortality. Although new tumor markers have emerged in recent years (15), no specific markers for GBC have been validated to improve diagnostic rates and targeted therapy. CEACAM proteins have been reported to play a role in cell adhesion, intercellular signaling, inflammation (16,17), tumor invasion, metastasis and apoptosis (18,19). CEACAM6 is a member of the family of CEACAMs, and is upregulated in solid tumors, especially digestive system tumors (20), with an important role in the tumorigenesis and development of digestive system tumors. It was previously demonstrated that robust expression of CEACAM6 was found in >90% of invasive pancreatic adenocarcinomas and may be a potential therapeutic target for pancreatic adenocarcinoma (21). In several malignancies, including gastric cancer (22) and colorectal cancer (23,24), CEACAM6 overexpression was confirmed to be associated with lymph node and distant metastasis, increased risk of relapse and reduced survival. Moreover, experimental results from several gastric cell lines showed that the invasive ability of tumor cells was significantly enhanced by overexpressing CEACAM6 (25). It was subsequently demonstrated that CEACAM6 may promote epithelial-mesenchymal transition through the PI3K/AKT signaling pathway to enhance the invasion and metastasis of gastric cancer (26). This view has also been confirmed in the study of pancreatic cancer (27).
To the best of our knowledge, this study was the first to explore the role of CEACAM6 as an oncogene in GBC cell lines, and to deplete expression of CEACAM6 in GBC cell lines by siRNA transfection. The present study revealed that CEACAM6 expression was increased in GBC tissues compared with peritumoral tissue tissues, and its high expression was significantly associated with a worse prognosis. There was no significant association between CEACAM6 expression levels and multiple clinicopathological features, indicating that a larger number of specimens might be required.
In in vitro experiments, the effect of CEACAM6 knockdown on the biological behavior of GBC cells was investigated. The siRNA candidate that had a better CEACAM6 gene silencing effect was selected and it was demonstrated that the depletion of CEACAM6 significantly inhibited the proliferation of GBC cells. This was consistent with previous studies, which demonstrated that CEACAM6 silencing halted colorectal cancer growth in vitro and in vivo (28). Lewis-Wambi et al (29) showed that overexpression of CEACAM6 could promote the migration and invasion of estrogen-deprived breast cancer cells, and suggested that this protein might be an important biomarker of metastasis. In Transwell experiments, the number of invading cells was significantly lower in cells transfected with siRNA targeting CEACAM6 than in cells transfected with the NC siRNA; this indicated that depletion of CEACAM6 also inhibited the migration and invasion of GBC cells. Some researchers in the study of oral squamous cell carcinoma postulated that one of the potential mechanisms by which CEACAM6 promotes migration and invasion could be through the epidermal growth factor receptor signaling pathway via glycosylation (30). Additionally, depletion of CEACAM6 could affect GBC cell cycle distribution to increase the proportion of cells in G0/G1 phase and to reduce the number of cells in G2/M phase and S phase. In future research, it would be interesting to perform gene co-expression analysis of CEACAM6 using Oncomine, and identify significant genes (P<0.0001) that display fold changes of >2 using the gene chip GSE2109. This chip contains samples from 1,911 tumors including gallbladder adenocarcinomas. According to the results of a future co-expression analysis, the top 100 co-expressed genes highly associated with CEACAM6 will be selected and enrichment analysis will be performed using FUNRICH software, with the most relevant pathway being chosen for follow-up research. In addition, we aim to undertake lentiviral short hairpin RNA-mediated gene silencing in future research and utilize in vivo models to further validate the conclusions.
In conclusion, the expression of CEACAM6 in GBC and its role in GBC cell lines suggests that CEACAM6 may have potential as a biomarker and may represent an important target for tumor therapy in GBC. Therefore, the specific molecular mechanism of CEACAM6 in GBC requires further exploration.
Acknowledgements
The authors would like to thank Dr H. Nikki March for editing the English text of a draft of this manuscript.
Funding
This study was funded in part by Liaoning Department of Education (grant no. L2014294).
Authors' contributions
CG designed the study. CT performed most of the experiments, analyzed the data and wrote the manuscript. BZ performed the immunohistochemistry experiments and provided the results. All authors read and approved the final manuscript and agreed to be accountable for all aspects of the research in ensuring that the accuracy and integrity of any part of the work are appropriately investigated and resolved.
Ethics approval and consent for participation
This study was approved by the Clinical Experiment Ethics Committee of The First Affiliated Hospital of China Medical University (2018-207-2). Patients provided written informed consent.
Patient consent for publication
Not applicable.
Competing interests
The authors declare that they have no competing interests.
References
- 1.Sharma A, Sharma KL, Gupta A, Yadav A, Kumar A. Gallbladder cancer epidemiology, pathogenesis and molecular genetics: Recent update. World J Gastroenterol. 2017;23:3978–3998. doi: 10.3748/wjg.v23.i22.3978. [DOI] [PMC free article] [PubMed] [Google Scholar]
- 2.Hari DM, Howard JH, Leung AM, Chui CG, Sim MS, Bilchik AJ. A 21-year analysis of stage I gallbladder carcinoma: Is cholecystectomy alone adequate? HPB (Oxford) 2013;15:40–48. doi: 10.1111/j.1477-2574.2012.00559.x. [DOI] [PMC free article] [PubMed] [Google Scholar]
- 3.Dwivedi AN, Jain S, Dixit R. Gall bladder carcinoma: Aggressive malignancy with protean loco-regional and distant spread. World J Clin Cases. 2015;3:231–244. doi: 10.12998/wjcc.v3.i3.231. [DOI] [PMC free article] [PubMed] [Google Scholar]
- 4.Singer BB, Scheffrahn I, Kammerer R, Suttorp N, Ergun S, Slevogt H. Deregulation of the CEACAM expression pattern causes undifferentiated cell growth in human lung adenocarcinoma cells. PLoS One. 2010;5:e8747. doi: 10.1371/journal.pone.0008747. [DOI] [PMC free article] [PubMed] [Google Scholar]
- 5.Cheng TM, Murad YM, Chang CC, Yang MC, Baral TN, Cowan A, Tseng SH, Wong A, Mackenzie R, Shieh DB, Zhang J. Single domain antibody against carcinoembryonic antigen-related cell adhesion molecule 6 (CEACAM6) inhibits proliferation, migration, invasion and angiogenesis of pancreatic cancer cells. Eur J Cancer. 2014;50:713–721. doi: 10.1016/j.ejca.2012.07.019. [DOI] [PubMed] [Google Scholar]
- 6.Duxbury MS, Ito H, Benoit E, Ashley SW, Whang EE. CEACAM6 is a determinant of pancreatic adenocarcinoma cellular invasiveness. Br J Cancer. 2004;91:1384–1390. doi: 10.1038/sj.bjc.6602113. [DOI] [PMC free article] [PubMed] [Google Scholar]
- 7.Yan L, Wang Y, Wang ZZ, Rong YT, Chen LL, Li Q, Liu T, Chen YH, Li YD, Huang ZH, Peng J. Cell motility and spreading promoted by CEACAM6 through cyclin D1/CDK4 in human pancreatic carcinoma. Oncol Rep. 2016;35:418–426. doi: 10.3892/or.2015.4338. [DOI] [PubMed] [Google Scholar]
- 8.Sanchez-Carbayo M. Antibody microarrays as tools for biomarker discovery. Methods Mol Biol. 2011;785:159–182. doi: 10.1007/978-1-61779-286-1_11. [DOI] [PubMed] [Google Scholar]
- 9.Nagtegaal ID, Odze RD, Klimstra D, Paradis V, Rugge M, Schirmacher P, Washington MK, Carneiro F, Cree IA, WHO Classification of Tumours Editorial Board The 2019 WHO classification of tumours of the digestive system. Histopathology. 2020;76:182–188. doi: 10.1111/his.13975. [DOI] [PMC free article] [PubMed] [Google Scholar]
- 10.Xiong L, Deng X, Wen Y, Yang Z, Miao X. Association of BDNF and BMPR1A with clinicopathologic parameters in benign and malignant gallbladder lesions. World J Surg Oncol. 2013;11:80. doi: 10.1186/1477-7819-11-80. [DOI] [PMC free article] [PubMed] [Google Scholar]
- 11.Yuan LW, Liu DC, Yang ZL. Correlation of S1P1 and ERp29 expression to progression, metastasis, and poor prognosis of gallbladder adenocarcinoma. Hepatobiliary Pancreat Dis Int. 2013;12:189–195. doi: 10.1016/S1499-3872(13)60030-2. [DOI] [PubMed] [Google Scholar]
- 12.Deng X, Pei D. Ornithine decarboxylase and glutamate decarboxylase 65 as prognostic markers of gallbladder malignancy: A clinicopathological study in benign and malignant lesions of the gallbladder. Mol Med Rep. 2013;7:413–418. doi: 10.3892/mmr.2012.1178. [DOI] [PubMed] [Google Scholar]
- 13.Schmittgen TD, Livak KJ. Analyzing real-time PCR data by the comparative C(T) method. Nat Protoc. 2008;3:1101–1108. doi: 10.1038/nprot.2008.73. [DOI] [PubMed] [Google Scholar]
- 14.Yuan HX, Wang WP, Guan PS, Lin LW, Wen JX, Yu Q, Chen XJ. Contrast-enhanced ultrasonography in differential diagnosis of focal gallbladder adenomyomatosis and gallbladder cancer. Clin Hemorheol Microcirc. 2018;70:201–211. doi: 10.3233/CH-180376. [DOI] [PubMed] [Google Scholar]
- 15.Montalvo-Jave EE, Rahnemai-Azar AA, Papaconstantinou D, Deloiza ME, Tsilimigras DI, Moris D, Mendoza-Barrera GE, Weber SM, Pawlik TM. Molecular pathways and potential biomarkers in gallbladder cancer: A comprehensive review. Surg Oncol. 2019;31:83–89. doi: 10.1016/j.suronc.2019.09.006. [DOI] [PubMed] [Google Scholar]
- 16.Kelleher M, Singh R, O'Driscoll CM, Melgar S. Carcinoembryonic antigen (CEACAM) family members and inflammatory bowel disease. Cytokine Growth Factor Rev. 2019;47:21–31. doi: 10.1016/j.cytogfr.2019.05.008. [DOI] [PubMed] [Google Scholar]
- 17.Klaile E, Müller MM, Schäfer MR, Clauder AK, Feer S, Heyl KA, Stock M, Klassert TE, Zipfel PF, Singer BB, Slevogt H. Binding of candida albicans to human CEACAM1 and CEACAM6 modulates the inflammatory response of intestinal epithelial cells. MBio. 2017;8:e02142. doi: 10.1128/mBio.02142-16. [DOI] [PMC free article] [PubMed] [Google Scholar]
- 18.Beauchemin N, Arabzadeh A. Carcinoembryonic antigen-related cell adhesion molecules (CEACAMs) in cancer progression and metastasis. Cancer Metastasis Rev. 2013;32:643–671. doi: 10.1007/s10555-013-9444-6. [DOI] [PubMed] [Google Scholar]
- 19.Gebauer F, Wicklein D, Horst J, Sundermann P, Maar H, Streichert T, Tachezy M, Izbicki JR, Bockhorn M, Schumacher U. Carcinoembryonic antigen-related cell adhesion molecules (CEACAM) 1, 5 and 6 as biomarkers in pancreatic cancer. PLoS One. 2014;9:e113023. doi: 10.1371/journal.pone.0113023. [DOI] [PMC free article] [PubMed] [Google Scholar]
- 20.Balk-Møller E, Kim J, Hopkinson B, Timmermans-Wielenga V, Petersen OW, Villadsen R. A marker of endocrine receptor-positive cells, CEACAM6, is shared by two major classes of breast cancer: Luminal and HER2-enriched. Am J Pathol. 2014;184:1198–1208. doi: 10.1016/j.ajpath.2013.12.013. [DOI] [PubMed] [Google Scholar]
- 21.Strickland LA, Ross J, Williams S, Ross S, Romero M, Spencer S, Erickson R, Sutcliffe J, Verbeke C, Polakis P, et al. Preclinical evaluation of carcinoembryonic cell adhesion molecule (CEACAM) 6 as potential therapy target for pancreatic adenocarcinoma. J Pathol. 2009;218:380–390. doi: 10.1002/path.2545. [DOI] [PubMed] [Google Scholar]
- 22.Zhao ZS, Li L, Wang HJ, Wang YY. Expression and prognostic significance of CEACAM6, ITGB1, and CYR61 in peripheral blood of patients with gastric cancer. J Surg Oncol. 2011;104:525–529. doi: 10.1002/jso.21984. [DOI] [PubMed] [Google Scholar]
- 23.Kim KS, Kim JT, Lee SJ, Kang MA, Choe IS, Kang YH, Kim SY, Yeom YI, Lee YH, Kim JH, et al. Overexpression and clinical significance of carcinoembryonic antigen-related cell adhesion molecule 6 in colorectal cancer. Clin Chim Acta. 2013;415:12–19. doi: 10.1016/j.cca.2012.09.003. [DOI] [PubMed] [Google Scholar]
- 24.Jantscheff P, Terracciano L, Lowy A, Glatz-Krieger K, Grunert F, Micheel B, Brümmer J, Laffer U, Metzger U, Herrmann R, Rochlitz C. Expression of CEACAM6 in resectable colorectal cancer: A factor of independent prognostic significance. J Clin Oncol. 2003;21:3638–3646. doi: 10.1200/JCO.2003.55.135. [DOI] [PubMed] [Google Scholar]
- 25.Zhang Y, Zang M, Li J, Ji J, Zhang J, Liu X, Qu Y, Su L, Li C, Yu Y, et al. CEACAM6 promotes tumor migration, invasion, and metastasis in gastric cancer. Acta Biochim Biophys Sin (Shanghai) 2014;46:283–290. doi: 10.1093/abbs/gmu001. [DOI] [PubMed] [Google Scholar]
- 26.Zang M, Zhang B, Zhang Y, Li J, Su L, Zhu Z, Gu Q, Liu B, Yan M. CEACAM6 promotes gastric cancer invasion and metastasis by inducing epithelial-mesenchymal transition via PI3K/AKT signaling pathway. PLoS One. 2014;9:e112908. doi: 10.1371/journal.pone.0112908. [DOI] [PMC free article] [PubMed] [Google Scholar]
- 27.Chen J, Li Q, An Y, Lv N, Xue X, Wei J, Jiang K, Wu J, Gao W, Qian Z, et al. CEACAM6 induces epithelial-mesenchymal transition and mediates invasion and metastasis in pancreatic cancer. Int J Oncol. 2013;43:877–885. doi: 10.3892/ijo.2013.2015. [DOI] [PubMed] [Google Scholar]
- 28.Gemei M, Mirabelli P, Di Noto R, Corbo C, Iaccarino A, Zamboli A, Troncone G, Galizia G, Lieto E, Del Vecchio L, Salvatore F. CD66c is a novel marker for colorectal cancer stem cell isolation, and its silencing halts tumor growth in vivo. Cancer. 2013;119:729–738. doi: 10.1002/cncr.27794. [DOI] [PubMed] [Google Scholar]
- 29.Lewis-Wambi JS, Cunliffe HE, Kim HR, Willis AL, Jordan VC. Overexpression of CEACAM6 promotes migration and invasion of oestrogen-deprived breast cancer cells. Eur J Cancer. 2008;44:1770–1779. doi: 10.1016/j.ejca.2008.05.016. [DOI] [PMC free article] [PubMed] [Google Scholar]
- 30.Chiang WF, Cheng TM, Chang CC, Pan SH, Changou CA, Chang TH, Lee KH, Wu SY, Chen YF, Chuang KH, et al. Carcinoembryonic antigen-related cell adhesion molecule 6 (CEACAM6) promotes EGF receptor signaling of oral squamous cell carcinoma metastasis via the complex N-glycosylation. Oncogene. 2018;37:116–127. doi: 10.1038/onc.2017.303. [DOI] [PubMed] [Google Scholar]


