Abstract
Purpose
We performed a bioinformatic transcriptome analysis to determine the alteration of gene expression between the native retina and retinal organoids in both mice and humans.
Methods
The datasets of mouse native retina (GSE101986), mouse retinal organoids (GSE102794), human native retina (GSE104827), and human retinal organoids (GSE119320) were obtained from Gene Expression Omnibus. After normalization, a principal component analysis was performed to categorize the samples. The genes were clustered to classify them. A functional analysis was performed using the bioinformatics tool Gene ontology enrichment to analyze the biological processes of selected genes and cellular components.
Results
The development of retinal organoids is slower than that in the native retina. In the early stage, cell proliferation predominates. Subsequently, neural differentiation is dominant. In the later stage, the dominant differentiated cells are photoreceptors. Additionally, the fatty acid metabolic process and mitochondria-related genes are upregulated over time, and the glycogen catabolic process and activin receptors are gradually downregulated in human retinal organoids. However, these trends are opposite in mouse retinal organoids. There are two peaks in mitochondria-related genes, one in the early development period and another during the photoreceptor development period. It takes about five times longer for human retinal development to achieve similar levels of mouse retinal development.
Conclusions
Our study reveals the similarities and differences in the developmental features of retinal organoids as well as the corresponding relationship between mouse and human retinal development.
Keywords: transcriptomics, native retina, retinal organoids, development, retinal mitochondria
The retina is an important part of the visual perception system. It has a complex structure and function. In the retina located, rod and cone cells capture light signals, which are converted into electric signals and subsequently processed and transmitted to the brain by retinal neurons. The developmental order of various retinal cells is conserved among mammals, and cells can be integrated into complex layered structures.1,2 During retinal development in mice, ganglion cells are generated first, followed by cone photoreceptors, horizontal cells, and amacrine cells. Next, bipolar cells, Müller cells, and rod photoreceptors are generated postnatally.3 However, the course of retinal development in humans remains unclear. Since human retinal samples are difficult to obtain, only a limited number of studies were published. For example, Hoshino et al.4 extracted RNA from 17 human fetal retinal samples (fetal days [D]52–136) and performed a transcriptome analysis by RNA sequencing (RNA-seq). Similarly, Aldiri et al.5 extracted RNA from human fetal retinal samples (fetal weeks 13–24) for transcriptome analysis. The discovered course of retinal development of the two studies is consistent. Although most of the data are similar, there are still some significant differences for samples (fetal week 10 and fetal week 18) at certain time points.4
With the discovery of human embryonic stem cells and induced pluripotent stem cells (PSCs), PSCs have become a new tool for tissue regeneration.6 If exposed to the right signals, PSCs have the potential to self-renew indefinitely and to differentiate into any cell type in the body. Recent research has shown, that PSCs have the ability to form three-dimensional organoids by self-organization. These organoids resemble native organ structure and function. Organoids allow in vivo and in vitro investigation and represent one of the latest innovations in the quest to model the physiologic processes of a whole organisms.7
The Sasai research team carried out a series of fundamental research to develop mouse and human retinal organoids8,9 and thereby laid a foundation for the in vitro study of retinal development and retinal disease model construction. One of the important roles in retinal organoids is to mimic the process of retinal development in vitro.10 The research on the formation of retinal organoids in vitro might give deeper insight into the development of the native retina. Various cell developmental processes in the retina are conserved in mice and humans.9,11 Therefore, retinal organoid technology permits a suitable platform to study retinal development, especially for humans.10 However, the similarities and differences in development between the native retina and retinal organoids remain elusive. In this study, we performed a bioinformatic transcriptome analysis to explore the time points of retinal development-related biological processes during the development of the native retina and retinal organoids in mice and humans. Additionally, the similarities and differences in gene expression trends between mouse and human retinal organoids were analyzed. Furthermore, the developmental time course of retinal mitochondria was examined. Finally, based on the time points of events in mouse and human retinal development, we explored the corresponding times of native retina and retinal organoid development in mice and humans. This study not only provides a theoretical basis for the research of retinal organoids, but also supplies a reference to establish in vitro models of retinal genetic diseases.
Methods
RNA-seq Data of Retinal Development and Retinal Organoids in Mice and Humans
All the RNA-seq datasets were obtained from Gene Expression Omnibus (https://www.ncbi.nlm.nih.gov/geo/). The information of the source databases is displayed in the Table. The experimental methods of these databases are listed in Supplementary Table S1. The mouse retinal development dataset GSE101986 provided by Hoshino et al.4 included 12-stage samples comprising four embryonic time points (E11, E12, E14, and E16) and eight postnatal time points (P0, P2, P4, P6, P10, P14, P21, and P28). The mouse retinal organoid development dataset GSE102794 was provided by Brooks et al.13 Mouse retinal organoids derived from miPSCs were collected for RNA-seq analysis in triplicate at 10 time points during differentiation [day (D) 0, 4, 7, 10, 12, 15, 18, 22, 25, and 32]. The human native retinal development dataset GSE104827 provided by Hoshino et al.4 contained 13 samples at different development time points (D52/54, 53, 57, 67, 80, 94 [2 samples], 105, 107, 115, 125, 132, and 136). The human retinal organoid development dataset GSE119320 was provided by Eldred et al.12 The EP1 iPSC-derived retinal organoids in duplicate or triplicate were collected at 11-time points during differentiation (D 10, 20, 35, 69, 111, 128, 158, 173, 181, 200, and 250).
Table.
The Information on the Source Databases
| GEO Accession | Species | Tissue | Time | Sample Size | Platforms | References |
|---|---|---|---|---|---|---|
| GSE101986 | Mus musculus | Native retina | E11 – P28 | 24 | Illumina HiSeq 2500 | Hoshino et al.4 |
| GSE102794 | Mus musculus | Retinal organoids | D0 – D32 | 30 | Illumina Genome Analyzer IIx | Brooks et al.13 |
| GSE104827 | Homo sapiens | Native retina | D52/54 – D136 | 13 | Illumina HiSeq 2500 | Hoshino et al.4 |
| GSE119320 | Homo sapiens | Retinal organoids | D10 – D250 | 31 | Illumina NextSeq 500 | Eldred et al.12 |
GEO, Gene Expression Omnibus.
Preliminary Data Processing
Data normalization was performed using the Sangerbox tool, a free software for data analysis (http://sangerbox.com/). The expression of all genes was standardized to a Z-score. In the mouse or human retinal development and retinal organoid development datasets, all the genes were clustered by iDEP v0.90 (http://bioinformatics.sdstate.edu/idep/).14 Principal component analysis (PCA) was also performed using iDEP v 0.90. Pearson's correlation coefficient determination was performed using SPSS (SPSS, Inc, Chicago, IL).
Functional Enrichment Analysis
The clustered genes were submitted to Metascape (http://metascape.org).15 Gene ontology (GO) terms in biological processes and cellular components were screened with a P value of less than 0.05.
Protein–Protein Interaction Network
Protein–protein interaction analysis is a tool to demonstrate protein interactions. In the present study, the reversely correlated genes in mouse and human retinal organoid development were submitted to the Search Tool for the Retrieval of Interacting Genes (STRING; http://string-db.org/) database to construct a protein–protein interaction network. Closely related genes were classified into six clusters. Each cluster was analyzed with GO enrichment.
Results
Preliminary Analysis of Datasets in Mouse Native Retina and Retinal Organoids
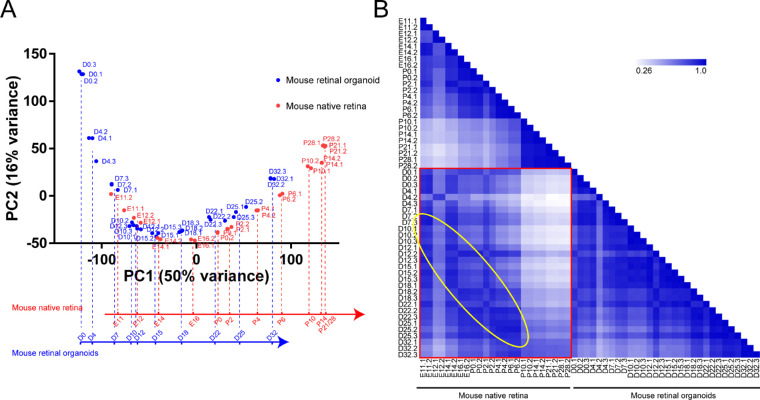
The mouse native retina dataset GSE101986 and retinal organoid dataset GSE102794 were obtained from the Gene Expression Omnibus database. After normalization, PCA and Pearson's correlation coefficient determination were performed. PCA is a statistical method that can be used to analyze the major influencing factors from multiple sources. Figure 1A shows that samples in the mouse native retina and retinal organoids show high similarity. The position of the point where the sample was located gradually moved to the upper left over time, regardless of the native retina or retinal organoids. In these two groups, samples at different time points were located at similar locations, indicating that the gene expression characteristics at these time points were similar. The PC1 axis represented the time of development. We constructed a vertical line to the PC1 axis at the center of each time point sample and obtained the development timeline of the mouse native retina and retinal organoids. The results showed that developmental timeline differences existed between the two groups. Particularly, after the 12th day of development (E12 or D12), the developmental time of the retinal organoids was slower than that of the native retina (e.g., D32 was similar to P6; Fig. 1A). Pearson's correlation coefficient determination was performed to show the correlation between the two groups of samples. The result demonstrated that, in both mouse native retina development and mouse retinal organoid development, the sample correlation decreased over time compared with that at the starting time point (Fig. 1B). Additionally, between the native retina and retinal organoids, the highest correlation coefficient between the two groups was located in the yellow circle, suggesting consistency over time in both the native retina and retinal organoids.
Figure 1.
The sample features of mouse native retina and retinal organoids. (A) PCA plot shows a comparison of the transcriptome data between mouse native retina and retinal organoids. PC1 on the x axis corresponds with the developmental time. The mapping of sample points in the x axis represents their relative position during development. (B) Pearson's correlation coefficient is performed to show the correlation between the two groups of samples. The yellow circle indicates that the two groups of samples are consistent over time.
Cluster Analysis and Retinal Cell Development Over Time in the Mouse Native Retina and Retinal Organoids
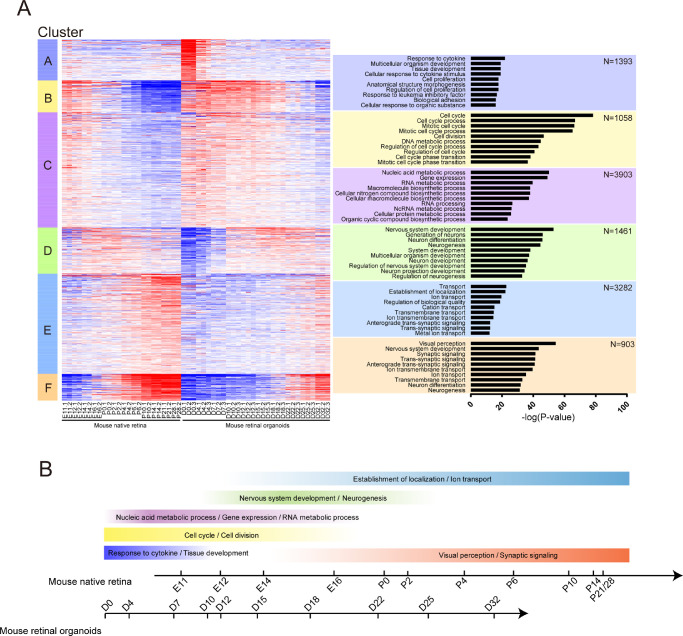
After normalization, all the genes were clustered into six clusters based on gene expression over time. Next, we performed GO enrichment of genes in each cluster and selected the top 10 GO terms with a P value. The cluster heatmap and biological process GO terms are listed in Figure 2A. According to the data of the cluster heatmap, we plotted the curves of the relative gene average expression as a function of the developmental time for each cluster (Supplementary Fig. S1). In cluster A, the response to cytokine and multicellular organism development was the most significant, and the expression of their related genes decreased with time after the start of development. In cluster B, the cell cycle and cell division were the most significant GO terms, and related genes were highly expressed in the first 10 days and then were downregulated over time. The nucleic acid metabolic process and RNA metabolic process were the most significant GO terms in cluster C. The trend of related gene expression was similar to that in cluster B. Nervous system development and neurogenesis were prominent in cluster D. The expression of related genes gradually increased after the beginning of development, reaching a peak from about day 14 to day 22 (E14 to P2 in the native retina; D15–D22 in the retinal organoid). It was then gently downregulated. In cluster E, ion transport and the establishment of localization were prominent, and the expression of related genes was upregulated over time after the beginning of development. Visual perception was the most significant in cluster F. The expression of its related genes was upregulated over time after the beginning of development and peaked around day 34. Based on these results, we revealed the time and gene expression of the significant common GO terms in the development of the native retina and retinal organoids (Fig. 2B). Therefore, the biological processes of development in the mouse native retina and retinal organoids were similar. Taken together, the mouse retinal development between the mouse native retina and retinal organoids showed a high consistency.
Figure 2.
Cluster analysis in mouse native retina and retinal organoids. (A, left) Heatmap of all genes expressed in mouse native retina and retinal organoids. Genes were clustered into six clusters based on gene expression over time. Heatmaps were generated using Z scores of expressed genes. (Right) Top significant biological processes enriched in each cluster based on GO analysis. (B) The relationship between time and the significant GO terms in mouse native retina and retinal organoids. Color depth represents the gene relative expression.
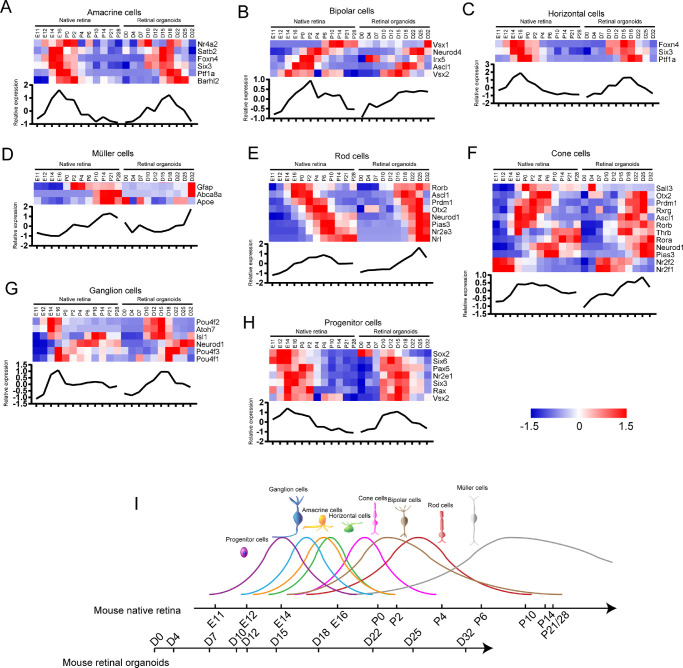
According to the expression of specific transcription factors (TFs) in each neural retinal cell type, we investigated the retinal cell birth time in the mouse native retina and retinal organoids. The TF list was referenced to a previous review.3 The gene expression in these two groups was standardized separately (Supplementary Table S2). Amacrine cell-related TFs were highly expressed from E12 to P2 or from D12 to D22 (the former is native retinal development, the latter is retinal organoid development, same as below) (Fig. 3A). Bipolar cell-related TFs were highly expressed during E16 to P14 and D15 to D32 (Fig. 3B). Horizontal cell-related TF expression increased during E12 to P2 and D10 to D22 (Fig. 3C). Müller cell-related TFs were highly expressed during P0 to P28 and D18 to D32 (Fig. 3D). In photoreceptor cells, rod cell-related TFs were highly expressed during E16 to P10 and D15 to D32 (Fig. 3E). Cone cell-related TFs were upregulated during E14 to P6 and D12 to D25 (Fig. 3F). Ganglion cell-related TFs were highly expressed during E12 to P0 and D10 to D18 (Fig. 3G). Progenitor cell-related TFs were upregulated during E11 to P2 and D7 to D18 (Fig. 3H). Based on the above results, we suggested the developmental timeline of various cells in the mouse native retina and retinal organoids (Fig. 3I). The developmental trends of various types of retinal cells were consistent between the mouse native retina and retinal organoids.
Figure 3.
The developmental time of each neural retinal cell type in mouse native retina and retinal organoids. (A–H) Heatmaps show the relative expression of specific TFs in each neural retinal cell type. The curves of average expression are displayed below each heatmap. Heatmaps were generated using Z scores of expressed genes. (I) The developmental timeline of various neural retinal cells in mouse native retina and retinal organoids. Curve height represents the relative birth rate of cells.
Preliminary Analysis of Datasets in the Human Native Retina and Retinal Organoids
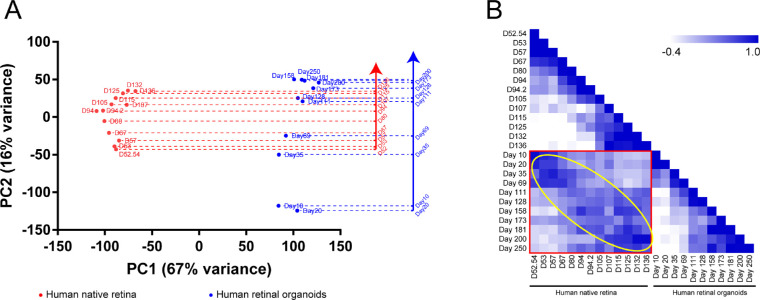
The human native retina dataset GSE104827 and retinal organoid dataset GSE119320 were obtained from the Gene Expression Omnibus database. After normalization, PCA and Pearson's correlation coefficient were performed. The PCA result revealed that, as the developmental time progressed, regardless of the native retina or retinal organoids, the position of the point where the sample was located gradually moved from the bottom to top (Fig. 4A). The PC2 axis represented the time of development. We made a vertical line to the PC2 axis at the center of each time point sample and obtained the development timeline of the human native retina and retinal organoids. The results showed developmental timeline differences between the groups. Particularly, after the 100th day of development (D107 or D111), the development time of the retinal organoids was slower than that of the native retina (e.g., D173 was similar to D136; Fig. 4A). The Pearson's correlation coefficient result was similar to that in mouse samples (Fig. 4B). Additionally, between the native retina and retinal organoids, the highest correlation coefficient between the two groups was located in the yellow circle. It also demonstrated the consistency over time in both the native retina and retinal organoids. These results revealed that the development process between the human native retina and retinal organoids was similar.
Figure 4.
The sample features of human native retina and retinal organoids. (A) PCA plot shows a comparison of the transcriptome data between human native retina and retinal organoids. PC2 on the y axis corresponds with the developmental time. The mapping of sample points in the y axis represents their relative position during development. (B) Pearson's correlation coefficient is performed to show the correlation between the two groups of samples. The yellow circle indicates that the two groups of samples are consistent over time.
Cluster Analysis and Retinal Cell Development Over Time in the Human Native Retina and Retinal Organoids
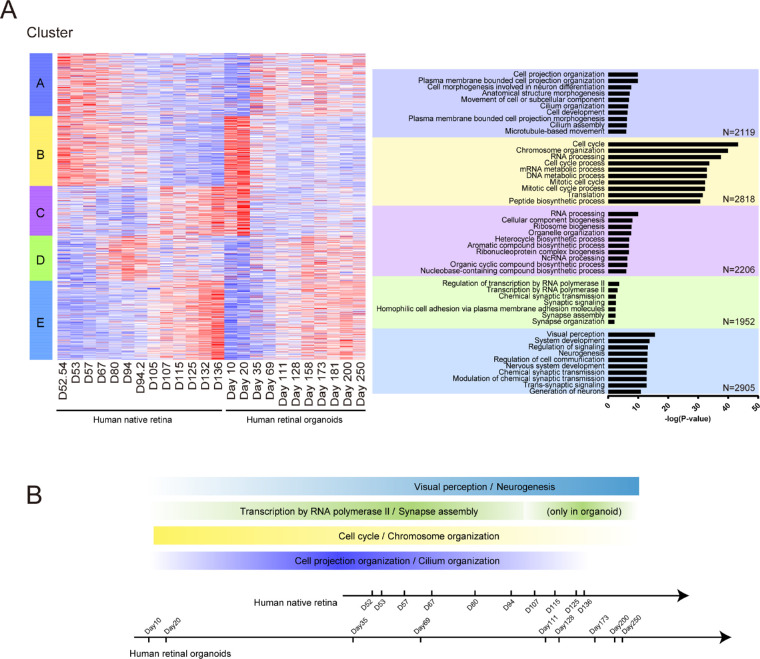
In both the human native retina and retinal organoids, the genes were chronologically classified into 5 clusters. Next, we performed GO enrichment analysis of genes in each cluster and selected the top 10 GO terms with a P value. The cluster heatmap and biological process GO terms were listed (Fig. 5A). According to the data of the cluster heatmap, we plotted the curves of gene expression as a function of the developmental time about each cluster (Supplementary Fig. S2). In cluster A, the cell projection organization and cilium organization were significant, and related genes were downregulated in the middle stages of development. However, in the early development of human retinal organoids (D20–69), these genes were upregulated. The cell cycle was the most significant GO term in cluster B. The related gene expression peaked at the beginning of development and then gradually decreased over time. In cluster C, RNA processing and ribosome biogenesis were significant. However, their related gene expression levels differed in the peak time points during the development of the human native retina and human retinal organoids. In the native retina, the genes were gradually upregulated. In retinal organoids, the peak of genes appeared in the early stage of development and was similar to that in cluster B. The genes of transcription by RNA polymerase II and chemical synaptic transmission were mainly expressed in cluster D. In the native retina, the peak of gene expression was at about day 94; however, in the retinal organoids, it appeared at D158. In cluster E, visual perception was the most significant. The related genes were gradually upregulated over time. Above all, we suggested the time and gene expression of the significant common GO terms in the development between the native retina and retinal organoids (Fig. 5B). Taken together, although some biological processes occurred differently during the development of the human native retina and retinal organoids, most of them showed a high consistency.
Figure 5.
Cluster analysis in human native retina and retinal organoids. (A, left) Heatmap of all genes expressed in human native retina and retinal organoids. Genes were clustered into five clusters based on gene expression over time. Heatmaps were generated using Z scores of expressed genes. (Right) Top significant biological processes enriched in each cluster based on GO analysis. (B) The relationship between time and the significant GO terms in human native retina and retinal organoids. Color depth represents the gene relative expression.
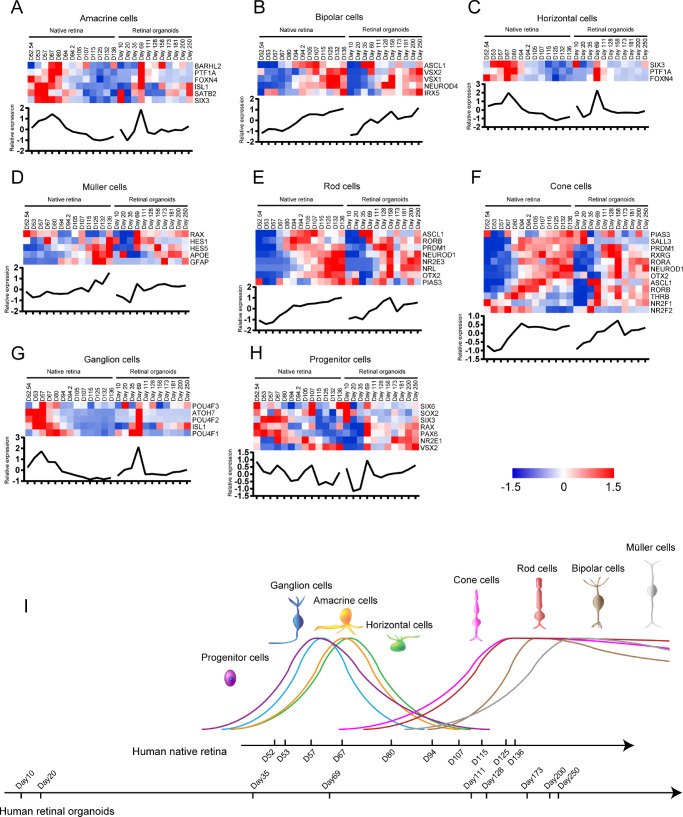
The retinal cell birth time in the human native retina and retinal organoids was investigated with the specific TF expression of each retinal cell type. The gene expression in these two groups was standardized separately (Supplementary Table S3). Amacrine cell-related TFs were highly expressed during D52/54 to D105 and D35 to D111 (the former is native retinal development, the latter is retinal organoid development, same as below) (Fig. 6A). Bipolar cell-related TFs were highly expressed during D94 to D136 and D111 to D250 (Fig. 6B). Horizontal cell-related TFs were expressed increasingly during D52/54 to D105 and D35 to D111 (Fig. 6C). Müller cell-related TFs were highly expressed during D94 to D136 and D111 to D250 (Fig. 6D). Photoreceptor cells and rod cell-related TFs were highly expressed during D80 to D136 and D111 to D250 (Fig. 6E). Cone cell-related TFs were upregulated during D67 to D136 and D69 to D250 (Fig. 6F). Ganglion cell-related TFs were highly expressed during D52/54 to D94 and D20 to D115 (Fig. 6G). Progenitor cell-related TFs were upregulated during D52/54 to D94 and D20 to D128 (Fig. 6H). Based on these results, we revealed the developmental timeline of various cells in the human native retina and retinal organoids (Fig. 6I). The developmental trends of various retinal cells were consistent between these groups.
Figure 6.
The developmental time of each neural retinal cell type in human native retina and retinal organoids. (A–H) Heatmaps show the relative expression of specific TFs in each neural retinal cell type. The curves of average expression are displayed below each heatmap. Heatmaps were generated using Z scores of expressed genes. (I) The developmental timeline of various neural retinal cells in human native retina and retinal organoids. Curve height represents the relative birth rate of cells.
Similarities and Differences Between the Mouse and Human Retinal Organoids
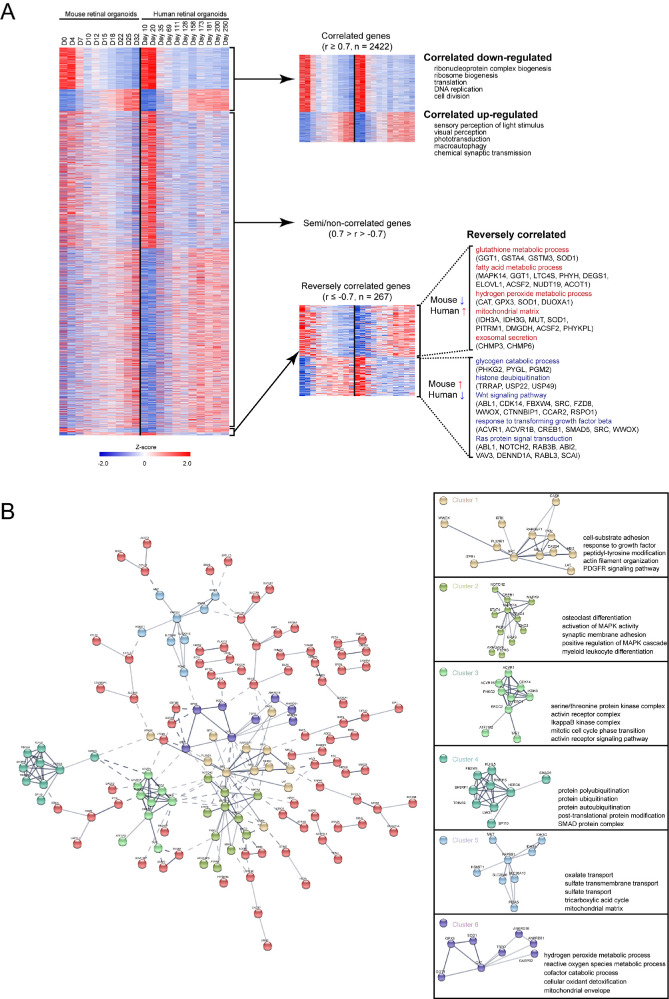
Pearson's correlation was determined to analyze the similarities and differences between the mouse and human retinal organoids. Hierarchical clustering of human retinal organoid genes with the corresponding expression in mouse retinal organoids (shown as heatmaps in Fig. 7A, data in Supplementary Table S4) provided 3 distinct patterns: correlated genes (Pearson correlation coefficient [r] ≥ 0.7; n = 2422) referred to the simultaneous upregulation or downregulation of genes during the development of mouse and human organoids; semi/noncorrelated genes (0.7 > r > –0.7) indicated genes whose expression were not so correlated during the development of mouse and human organoids; reversely correlated genes (r ≤ –0.7, n = 267) showed gene expression patterns that were opposite in developing mouse and human retinal organoids. In correlated genes, the downregulated gene-related GO terms over time concerned cell division; the upregulated gene-related GO terms concerned neurogenesis and photoreceptor development. In reversely correlated genes, the GO terms that were upregulated in humans and downregulated in mice over time were glutathione metabolic process, fatty acid metabolic process, hydrogen peroxide metabolic process, mitochondrial matrix, and exosomal secretion; the GO terms that were downregulated in humans and upregulated in mice were glycogen catabolic process, histone deubiquitination, Wnt signaling pathway, response to transforming growth factor beta, and Ras protein signal transduction.
Figure 7.
Comparison between mouse and human retinal organoid. (A) Pearson correlation of mouse and human retinal organoid. There were 2422 genes that were highly correlated between mouse and human retinal organoid (Pearson correlation coefficient, r ≥ 0.7). There were 267 genes that were reversely correlated (r ≤ –0.7). Enriched GO terms for the correlated and reversely correlated genes are presented. Heatmaps were generated using Z scores of expressed genes. (B) Protein–protein interaction (PPI) networks were performed to illustrate the interaction in reversely correlated genes. Genes that were closely related to each other were divided into six clusters. Enriched GO terms for the clustered genes are presented.
The protein–protein interaction networks were performed to illustrate the interaction in reversely correlated genes. Genes that were closely related to each other were divided into six clusters (Fig. 7B). Cluster 1 was centered on SRC, and the main GO terms were cell-substrate adhesion and actin filament organization. MAPK14 was the hub gene of cluster 2, which contained osteoclast differentiation and synaptic membrane adhesion. Cluster 3 was centered on ERCC2, and the main GO terms in this cluster were the activin receptor complex and mitotic cell cycle phase transition. The hub gene of cluster 4 was HERC6, and the most important GO term was protein ubiquitination. PAPSS1 was the hub gene of cluster 5, which contained sulfate transport and the mitochondrial matrix. Cluster 6 was centered on CAT, and the main GO terms were hydrogen peroxide metabolic process and mitochondrial envelope.
Based on these results, we found that the main difference between the mouse and human retinal organoids was energy metabolism. Specifically, some types of enzymes related to the tricarboxylic acid cycle in the mitochondria of human retinal organoids were gradually upregulated over time, but were completely opposite in the mouse.
Development of Retinal Mitochondria in the Native Retina and Retinal Organoids
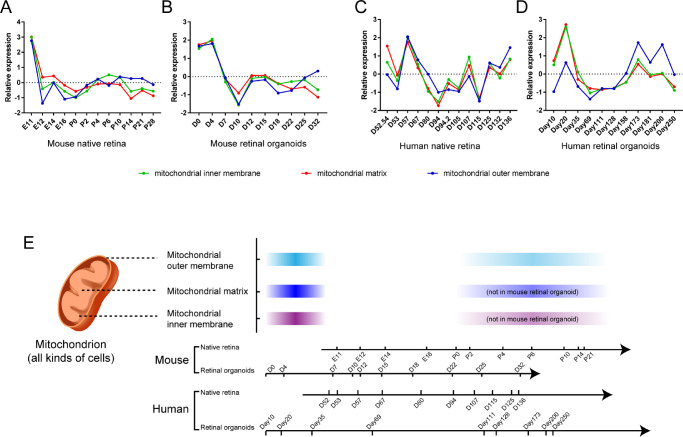
There were also some differences in the development of mitochondrial components in the retina (data in Supplementary Table S5). In the mouse retinal native tissue or organoids, there was a peak of mitochondrial components significantly upregulated in the early stages of retinal development. In the middle and late stages of retinal native tissue (P0–P14), the mitochondrial components showed a second peak of expression (Fig. 8A). However, in mouse organoids (Fig. 8B), only the mitochondrial outer membrane revealed a similar second peak (D18–D32). In humans, the mitochondrial components also had two peaks of expression. The first occurred on D10 to D35 (Fig. 8C). The second appeared in the mid to late stages of development (after D115 and D111 to D250) (Fig. 8C, D). Above all, we revealed the timeline of the retinal mitochondria in mouse and human retinal development (Fig. 8E). From these similarities in developmental time, the approximate correspondent developmental timeline between the mouse and human retina was plotted. It took about five times longer for human retinal development to achieve similar levels of mouse retinal development. Additionally, the retinal mitochondrial development time showed a high correlation with the photoreceptor development time, suggesting that mitochondria play an important role in photoreceptor development.
Figure 8.
Retinal mitochondria related gene expression in native retina and retinal organoids. The relative expression curves of mitochondria-related genes in mouse native retina (A), mouse retinal organoids (B), human native retina, (C) and human retinal organoids (D) over time were shown. (E) The developmental timeline of retinal mitochondria in mouse and human. Color depth represents the gene relative average expression.
Discussion
In the current study, we performed a transcriptomic analysis of the developmental similarities and differences between the native retina and retinal organoids in mice and humans. Compared with human retinal organoids, mouse retinal organoids have a smaller size, thinner retinal nerve layers, and a lesser proportion of cone cells.8 However, a great advantage of mouse retinal organoids is the shorter culture time. A relatively mature structure is formed in approximately 24 days,9 which is very convenient for in vitro studies. Here, we found that the retinal organoids develop slower than the native retina. The reason may be due to the diffusion-limited delivery of exogenous factors (e.g., nutrients and oxygen) in the static suspension organoid culture medium, resulting in the loss of local nutrients. The efficient delivery of oxygen and nutrients remains a challenge in three-dimensional culture, because nutrient supply limits cell aggregation, size, and proper organoid differentiation.16,17 The increased requirement of oxygen during cell proliferation during organoid growth can lead to hypoxic stress and results in cell cycle arrest.18 A dynamic culture method for retinal organoids by a rotating wall vessel improves growth and differentiation of retinal organoids, suggesting more efficient delivery of oxygen and nutrients to the centers of organoids.19
Additionally, cluster analysis for the time frame between human retinal organoids and fetal retina showed that both consistently decrease over time in cluster B, a finding that is related to the cell cycle and proliferation of retinal progenitor cells. However, the genes of transcription by RNA processing and ribosome biogenesis in cluster C, as well as those of RNA polymerase II and chemical synaptic transmission in cluster D, display that the peak time points of genes in human retinal organoids are significantly slower or different than those in human fetal retinas. Welby et al.20 also reported similar gene expression profiles between late fetal and iPSC organoid-derived cone cells. However, not all late enriched cone genes show equivalent levels of expression within the iPSC-derived cells, suggesting an intermediate stage of cone cell differentiation and a relative delay in their maturation. We suppose that transcriptomic differences between human retinal organoids and fetal retinas may be due to the simplified conditions of in vitro culturing, by missing, for example, vascularization and an immune system. Lancaster and Knoblich7 reported that the lack of vascularization is generally an issue of in vitro organoids. Organoids exhibit a limited growth potential due to limitations in nutrient supply, which can also affect their maturation.7,21
Self-formation of stratified retinal organoids from human or mouse PSCs underlie the same differentiational cues that are responsible for retinal embryonic development.8,22 Similarly, in the Pearson correlation analysis, we identified 2422 correlated genes over time between mouse and human retinal organoid development. Interestingly, we also identified 267 reversely correlated genes between mouse and human retinal organoids. The GO terms of upregulated genes in humans and downregulated genes in the mouse include glutathione metabolic process, fatty acid metabolic process, hydrogen peroxide metabolic process, and mitochondrial matrix. We speculate that such opposite gene expression patterns are related to different morphology among retinal organoids and different photoreceptor constitution between mice and humans. First, human retinal organoids are larger than those of mice. For better growth of human retinal organoids, the dissection protocol is usually used to decrease the size of the organoids and to increase the access for nutrients and oxygen.23 Thus, dissected human retinal organoids present higher metabolic processes than intact mouse retinal organoids.12,24 Second, photoreceptors in mice and humans constitute more than 70% of retinal cells, but rods outnumber cones by 30:1 in mice and 18:1 to 20:1 in humans. A significantly greater proportion of cones was reported in human organoids.1,25 It was widely thought that, in photoreceptors, cones contain more mitochondria than rods. The volume of mitochondria in an individual cone could be as much as 26.4 times the volume of mitochondria in a rod. Additionally, retinal mitochondria have diverse functions, including metabolic function. Cone inner segments have intense cytochrome oxidase staining and have a relatively high oxygen consumption. Light-adapted cones have a greater aerobic energy demand and consequent adenosine triphosphatase production than light-adapted rods. The greater adenosine triphosphatase production by cones may increase the protection against metabolic insults and apoptosis, if compared with rods.26 Therefore, dissected human retinal organoids with more cone photoreceptors are associated with upregulated gene expression patterns gradually in metabolic processes and mitochondrial function, whereas intact mouse retinal organoids with fewer cone photoreceptors display downregulated gene expression patterns over time in mitochondrial and metabolic activities.
To validate this hypothesis, we reanalyzed the dataset GSE102727, which shows the development of mouse retinal organoids under different conditions.19 The mitochondria-related genes were selected and plotted as heatmaps (Supplementary Fig. S3). The result showed that the expression of the mitochondrial matrix and inner membrane-related genes in the rotating wall vessel bioreactor and dissected organoid static suspension culture was higher than that in intact organoid static suspension culture. Additionally, no significant differences were found in the expression of mitochondrial outer membrane-related genes. Ovando-Roche et al.27 also found that the use of bioreactors increased the number of photoreceptors in retinal organoids. Ronin is a key transcriptional regulator of proliferation in retinal progenitor cells. The knockout mouse model of Ronin caused downregulation of electron transport chain-related gene expression localized at the mitochondrial inner membrane. It caused electron transport chain defects as well as premature cell cycle arrest, excessive neurogenesis and cell death, glial cell growth, and retinal morphological disorders.28 Nrf1 is a major transcriptional regulator of mitochondrial biogenesis in proliferative retinal progenitor cell and postmitotic photoreceptor cells. In the knockout mouse model of Nrf1, the mitochondrial morphology was abnormal and mitochondrial function was impaired, causing severe photoreceptor degeneration and delayed retinal ganglion cell differentiation.29 Mitochondrial dysfunction and retinal photoreceptor lesions have an important relationship,30 suggesting that mitochondria are important for retinal development.
In this study, we use bulk RNA-seq datasets to analyze native retinal and retinal organoid development. However, there are some limitations to bulk RNA-seq analysis. It does not distinguish the global difference in transcriptomes caused either by varying expression levels in individual cells or by varying cell composition in tissues. In contrast, single cell RNA-seq analyze the transcriptomes in each cell type and eliminate the noise caused by varied cell composition, making it more precise.31 Single cell RNA-seq can allow detailed molecular characterization of specific cell types and single-cell ensemble recapitulates the heterogeneity present in the bulk RNA-seq datasets.32 A recent study showed that this method had great potential for identifying multiple cell types arising within complex organoids.33 The transcriptome-wide correlation between bulk RNA-seq and average single cell RNA-seq data will help us to better understand the native retina and retinal organoid development. For example, Hu et al.34 compared their single-cell RNA-seq data with the bulk transcriptomic studies of Hoshino et al.4 and revealed more details on transcriptome dynamics of fetal human retina. The differentially expressed genes between retinas at early and late time points found by bulk RNA-seq analysis could be mapped on specific cell classes in their single-cell data. Thus, the combination of bulk RNA-seq and single cell RNA-seq datasets let us establish an integrated understanding of transcriptomes in studying human retinal development.31
In summary, our study revealed the characteristics in the developmental features of retinal organoids, as well as the corresponding relationship between mouse and human retinal development by transcriptomic analysis. Although retinal organoids have great potential, many problems persist. The long-time development of human retinal organoids,21 structural difference between retinal organoids and native retina,31 lack of interactions with other tissues,35 and other shortcomings remain to be resolved. These shortcomings can be improved with new technologies, such as bioreactors,19,27 coculture,35,36 and organ-on-a-chip.37 With the further improvements of organoid culture systems and gene editing technologies, organoids will play an increasingly important role in functional studies of gene mutations and the treatment of genetic diseases.7
Supplementary Material
Acknowledgments
The authors thank Fabian Gademann of Key Laboratory for Regenerative Medicine, Ministry of Education, Jinan University for help in the revision of the manuscript.
Supported by the Special Funds for Major Science and Technology Projects of Guangdong Province (2015B010125007), National Natural Science Foundation of China (81871495), the Science Research Grant of Aier Eye Hospital Group, China (AF1913D2, AF1601D1), Central South University Postdoctoral Funds. The first author is a postdoctoral fellow at the Second Xiangya Hospital, Central South University.
Disclosure: Z. Cui, None; Y. Guo, None; Y. Zhou, None; S. Mao, None; X. Yan, None; Y. Zeng, None; C. Ding, None; H. Chan, None; S. Tang, None; L. Tang, None; J. Chen, None
References
- 1. Swaroop A, Kim D, Forrest D. Transcriptional regulation of photoreceptor development and homeostasis in the mammalian retina. Nat Rev Neurosci. 2010; 11: 563–576. [DOI] [PMC free article] [PubMed] [Google Scholar]
- 2. Hoon M, Okawa H, Della Santina L, Wong RO. Functional architecture of the retina: development and disease. Prog Retin Eye Res. 2014; 42: 44–84. [DOI] [PMC free article] [PubMed] [Google Scholar]
- 3. Bassett EA, Wallace VA. Cell fate determination in the vertebrate retina. Trends Neurosci. 2012; 35: 565–573. [DOI] [PubMed] [Google Scholar]
- 4. Hoshino A, Ratnapriya R, Brooks MJ, et al.. Molecular anatomy of the developing human retina. Dev Cell. 2017; 43: 763–779. e764. [DOI] [PMC free article] [PubMed] [Google Scholar]
- 5. Aldiri I, Xu B, Wang L, et al.. The dynamic epigenetic landscape of the retina during development, reprogramming, and tumorigenesis. Neuron. 2017; 94: 550–568. e510. [DOI] [PMC free article] [PubMed] [Google Scholar]
- 6. Thomson JA, Itskovitz-Eldor J, Shapiro SS, et al.. Embryonic stem cell lines derived from human blastocysts. Science. 1998; 282: 1145–1147. [DOI] [PubMed] [Google Scholar]
- 7. Li M, Izpisua Belmonte JC. Organoids - Preclinical Models of Human Disease. N Engl J Med. 2019; 380: 569–579. [DOI] [PubMed] [Google Scholar]
- 8. Nakano T, Ando S, Takata N, et al.. Self-formation of optic cups and storable stratified neural retina from human ESCs. Cell Stem Cell. 2012; 10: 771–785. [DOI] [PubMed] [Google Scholar]
- 9. Eiraku M, Takata N, Ishibashi H, et al.. Self-organizing optic-cup morphogenesis in three-dimensional culture. Nature. 2011; 472: 51. [DOI] [PubMed] [Google Scholar]
- 10. Llonch S, Carido M, Ader M. Organoid technology for retinal repair. Dev Biol. 2018; 433: 132. [DOI] [PubMed] [Google Scholar]
- 11. Kaewkhaw R, Swaroop M, Homma K, et al.. Treatment paradigms for retinal and macular diseases using 3-D retina cultures derived from human reporter pluripotent stem cell lines. Invest Ophthalmol Vis Sci. 2016; 57: ORSFl1–ORSFl11. [DOI] [PMC free article] [PubMed] [Google Scholar]
- 12. Eldred KC, Hadyniak SE, Hussey KA, et al.. Thyroid hormone signaling specifies cone subtypes in human retinal organoids. Science. 2018; 362: eaau6348. [DOI] [PMC free article] [PubMed] [Google Scholar]
- 13. Brooks MJ, Chen HY, Kelley RA, et al.. Improved Retinal Organoid Differentiation by Modulating Signaling Pathways Revealed by Comparative Transcriptome Analyses with Development In Vivo. Stem Cell Rep. 2019; 13: 891–905. [DOI] [PMC free article] [PubMed] [Google Scholar]
- 14. Ge SX, Son EW, Yao R. iDEP: an integrated web application for differential expression and pathway analysis of RNA-Seq data. BMC Bioinform. 2018; 19: 534. [DOI] [PMC free article] [PubMed] [Google Scholar]
- 15. Tripathi S, Pohl MO, Zhou Y, et al.. Meta-and orthogonal integration of influenza “OMICs” data defines a role for UBR4 in virus budding. Cell Host Microbe. 2015; 18: 723–735. [DOI] [PMC free article] [PubMed] [Google Scholar]
- 16. Miranda CC, Fernandes TG, Pascoal JF, et al.. Spatial and temporal control of cell aggregation efficiently directs human pluripotent stem cells towards neural commitment. Biotechnol J. 2015; 10: 1612–1624. [DOI] [PubMed] [Google Scholar]
- 17. Yin X, Mead BE, Safaee H, Langer R, Karp JM, Levy O. Engineering stem cell organoids. Cell Stem Cell. 2016; 18: 25–38. [DOI] [PMC free article] [PubMed] [Google Scholar]
- 18. Hubbi ME, Semenza GL. Regulation of cell proliferation by hypoxia-inducible factors. Am J Physiol Cell Physiol. 2015; 309: C775–C782. [DOI] [PMC free article] [PubMed] [Google Scholar]
- 19. DiStefano T, Chen HY, Panebianco C, et al.. Accelerated and improved differentiation of retinal organoids from pluripotent stem cells in rotating-wall vessel bioreactors. Stem Cell Rep. 2018; 10: 300–313. [DOI] [PMC free article] [PubMed] [Google Scholar]
- 20. Welby E, Lakowski J, Di Foggia V, et al.. Isolation and Comparative Transcriptome Analysis of Human Fetal and iPSC-Derived Cone Photoreceptor Cells. Stem Cell Rep. 2017; 9: 1898–1915. [DOI] [PMC free article] [PubMed] [Google Scholar]
- 21. Lancaster MA, Knoblich JA.. Organogenesis in a dish: modeling development and disease using organoid technologies. Science (New York, NY). 2014; 345: 1247125. [DOI] [PubMed] [Google Scholar]
- 22. Achberger K, Haderspeck JC, Kleger A, Liebau S. Stem cell-based retina models. Adv Drug Delivery Rev. 2019; 140: 33–50. [DOI] [PubMed] [Google Scholar]
- 23. Völkner M, Zschätzsch M, Rostovskaya M, et al.. Retinal organoids from pluripotent stem cells efficiently recapitulate retinogenesis. Stem Cell Rep. 2016; 6: 525–538. [DOI] [PMC free article] [PubMed] [Google Scholar]
- 24. Chen HY, Kaya KD, Dong L, Swaroop A. Three-dimensional retinal organoids from mouse pluripotent stem cells mimic in vivo development with enhanced stratification and rod photoreceptor differentiation. Mol Vision. 2016; 22: 1077. [PMC free article] [PubMed] [Google Scholar]
- 25. Kaewkhaw R, Kaya KD, Brooks M, et al.. Transcriptome dynamics of developing photoreceptors in three‐dimensional retina cultures recapitulates temporal sequence of human cone and rod differentiation revealing cell surface markers and gene networks. Stem Cells. 2015; 33: 3504–3518. [DOI] [PMC free article] [PubMed] [Google Scholar]
- 26. Hoang QV, Linsenmeier RA, Chung CK, Curcio CA. Photoreceptor inner segments in monkey and human retina: mitochondrial density, optics, and regional variation. Visual Neurosci. 19: 395–407. [DOI] [PubMed] [Google Scholar]
- 27. Ovando-Roche P, West EL, Branch MJ, et al.. Use of bioreactors for culturing human retinal organoids improves photoreceptor yields. Stem Cell Res Ther. 2018; 9: 156. [DOI] [PMC free article] [PubMed] [Google Scholar]
- 28. Poché RA, Zhang M, Rueda EM, et al.. RONIN is an essential transcriptional regulator of genes required for mitochondrial function in the developing retina. Cell Rep. 2016; 14: 1684–1697. [DOI] [PMC free article] [PubMed] [Google Scholar]
- 29. Kiyama T, Chen C-K, Wang SW, et al.. Essential roles of mitochondrial biogenesis regulator Nrf1 in retinal development and homeostasis. Mol Neurodegen. 2018; 13: 56. [DOI] [PMC free article] [PubMed] [Google Scholar]
- 30. Lefevere E, Toft-Kehler AK, Vohra R, Kolko M, Moons L, Van Hove I. Mitochondrial dysfunction underlying outer retinal diseases. Mitochondrion. 2017; 36: 66–76. [DOI] [PubMed] [Google Scholar]
- 31. Kim S, Lowe A, Dharmat R, et al.. Generation, transcriptome profiling, and functional validation of cone-rich human retinal organoids. Proc Nat Acad Sci USA. 2019; 116: 10824–10833. [DOI] [PMC free article] [PubMed] [Google Scholar]
- 32. Phillips MJ, Jiang P, Howden S, et al.. A Novel Approach to Single Cell RNA-Sequence Analysis Facilitates In Silico Gene Reporting of Human Pluripotent Stem Cell-Derived Retinal Cell Types. Stem Cells (Dayton, Ohio). 2018; 36: 313–324. [DOI] [PMC free article] [PubMed] [Google Scholar]
- 33. Collin J, Queen R, Zerti D, et al.. Deconstructing Retinal Organoids: single Cell RNA-Seq Reveals the Cellular Components of Human Pluripotent Stem Cell-Derived Retina. Stem Cells. 2019; 37: 593–598. [DOI] [PMC free article] [PubMed] [Google Scholar]
- 34. Hu Y, Wang X, Hu B, et al.. Dissecting the transcriptome landscape of the human fetal neural retina and retinal pigment epithelium by single-cell RNA-seq analysis. PLoS Biol. 2019; 17: e3000365. [DOI] [PMC free article] [PubMed] [Google Scholar]
- 35. Rossi G, Manfrin A, Lutolf MP. Progress and potential in organoid research. Nat Rev Genet. 2018; 19: 671–687. [DOI] [PubMed] [Google Scholar]
- 36. Akhtar T, Xie H, Khan MI, et al.. Accelerated photoreceptor differentiation of hiPSC-derived retinal organoids by contact co-culture with retinal pigment epithelium. Stem Cell Res. 2019; 39: 101491. [DOI] [PubMed] [Google Scholar]
- 37. Achberger K, Probst C, Haderspeck J, et al.. Merging organoid and organ-on-a-chip technology to generate complex multi-layer tissue models in a human Retina-on-a-Chip platform. eLife. 2019; 8: e46188. [DOI] [PMC free article] [PubMed] [Google Scholar]
Associated Data
This section collects any data citations, data availability statements, or supplementary materials included in this article.


