

Abstract
Purpose
Studying the full shape crystalline lens geometry is important to understand the changes undergone by the crystalline lens leading to presbyopia, cataract, or failure of emmetropization, and to aid in the design and selection of intraocular lenses and new strategies for correction. We used custom-developed three-dimensional (3-D) quantitative optical coherence tomography (OCT) to study age-related changes in the full shape of the isolated human crystalline lens.
Methods
A total of 103 ex vivo human isolated lenses from 87 subjects (age range, 0–56 years) were imaged using a 3-D spectral-domain OCT system. Lens models, constructed after segmentation of the surfaces and distortion correction, were used to automatically quantify central geometric parameters (lens thickness, radii of curvatures, and asphericities of anterior and posterior surfaces) and full shape parameters (lens volume, surface area, diameter, and equatorial plane position). Age-dependencies of these parameters were studied.
Results
Most of the measured parameters showed a biphasic behavior, statistically significantly increasing (radii of curvature, lens volume, surface area, diameter) or decreasing (asphericities, lens thickness) very fast in the first two decades of life, followed by a slow but significant increase after age 20 years (for all the parameters except for the posterior surface asphericity and the equatorial plane position, that remained constant).
Conclusions
Three-dimensional quantitative OCT allowed us to study the age-dependency of geometric parameters of the full isolated human crystalline lens. We found that most of the lens geometric parameters showed a biphasic behavior, changing rapidly before age 20 years and with a slower linear growth thereafter.
Keywords: lens shape, OCT, age
Understanding the geometric changes of the full shape of the human crystalline lens with age is essential in the management of visual conditions associated with the aging process (e.g., cataract or presbyopia). In particular, improvement of the optical and biomechanical models of the crystalline lens has a direct benefit on the design of intraocular lenses (IOLs),1 and helps to customize these corrections. For example, knowledge of the full geometry of the crystalline lens has proved effective in improving the estimation of the intraocular lens position (and thus the power selection and refraction correction accuracy) in cataract surgery.2 Undoubtedly, knowledge of the full crystalline lens volume and equatorial plane diameter is essential for prospective surgical techniques for presbyopia, including the Phaco-Ersatz,3 lens refilling methods,4,5 or sizing accommodative IOLs. Additionally, studying the changes undergone by the crystalline lens during infancy and childhood will give insights on its role in emmetropization, as well as its potential implications in the development of refractive errors.6
Although numerous studies report crystalline lens geometry in vivo using Purkinje imaging,7,8 Scheimpflug imaging,9–14 ultrasound biomicroscopy,15 magnetic resonance imaging (MRI),16–19 and optical coherence tomography (OCT),2,20–25 or ex vivo using Shadowphotography,26–30 OCT,31–33 MRI,34 or corneal topography systems,35,36 these generally address only lens thickness (LT), and anterior and posterior lens radii of curvature, and asphericities. Ex vivo, only a few studies report the full crystalline lens shape parameters29,30,34,37 (lens equatorial diameter [DIA],29,30,34,37 volume [VOL],29,30 equatorial plane position [EPP],29,30 and lens surface area [LSA]29) from cross-sectional images. In most cases, reports include primarily data from adult eyes, and only a few include infant or adolescent eyes in the sample.30,37
Three-dimensional (3-D) OCT corrected from fan and optical distortions38,39 is an excellent technique to image the crystalline lens in vivo and ex vivo, owing to its high axial and lateral resolution and high speed.40–45 In this study, we measured and quantified, to our knowledge for the first time, the shape of the entire ex vivo isolated lens using 3-D imaging in a large population (n = 103), including a very young age group (0–56 years).
Material and Methods
Imaging System
The system used to capture images of the crystalline lenses has been described in detail elsewhere.46 The system includes a commercial SD-OCT system (ENVISU R4400; Bioptigen, Inc., Durham, NC, USA) equipped with a superluminescent diode operating at a center wavelength of 880 nm. The axial range is 15.18 mm in air, with a pixel size of 7.4 µm/pixel. The optical axial resolution of the system is 8.5 µm in air. The effective acquisition speed is 32,000 A-scan/s, and each 3-D volume was composed of 600 A-scans and 100 B-scans on a 15 mm x 15 mm lateral area.
Experimental Protocols in Isolated Human Lenses
This research followed the tenets of the Declaration of Helsinki, and was approved by the institutional review boards of Consejo Superior de Investigaciones Científicas, BST, and LV Prasad Eye Institute.
A total of 117 lenses from 97 human donors (age range, 0–56 years, age mean ± standard deviation, 26 ± 14 years) obtained from the Ramayamma International Eye Bank at LV Prasad Eye Institute (Hyderabad, India) were imaged with the OCT system. The system was designed in Bascom Palmer Eye Institute (Miami, FL, USA) and it was shipped to India to take the measurements.
The tissue preparation was based on a protocol described elsewhere.27,34,47 Essentially, a surgeon isolated the lens from the donor globe and immediately placed it on a custom made lens holder (containing interrupted 10-0 nylon sutures to support the crystalline lens) within a cuvette filled with balanced salt solution (BSS; Alcon Laboratories, Inc., Fort Worth, TX, USA). The Supplementary Figure shows a picture and technical details of the lens holder. Damaged lenses (e.g., lenses with capsular separation) or lenses with cataract were discarded from the study (not measured). From the 117 measured lenses, 14 lenses were excluded from the analysis due to either visible deformations caused by lens damage during preparation or low image quality, which prevented quantification of the lens shape. The remaining 103 lenses from 87 subjects were analyzed. To evaluate repeatability, we also measured five repetitions for five lenses. Each repetition consisted on moving the OCT stage in x and y directions, again recenter the lens, and acquire the image.
The lenses were first imaged with the anterior surface facing the OCT beam (“anterior-up” measurements), and then flipped over and imaged again with the posterior surface facing the OCT (“posterior-up” measurements). This protocol enabled the acquisition of both the anterior and posterior lens surface shape without being affected by distortions because of the lens gradient refractive index.
OCT Image Processing for 3-D Eye Models Construction
The main steps for obtaining accurate 3-D models from OCT raw images were: segmentation of the images, fan and optical distortion correction, tilt removal, and registration.
In the segmentation process, the contour of the full lens was automatically detected. The 3-D images of the crystalline lenses were processed partially under three different orientations, shown in Figure 1A: central part, peripheral part, and first/last B-scans. In every orientation, edges were first detected using algorithms previously described.20,24 Then Zernike fitting was applied to the resulting 3-D data to smooth the surfaces and guide a refined segmentation iteratively. Figure 1B shows the final full shape 3-D model from the partial models of central (blue), peripheral (red), and first/last B-scans (green).
Figure 1.

Lens full shape model construction. (A) Different orientations in the lens used to perform the segmentation: central part, with the z-reference axis (in black) coincident with the local z-axis of the lens (white); peripheral part, with the z-reference axis coincident with the x-axis of the lens; and first/last B-scans, with the z-reference axis coincident with the y-axis of the lens. (B) Full shape 3-D model from the partial central, lateral, and first/last B-scans models. (C) Example of lens reconstructed after the whole process. Anterior part in black and posterior part in blue.
Each full lens 3-D model of the anterior-up and posterior-up measurements was divided into two parts (by the equator of the lens). Anterior part from anterior-up measurements and posterior part from posterior-up measurements (not affected by the presence of the lens gradient index) were corrected for fan distortion39 (arising from the scanning architecture of the system) and optical distortion (owing to imaging the lens through the preservation media) using n = 1.345 as the group refractive index of the BSS (at 880 nm).48
The tilt was removed by rotating each half by the angle calculated between the plane in the equatorial area and the x-y reference axis. Horizontal x-y registration was performed correcting the displacements between the center of the equatorial area of anterior and posterior parts.21 Then to account for possible rotations when flipping the lens over, rotational registration was performed by finding the angle around the z-axis that maximized the overlap between anterior and posterior parts. Finally, axial registration (in z-axis) was performed so that the separation between the apices of the anterior and posterior parts was equal to the thickness of the lens (obtained independently using the deformation introduced in the OCT image of the cuvette).33 Figure 1C shows an example of the final reconstructed lens after the whole process.
Quantification
The following parameters were quantified automatically from the 3-D constructed models: LT, using the Uhlhorn et al.33 method; radius of curvature of the best fitting sphere of anterior (RAL) and posterior (RPL) lens surfaces, calculated in a 6-mm diameter optical zone; radius of curvature and asphericities of the best fitting conicoid49 of anterior (RALQ and QAL) and posterior (RPLQ and QPL) lens surfaces (6 mm of diameter); DIA; VOL, estimated by numerically solving the double integration of the anterior and posterior lens surfaces20; LSA, estimated from the Delaunay triangulation of the 3-D anterior and posterior lens contours20; lens EPP, defined as the distance from the anterior lens apex to the equatorial plane21; LSA/VOL ratio, which for a given volume reaches its minimum when the crystalline lens shape approaches a sphere; EPP/LT ratio, which gives the EPP in relation to the LT; and LT/DIA, which gives an idea of the aspect ratio of the lens. Note that RPL was considered in absolute value in this work. Table 1 shows the abbreviation for the different parameters that will be used throughout the article.
Table 1.
Abbreviations for the Geometric Parameters Quantified
| Abbreviation | Parameter |
|---|---|
| RAL (mm) | Radius of curvature of the best fitting sphere of anterior lens surface |
| RPL (mm) | Radius of curvature of the best fitting sphere of posterior lens surface |
| RALQ (mm) | Radius of curvature of the best fitting conicoid of anterior lens surface |
| QAL | Asphericity of the best fitting conicoid of anterior lens surface |
| RPLQ (mm) | Radius of curvature of the best fitting conicoid of posterior lens surface |
| QPL | Asphericity of the best fitting conicoid of posterior lens surface |
| LT (mm) | Lens thickness |
| DIA (mm) | Lens equatorial diameter |
| VOL (mm3) | Lens volume |
| LSA (mm2) | Lens surface area |
| EPP (mm) | Equatorial plane position |
Protocol to Minimize Water Uptake
A series of steps were followed to minimize the possibility of water uptake (and thus swelling), according to suggested protocols by Augusteyn et al.50: (1) All the lenses were checked for capsular separation and lens opacity using the OCT images, and were discarded if these were found in any of the measurements (anterior- and posterior-up measurements). Analysis was performed only on intact lenses.50 (2) Once the lens was immersed in the preservation media, LT was measured and compared in different time points (anterior- and posterior-up measurements, separated approximately 90–120 minutes from each other). According to Augusteyn et al.,50 if water uptake exists the measurement made at the later time point would show a higher LT and lower DIA. (3) After quantification, crystalline lenses with aspect ratio DIA/LT considerably below the recommended limit value of 2 (i.e., with LT/DIA >> 0.5) were discarded for ages older than 20 years.
Data Analyses
When the left and right eyes were measured from the same subject, we randomly selected one eye before the analysis, resulting in 87 experimental data. Linear regression analysis was performed to study the changes in geometric parameters with age (in two different range of ages: below and above 20 years), and the coefficient of determination R2 and the P value for testing the hypothesis of no correlation were obtained. Age 20 years was selected as cutoff because prior studies showed a rapid growth phase during childhood, with the lens remodeling to reach its elliptical shape at approximately age 20 years, and a much smaller rate of changes after approximately 20 years.51
Curvilinear fitting between geometric parameters and age was also performed. The standard error of the regression (RMSE) was calculated to test the goodness of fit. To avoid overfitting, we chose models with a low number of parameters (three or less, except for LT, EPP, LSA/VOL, and LT/DIA) and that had appropriate residual properties (Gaussian distribution and no autocorrelation). Correlation between left and right eyes (estimated using the 16 paired eyes in the dataset) were calculated for every geometric parameter.
To evaluate repeatability, we calculated the standard deviation across the five measurements performed in each lens with repeated measurements.
For all analyses, statistical significance was defined as a P value < 0.05.
Calculations were performed using custom MATLAB routines (MathWorks, Natick, MA, USA).
Results
Graphic Illustration of the Changes
Figure 2 shows the 3-D models obtained for four lenses of different ages.
Figure 2.
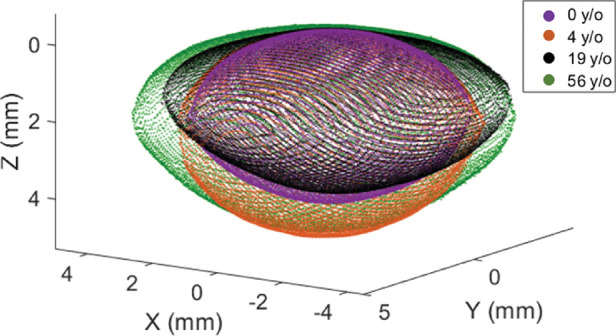
Lens full shape models for four different ages.
A video showing the changes of the lens geometry with age is shown in the Supplementary Video.
Correlation Between Left and Right Eyes
Correlation between left and right eyes from the 16 paired eyes in the dataset were significant for all the parameters, as shown in Table 2.
Table 2.
R2 and P Values of the Correlations Between Left and Right Eyes for Each Parameter (column)
| RAL | RPL | RALQ | QAL | RPLQ | QPL | LT | DIA | VOL | LSA | EPP | LSA/VOL | EPP/LT | LT/DIA | |
|---|---|---|---|---|---|---|---|---|---|---|---|---|---|---|
| R2 | 0.90 | 0.89 | 0.73 | 0.69 | 0.73 | 0.55 | 0.92 | 0.95 | 0.94 | 0.90 | 0.83 | 0.73 | 0.25 | 0.95 |
| P | 10−8 | 10−8 | 10−5 | 10−5 | 10−5 | 10−3 | 10−9 | 10−10 | 10−10 | 10−8 | 10−7 | 10−5 | 0.02 | 10−10 |
Almost all the correlations were high, with R2 values higher than 0.69 (correlation coefficient ρ > 0.83) for all the parameters except for QPL and EPP/LT.
Lens Central Geometric Parameters: Change with Age
Figure 3 shows the RAL, RPL, RALQ, QAL, RPLQ, QPL, and LT as a function of age. The black solid line represents the best fitted curvilinear model. The red and green dotted lines represent the best linear models for ages equal or greater, and lower than 20 years, respectively. Table 3 shows the equation of the curvilinear (second column) and linear (third and fourth columns, below and above age 20 years, respectively) models for each parameter (row), including the RMSE, the R2, and the P value for testing the hypothesis of no correlation.
Figure 3.

Changes of central parameters with age. Black solid line represents the best curvilinear model (0–56 years) and green and red dashed lines (only drawn when correlation is statistically significant) represent the best linear models (0–19 years and 20–56 years, respectively). Equations of the selected models are shown in Table 3.
Table 3.
Equations for the Parameters of the Central Part of the Lens as a Function of Age
| Curvilinear Model (0–56 years) | Linear Model (0–19 years) | Linear Model (20–56 years) | |
|---|---|---|---|
| RAL (mm) | , RMSE (mm) = 0.97 | RAL = 4.40 + 0.187 · age, R2 = 0.81, P = 10−11* | RAL = 7.30 + 0.071 · age, R2 = 0.25, P = 10−5* |
| RPL (mm) | , RMSE (mm) = 0.49 | RPL = 3.636 + 0.092 · age, R2 = 0.78, P = 9 · 10−11* | RPL = 5.40 + 0.0177 · age, R2 = 0.08, P = 0.03* |
| RALQ (mm) | , RMSE (mm) = 1.56 | RALQ = 5.07 + 0.076 · age, R2 = 0.31, P = 0.001* | RALQ = 5.866 + 0.089 · age, R2 = 0.18, P = 1 · 10−3* |
| QAL | QAL = 0.0070 · age2 − 0.3976 · age + 1.235, RMSE = 3.73 | QAL = 1, 817 − 0.37 · age, R2 = 0.61, P = 2 · 10−7* | QAL = −7.489 + 0.123 · age, R2 = 0.06, P = 0.049* |
| RPLQ (mm) | RMSE (mm) = 0.62 | RPLQ = 3.99 + 0.044 · age, R2 = 0.28, P = 0.002* | RPLQ = 4.35 + 0.0364 · age, R2 = 0.19, P = 6 · 10−4* |
| QPL | QPL = 0.0022 · age2 − 0.136 · age + 0.54, RMSE = 0.87 | QPL = 0.448 − 0.097 · age, R2 = 0.50, P = 1 · 10−5* | QPL = −2.24, P = 0.054 |
| LT (mm) | LT = −1.32 · 10−5 · age3 + 0.00182 · age2 − 0.0658 · age + 4.802, RMSE (mm) = 0.22 | LT = 4.748 − 0.0366 · age, R2 = 0.47, P = 3 · 10−5* | LT = 3.68 + 0.0146 · age, R2 = 0.39, P = 2 · 10−7* |
Second column: selected curvilinear model (0–56 years) and RMSE; third column: linear model (0–19 years), R2 and P value; fourth column: linear model (20–56 years), R2 and P value. *Indicates statistically significant correlations.
Most of the parameters changed rapidly before an age of approximately 20 years and then increased slowly and linearly (or remained constant in the case of QPL) for older ages. LT decreased from 0 to approximately 20 years, in which it reached its minimum, increasing linearly thereafter. QAL and QPL decreased significantly (from approximately 0- sphere shape- to negative values) from newborn to approximately 20 years, remaining almost constant (QPL) or increasing slowly (QAL) thereafter.
Full Lens Geometric Parameters: Change with Age
Figure 4 shows the DIA, VOL, LSA, EPP, and the ratios LSA/VOL, EPP/LT, and LT/DIA as a function of age. Table 4 shows the equation of the curvilinear and linear models for each parameter, including the RMSE, the R2, and the P value.
Figure 4.

Changes of full shape parameters with age. Black solid line represents the best curvilinear model (0–56 years) and green and red dashed lines (only drawn when correlation is statistically significant) represent the best linear models (0–19 years and 20–56 years, respectively). Equations of the selected models are shown in Table 4.
Table 4.
Equations for the Parameters of the Full Shape of the Lens as a Function of Age
| Curvilinear Model (0–56 years) | Linear Model (0–19 years) | Linear Model (20–56 years) | |
|---|---|---|---|
| DIA (mm) | DIA = 6.97 · age0.0748, RMSE (mm) = 0.23 | DIA = 7.07 + 0.0907 · age, R2 = 0.73, P = 2.1 · 10−9* | DIA = 8.298 + 0.0229 · age, R2 = 0.48, P = 1.9 · 10−9* |
| VOL (mm3) | VOL = 3.166 · age0.832 + 110.4, RMSE (mm3) = 13.6 | VOL = 117.7 + 1.469 · age, R2 = 0.30, P = 0.002* | VOL = 112.7 + 1.665 · age, R2 = 0.60, P = 1 · 10−12* |
| LSA (mm2) | LSA = 23.97 · age0.337 + 93.73, RMSE (mm2) = 8.17 | LSA = 124.55 + 1.768 · age, R2 = 0.56, P = 1.9 · 10−6* | LSA = 140.27 + 0.93 · age, R2 = 0.53, P = 1.7 · 10−10* |
| EPP (mm) | EPP = −7.169 · 10−6 · age3 + 9.546 · 10−4 · age2 − 0.0372 · age + 2.21, RMSE (mm) = 0.15 | EPP = 2.186 − 0.0227 · age, R2 = 0.46, P = 3 · 10−5* | EPP = 1.68, P = 0.06 |
| LSA/VOL (mm−1) | , RMSE (mm−1) = 0.020 | 6, P = 0.89 | , R2 = 0.52, P = 2 · 10−10* |
| EPP/LT | , R2 = 0.036 | P = 0.04* | , P = 0.7 |
| LT/DIA | , RMSE = 0.02 | , R2 = 0.84, P = 1 · 10−12* | , P = 0.16 |
Second column: selected curvilinear model (0–56 years) and RMSE; third column: linear model (0–19 years), R2 and P value; fourth column: linear model (20–56 years), R2 and P value. *Indicates statistically significant correlations.
Fastest changes in DIA with age occurred mainly before 10 years. After this age changes in DIA, VOL, and LSA were well described with linear models. EPP and EPP/LT ratio decreased before 20 years, and after this age remained constant. The mean value ± SD for EPP/LT = 0.43 ± 0.02, with a maximum of 0.49 (for newborn lenses) and a minimum of 0.36. LT/DIA decreased fast before age 20 years and remained almost constant thereafter.
Repeatability of the 3-D Models Construction
The average SD across lenses (the average differences between measurements from the same lens) was: 0.09 mm for RAL, 0.03 mm for RPL, 0.02 mm for DIA, 0.91 mm3 for VOL, 2.8 mm2 for LSA, 0.05 mm for EPP, 2.05 for QAL, and 0.42 for QPL. These values were very low in comparison with the RMSE (approximately 10 times lower for RAL, 24 for RPL, 11 for DIA, 5 for VOL, 3 for LSA, 13 for EPP, 2 for QAL, and 2 for QPL), concluding that the process repeatability was high and that the variance because of the measurement and 3-D models construction was much lower than the intersubject variance of the lenses.
Discussion
We quantified the full shape of the isolated human crystalline lens from 3-D OCT images in 103 lenses from 87 subjects, in a range of ages spanning from newborn to 56 years. Specifically, we obtained parameters of the central part (LT, curvature radius and asphericities of the anterior and posterior surfaces of the lens) and the full shape of the lens (DIA, VOL, LSA, and EPP), and we analyzed their dependency with age.
Comparison with Earlier Work
Most lens geometric parameters showed a biphasic behavior with a rapid change before 10 to 20 years, and a slower linear growth thereafter. These trends are in good agreement with VOL, DIA, and LT/DIA from an earlier study on 141 lenses (ages 0–88 years) imaged using shadowgraphy.30 Interestingly, both studies show a fast increase of VOL before age 10 years, a plateau between 10 and 20 years, and a linear increase thereafter. Mutti et al.6 also found that VOL did not increase in in vivo measurements between age 6 and 14 years in a large sample (n = 3007). We found a linear decrease of LT before age 20 years, also reported in other studies.30,51 Although there is not enough statistical evidence, in our dataset we observe that the LT increases quickly from 0 years (LT∼4.2 mm) until it reaches its maximum at approximately 4 years (LT∼5.2 mm), and then it decreases again until about the age of 20 years, in which it reaches its life minimum. Nevertheless, to confirm this hypothesis, a higher number of samples are needed in ages near 0 to ensure that the 2 points at 0 years are not outliers. The same behavior is observed in other parameters (e.g., EPP and LSA/VOL). EPP/LT decreases significantly for ages younger than 20 years, and remained constant (0.43) after 20 years, consistent with earlier studies.30
To the best of our knowledge, there are no prior publications of results for RAL, RPL, RALQ, QAL, RPLQ, QPL, LSA, and EPP before age 20 years. QAL and QPL decreased significantly from approximately 0 to 20 years (–0.37 year−1 and –0.097 year−1, respectively), whereas RAL and RPL increased very fast in the first years of life (0.19 and 0.09 mm/year, respectively).
We found a significant increase of DIA above age 20 years, with a slope of 0.02 mm/year, similarly to Urs et al.29 and Jones et al.,34 and slightly higher than Rosen et al.28 (0.014 mm/year) and Asafali30 (0.010 mm/year). We found an increase of VOL at a rate of 1.66 mm3/year, similar to Urs et al.29 (1.35 mm3/year) and Asafali30 (1.2 mm3/year). Rosen et al.28 overestimated the VOL because of the use of an approximate ellipsoid model for the lens. Urs et al.29 estimated an increase of LSA at a rate of 0.86 mm2/year, similar to the one in our study (0.93 mm2/year).
We found that RAL increases significantly (0.071 mm/year with R2 = 0.25) similar to reports by Rosen et al.28 (0.046 mm/year, R2 = 0.27) and Glasser and Campbell52 (0.068 mm/year), and in contrast to studies by Manns et al.,36 Jones et al.,34 and Schachar,35 which did not obtain a significant increase of RAL with age. Different to other authors, we found small but significant changes of RPL with age (0.017 mm/year). Similarly to Borja et al.27 and Glasser and Campbell,52 RAL and RPL seem to slightly decrease from approximately age 50 years, although more lenses in this age range are needed to obtain statistical evidence of this observation.
LT increased significantly after the age of 20 years with a slope of 0.0146 mm/year, within the range of previous studies by Rosen et al.28 (0.012 mm/year), Asafali30 (0.01 mm/year), and Birkenfeld et al.31 (0.019 mm/year), and lower than the slope obtained by Augusteyn et al.37 (approximately 0.027 mm/year). Changes of EPP/LT with age were not significant beyond 20 years (constant value of 0.43). Similar conclusions were obtained by Rosen et al.28 (constant value of 0.41) and Asafali30 (constant value of 0.42). Changes of LT/DIA were not significant beyond age 20 years (constant value of 0.445), similar to the value obtained by Asafali30 and Augusteyn51 (0.45).
Small discrepancies between slopes obtained in different studies can arise from differences in the sample distributions and age ranges, as well as differences in the parameters estimation method, as data in previous studies were obtained from two-dimensional (2-D) images of the lens. Differences in radius of curvature and asphericities may also arise from different fitting sizes (in this study, 6 mm) and different parametric models used (in this study, we present sphere and conicoid fittings).
Ex Vivo Versus In Vivo Geometry
Results of the isolated lenses (free of zonular tension) reflect, partially, the decreased elasticity of the crystalline lens with age (i.e., a larger ability of younger lenses to accommodate, and thus to change their shape increasing its thickness). Nevertheless, the biphasic response in some parameters, as for example the LT (Fig. 3), has been also observed in vivo in unaccommodated lenses.6,51 It appears that in vivo the stretching of the young lens from growth of the globe counteracts (and in fact overcompensates) the lens axial thickening (because of the addition of new cell layers trough life) with aging, explaining the decreased LT at a young age.6 This biphasic behavior is also observed in isolated lenses, suggesting that the growth of the lens is in accordance with the growth of the globe, remodeling from its more rounded shape in the newborn lens to the adult ellipsoidal shape, as can be deduced from the LT/DIA and LSA/VOL graphs in Figure 4.
In previous studies, it has been observed that isolated lenses can be considered equivalent to fully accommodated lenses53 (Martinez-Enriquez E, et al. IOVS 2018;59:ARVO E-Abstract 268). Considering that the amplitude of accommodation decreases with age, the in vivo and ex vivo curves should correspond after presbyopia. We should also expect the VOL to be similar in vivo and ex vivo for a given age independently of the accommodation state, as it has been shown that lens VOL remains constant with accommodation.20,54 Interestingly, our lens VOL results are in good agreement with those estimated with in vivo crystalline lenses by Mutti et al.6 (6–14 years) assuming a spherical radii and Martinez-Enriquez et al.20
Lens Swelling Due to Water Uptake and Choice of Preservation Media
An important concern when working with ex vivo lenses is the fact that lens placed in liquid media can retain water, provoking swelling of tissue, and thus compromising the measurement of the “real” shape of the lens.50 Special care was taken to avoid lens swelling, as described in the Material and methods section. Our results showed a negligible average increase in LT of 0.01 mm (0.24%) from anterior- to posterior-up measurements, with only 2 out of the 103 lenses with an increase larger than 0.1 mm (2.3% of change). In addition, we did not find statistically significant correlations between any of the quantification parameters and the postmortem time.
Augusteyn et al.50 discussed the influence of using different liquid preservation media, comparing culture media (e.g., the Dulbecco's modified Eagle's medium [DMEM]) with salt solutions (e.g., the BSS). They showed that, although in tissue culture media a smaller proportion of human lenses developed capsular separation than in salt solutions, in lenses without capsular separation the DIA, LT, and VOL changes due to water uptake were “very little, if any”, independently of the culture media (–0.7%, 1.5 %, and 0.2% of changes, respectively). In our study, we have discarded lenses with capsular separation or signs of swelling, and changes in the geometry of the lenses are not expected. In previous works we used DMEM as preservation media; however, with a chronic use of DMEM, we observed the deposition of salt contents (such as a foggy layer) particularly on the glassy components of the chamber. This was not the case with BSS. For the reasons mentioned earlier, BSS instead of DMEM was used as the immersion solution.
Advantages of 3-D Imaging
One of the main novelties of this work is that the quantification of the lens parameters is based on 3-D images instead of cross-sectional images, as in most of the previous studies.26–30,33–37,52,55
In a previous work,21 we evaluated the benefits of using 3-D imaging against 2-D cross-sectional images in the estimation of full-shape geometric parameters from the central part of the lens. Here we evaluated similarly the dependence of the obtained quantification results with the 2-D meridian measured. Briefly, we took eight different 2-D meridians through the lens center for every whole 3-D lens model, and from every meridian, we constructed and quantified a 3-D rotationally symmetric model. On average (across meridians and lenses), the SD for the DIA was 0.15 mm, for the VOL was 5 mm3, for the LSA was 9 mm2, and for the EPP was 81 µm. This implies that the parameter values can change up to 5%, 8%, 12%, and 14% in DIA, VOL, LSA, and EPP, respectively, depending on the meridian measured. This variability is in agreement with studies that estimated the errors associated with the assumption of lens rotational symmetry.32,54 Furthermore, as explained in the previous section, 3-D information is essential for obtaining an accurate automatic segmentation process (using Zernike approximations).
Correlation Between Paired Eyes
As shown in Table 2, almost all the correlations between the crystalline lens geometry from right and left eyes were high, with R2 > 0.88 (correlation coefficient ρ > 0.94) for 7 parameters, and R2 > 0.68 (correlation coefficient ρ > 0.82) for 12 out of 14 measured parameters. This means that the intrasubject geometric variability is small. This result also confirms the reliability of the whole process because although the values measured for left and right eyes came from independent measurements, image processing, and quantification processes, they were very similar. The lower correlation values for QAL (R2 = 0.69) and QPL (R2 = 0.55) indicate that the estimation of asphericities is less stable (noisier) than that of other parameters.56
Implications for Lens Growth, Emmetropization, Aging, and Treatment
We found rapid changes in lens shape and size from birth into adolescence. The ratio LT/DIA decreases fast from approximately 0.70 at birth to approximately 0.45 at age 20 to 30 years, indicating that the lens is more rounded at birth, and evolves toward a more ellipsoidal shape at 20 years, keeping approximately this shape thereafter. However, the steady increase in VOL from approximately 20 years is consistent with the growth of the crystalline lens with age.57 The decreasing LSA/VOL ratio can be consistent with the continuous synthesis of lens crystallin proteins throughout life and the lens compaction with age, with implications in the development of gradient refractive index. In the age range corresponding to presbyopia (>40 years), LT and VOL increase linearly with age.
Knowledge of crystalline lenses at all ages is not only important to understand lens development and presbyopia, but has practical implications in other areas, such as cataract surgery. The selection of optimal IOL power is affected by lens capsular bag dimensions, although current formulas rarely take crystalline lens shape into account. Figure 4 shows that EPP/LT ratio is highly patient-dependent. We recently found that the IOL position estimation can be improved using EPP/LT ratio as an estimator,2 so it may be very relevant to know the full shape of the crystalline lens to improve the outcome in a cataract surgery. The drastic changes in lens shape with age are particularly relevant when IOLs are implanted in younger segments of the populations, in particular pediatric cataract surgery, as well as in refractive lens exchange. Besides, some emerging solutions for restoration of accommodation in presbyopia, such as capsular lens refilling and accommodating IOLs, are fully dependent on crystalline lens dimensions. The evidence of individual differences in the crystalline lens dimensions, and particularly their age-dependence, calls for the importance of introducing those factors in the lens development and prescription.
Supplementary Material
Acknowledgments
The authors thank Siobhan Williams, Shravya Durgam, and Sushma Nandyala for their useful contributions to the article.
Supported by the Ministerio de Educación y Ciencia, Spain (FIS2017- 84753-R), European Research Council (ERC-2011-AdG-294099), and IMCUSTOMEYE Ref. 779960 (H2020-ICT- 2017-1) (SM), and European Research Council under European Union's Horizon 2020 research and innovation programme H2020-MSCA COFUND-2015 FP-713694, MULTIPLY (AdC), Consejo Superior de Investigaciones Científicas ICoop Program, National Eye Institute (Grants 2R01EY021834, P30EY14801) (Center Grant), the Hyderabad Eye Research Foundation, Florida Lions Eye Bank and the Beauty of Sight Foundation, and an unrestricted grant from Research to Prevent Blindness.
Disclosure: E. Martinez-Enriquez, Method of estimating a full shape of the crystalline lens from measurements taken by optic imaging techniques and method of estimating an intraocular lens position in a cataract surgery, U.S. patent application US201662329392P (P); A. de Castro, None; A. Mohamed, None; N.G. Sravani, None; M. Ruggeri, None; F. Manns, None; S. Marcos, Procedure to calibrate and correct the scan distortion of an optical coherence tomography system, Spanish patent P201130685 (P), and method of estimating a full shape of the crystalline lens from measurements taken by optic imaging techniques and method of estimating an intraocular lens position in a cataract surgery, U.S. patent application US201662329392P (P)
Amended June 25, 2020: Tables 2 and 4 were switched in the original published article. The tables have now been placed in the correct locations and the references to them renumbered.
References
- 1. de la Hoz A, Germann J, Martinez-Enriquez E, et al.. Design and ex situ performance of a shape-changing accommodating intraocular lens. Optica. 2019; 6: 1050–1057. [Google Scholar]
- 2. Martinez-Enriquez E, Perez-Merino P, Duran-Poveda S, Jimenez-Alfaro I, Marcos S. Estimation of intraocular lens position from full crystalline lens geometry: towards a new generation of intraocular lens power calculation formulas. Sci Rep. 2018; 8: 9829. [DOI] [PMC free article] [PubMed] [Google Scholar]
- 3. Parel JM, Gelender H, Trefers WF, Norton EW. Phaco-Ersatz: cataract surgery designed to preserve accommodation. Graefes Arch Clin Exp Ophthalmol. 1986; 224: 165–173. [DOI] [PubMed] [Google Scholar]
- 4. Nishi Y, Mireskandari K, Khaw P, Findl O. Lens refilling to restore accommodation. J Cataract Refract Surg. 2009; 35: 374–382. [DOI] [PubMed] [Google Scholar]
- 5. Koopmans SA, Terwee T, Glasser A, et al.. Accommodative lens refilling in rhesus monkeys. Invest Ophthalmol Vis Sci. 2006; 47: 2976–2984. [DOI] [PMC free article] [PubMed] [Google Scholar]
- 6. Mutti DO, Zadnik K, Fusaro RE, Friedman NE, Sholtz RI, Adams AJ. Optical and structural development of the crystalline lens in childhood. Invest Ophthalmol Vis Sci. 1998; 39: 120–133. [PubMed] [Google Scholar]
- 7. Garner LF, Yap MK. Changes in ocular dimensions and refraction with accommodation. Ophthalmic Physiol Opt. 1997; 17: 12–17. [PubMed] [Google Scholar]
- 8. Rosales P, Dubbelman M, Marcos S, van der Heijde R. Crystalline lens radii of curvature from Purkinje and Scheimpflug imaging. J Vis. 2006; 6(10): 5. [DOI] [PubMed] [Google Scholar]
- 9. Cook CA, Koretz JF, Pfahnl A, Hyun J, Kaufman PL. Aging of the human crystalline lens and anterior segment. Vision Res. 1994; 34: 2945–2954. [DOI] [PubMed] [Google Scholar]
- 10. Dubbelman M, Van der Heijde GL. The shape of the aging human lens: curvature, equivalent refractive index and the lens paradox. Vision Res. 2001; 41: 1867–1877. [DOI] [PubMed] [Google Scholar]
- 11. Dubbelman M, van der Heijde GL, Weeber HA. The thickness of the aging human lens obtained from corrected Scheimpflug images. Optom Vis Sci. 2001; 78: 411–416. [DOI] [PubMed] [Google Scholar]
- 12. Dubbelman M, Van der Heijde GL, Weeber HA. Change in shape of the aging human crystalline lens with accommodation. Vision Res. 2005; 45: 117–132. [DOI] [PubMed] [Google Scholar]
- 13. Dubbelman M, Van der Heijde GL, Weeber HA, Vrensen GF. Changes in the internal structure of the human crystalline lens with age and accommodation. Vision Res. 2003; 43: 2363–2375. [DOI] [PubMed] [Google Scholar]
- 14. Koretz JF, Cook CA, Kaufman PL. Aging of the human lens: changes in lens shape at zero-diopter accommodation. J Opt Soc Am A Opt Image Sci Vis. 2001; 18: 265–272. [DOI] [PubMed] [Google Scholar]
- 15. Ramasubramanian V, Glasser A. Objective measurement of accommodative biometric changes using ultrasound biomicroscopy. J Cataract Refract Surg. 2015; 41: 511–526. [DOI] [PMC free article] [PubMed] [Google Scholar]
- 16. Atchison DA, Markwell EL, Kasthurirangan S, Pope JM, Smith G, Swann PG. Age-related changes in optical and biometric characteristics of emmetropic eyes. J Vis. 2008; 8(4): 29. [DOI] [PubMed] [Google Scholar]
- 17. Kasthurirangan S, Markwell EL, Atchison DA, Pope JM. MRI study of the changes in crystalline lens shape with accommodation and aging in humans. J Vis. 2011; 11(3): 19. [DOI] [PubMed] [Google Scholar]
- 18. Hermans EA, Pouwels PJ, Dubbelman M, Kuijer JP, van der Heijde RG, Heethaar RM. Constant volume of the human lens and decrease in surface area of the capsular bag during accommodation: an MRI and Scheimpflug study. Invest Ophthalmol Vis Sci. 2009; 50: 281–289. [DOI] [PubMed] [Google Scholar]
- 19. Sheppard AL, Evans CJ, Singh KD, Wolffsohn JS, Dunne MC, Davies LN. Three-dimensional magnetic resonance imaging of the phakic crystalline lens during accommodation. Invest Ophthalmol Vis Sci. 2011; 52: 3689–3697. [DOI] [PubMed] [Google Scholar]
- 20. Martinez-Enriquez E, Perez-Merino P, Velasco-Ocana M, Marcos S. OCT-based full crystalline lens shape change during accommodation in vivo. Biomed Opt Express. 2017; 8: 918–933. [DOI] [PMC free article] [PubMed] [Google Scholar]
- 21. Martinez-Enriquez E, Sun M, Velasco-Ocana M, Birkenfeld J, Perez-Merino P, Marcos S. Optical coherence tomography based estimates of crystalline lens volume, equatorial diameter, and plane position. Invest Ophthalmol Vis Sci. 2016; 57: OCT600–OCT610. [DOI] [PubMed] [Google Scholar]
- 22. Gambra E, Ortiz S, Perez-Merino P, Gora M, Wojtkowski M, Marcos S. Static and dynamic crystalline lens accommodation evaluated using quantitative 3-D OCT. Biomed Opt Express. 2013; 4: 1595–1609. [DOI] [PMC free article] [PubMed] [Google Scholar]
- 23. Ortiz S, Perez-Merino P, Gambra E, de Castro A, Marcos S. In vivo human crystalline lens topography. Biomed Opt Express. 2012; 3: 2471–2488. [DOI] [PMC free article] [PubMed] [Google Scholar]
- 24. Pérez-Merino P, Velasco-Ocana M, Martinez-Enriquez E, Marcos S. OCT-based crystalline lens topography in accommodating eyes. Biomed Opt Express. 2015; 6: 5039–5054. [DOI] [PMC free article] [PubMed] [Google Scholar]
- 25. Muralidharan G, Martínez-Enríquez E, Birkenfeld J, Velasco-Ocana M, Pérez-Merino P, Marcos S. Morphological changes of human crystalline lens in myopia. Biomed Opt Express. 2019; 10: 6084–6095. [DOI] [PMC free article] [PubMed] [Google Scholar]
- 26. Urs R, Ho A, Manns F, Parel JM. Age-dependent Fourier model of the shape of the isolated ex vivo human crystalline lens. Vision Res. 2010; 50: 1041–1047. [DOI] [PMC free article] [PubMed] [Google Scholar]
- 27. Borja D, Manns F, Ho A, et al.. Optical power of the isolated human crystalline lens. Invest Ophthalmol Vis Sci. 2008; 49: 2541–2548. [DOI] [PMC free article] [PubMed] [Google Scholar]
- 28. Rosen AM, Denham DB, Fernandez V, et al.. In vitro dimensions and curvatures of human lenses. Vision Res. 2006; 46: 1002–1009. [DOI] [PubMed] [Google Scholar]
- 29. Urs R, Manns F, Ho A, et al.. Shape of the isolated ex-vivo human crystalline lens. Vision Res. 2009; 49: 74–83. [DOI] [PMC free article] [PubMed] [Google Scholar]
- 30. Asafali AM. The Effect of Age on Human Natural Lens Growth and Biometry [Ph.D. thesis]. University of New South Wales, Faculty of Science, Optometry & Vision Science; 2017. [Google Scholar]
- 31. Birkenfeld J, de Castro A, Marcos S. Contribution of shape and gradient refractive index to the spherical aberration of isolated human lenses. Invest Ophthalmol Vis Sci. 2014; 55: 2599–2607. [DOI] [PubMed] [Google Scholar]
- 32. Sun M, Birkenfeld J, de Castro A, Ortiz S, Marcos S. OCT 3-D surface topography of isolated human crystalline lenses. Biomed Opt Express. 2014; 5: 3547–3561. [DOI] [PMC free article] [PubMed] [Google Scholar]
- 33. Uhlhorn SR, Borja D, Manns F, Parel JM. Refractive index measurement of the isolated crystalline lens using optical coherence tomography. Vision Res. 2008; 48: 2732–2738. [DOI] [PMC free article] [PubMed] [Google Scholar]
- 34. Jones CE, Atchison DA, Meder R, Pope JM. Refractive index distribution and optical properties of the isolated human lens measured using magnetic resonance imaging (MRI). Vision Res. 2005; 45: 2352–2366. [DOI] [PubMed] [Google Scholar]
- 35. Schachar RA. Central surface curvatures of postmortem- extracted intact human crystalline lenses: implications for understanding the mechanism of accommodation. Ophthalmology. 2004; 111: 1699–1704. [DOI] [PubMed] [Google Scholar]
- 36. Manns F, Fernandez V, Zipper S, et al.. Radius of curvature and asphericity of the anterior and posterior surface of human cadaver crystalline lenses. Exp Eye Res. 2004; 78: 39–51. [DOI] [PubMed] [Google Scholar]
- 37. Augusteyn RC, Mohamed A, Nankivil D, et al.. Age-dependence of the optomechanical responses of ex vivo human lenses from India and the USA, and the force required to produce these in a lens stretcher: the similarity to in vivo disaccommodation. Vision Res. 2011; 51: 1667–1678. [DOI] [PMC free article] [PubMed] [Google Scholar]
- 38. Ortiz S, Siedlecki D, Grulkowski I, et al.. Optical distortion correction in optical coherence tomography for quantitative ocular anterior segment by three-dimensional imaging. Opt Express. 2010; 18: 2782–2796. [DOI] [PubMed] [Google Scholar]
- 39. Ortiz S, Siedlecki D, Remon L, Marcos S. Optical coherence tomography for quantitative surface topography. Appl Opt. 2009; 48: 6708–6715. [DOI] [PubMed] [Google Scholar]
- 40. Dunne MC, Davies LN, Wolffsohn JS. Accuracy of cornea and lens biometry using anterior segment optical coherence tomography. J Biomed Opt. 2007; 12: 064023. [DOI] [PubMed] [Google Scholar]
- 41. Gora M, Karnowski K, Szkulmowski M, et al.. Ultra high-speed swept source OCT imaging of the anterior segment of human eye at 200 kHz with adjustable imaging range. Opt Express. 2009; 17: 14880–14894. [DOI] [PubMed] [Google Scholar]
- 42. Huang D, Swanson EA, Lin CP, et al.. Optical coherence tomography. Science. 1991; 254: 1178–1181. [DOI] [PMC free article] [PubMed] [Google Scholar]
- 43. Shen M, Wang MR, Yuan Y, et al.. SD-OCT with prolonged scan depth for imaging the anterior segment of the eye. Ophthalmic Surg Lasers Imaging. 2010; 41(suppl): S65–S69. [DOI] [PubMed] [Google Scholar]
- 44. Yadav R, Ahmad K, Yoon G. Scanning system design for large scan depth anterior segment optical coherence tomography. Opt Lett. 2010; 35: 1774–1776. [DOI] [PubMed] [Google Scholar]
- 45. Sun M, Pérez-Merino P, Martinez-Enriquez E, Velasco-Ocana M, Marcos S. Full 3-D OCT-based pseudophakic custom computer eye model. Biomed Opt Express. 2016; 7: 1074–1088. [DOI] [PMC free article] [PubMed] [Google Scholar]
- 46. Ruggeri M, Williams S, Heilman BM, et al.. System for on- and off-axis volumetric OCT imaging and ray tracing aberrometry of the crystalline lens. Biomed Opt Express. 2018; 9: 3834–3851. [DOI] [PMC free article] [PubMed] [Google Scholar]
- 47. Nankivil D, Manns F, Arrieta-Quintero E, et al.. Effect of anterior zonule transection on the change in lens diameter and power in cynomolgus monkeys during simulated accommodation. Invest Ophthalmol Vis Sci. 2009; 50: 4017–4021. [DOI] [PMC free article] [PubMed] [Google Scholar]
- 48. Borja D, Siedlecki D, de Castro A, et al.. Distortions of the posterior surface in optical coherence tomography images of the isolated crystalline lens: effect of the lens index gradient. Biomed Opt Express. 2010; 1: 1331–1340. [DOI] [PMC free article] [PubMed] [Google Scholar]
- 49. Navarro R, Gonzalez L, Hernandez JL. Optics of the average normal cornea from general and canonical representations of its surface topography. J Opt Soc Am A Opt Image Sci Vis. 2006; 23: 219–232. [DOI] [PubMed] [Google Scholar]
- 50. Augusteyn RC, Rosen AM, Borja D, Ziebarth NM, Parel JM. Biometry of primate lenses during immersion in preservation media. Mol Vis. 2006; 12: 740–747. [PubMed] [Google Scholar]
- 51. Augusteyn RC. On the growth and internal structure of the human lens. Exp Eye Res. 2010; 90: 643–654. [DOI] [PMC free article] [PubMed] [Google Scholar]
- 52. Glasser A, Campbell MC. Biometric, optical and physical changes in the isolated human crystalline lens with age in relation to presbyopia. Vision Res. 1999; 39: 1991–2015. [DOI] [PubMed] [Google Scholar]
- 53. Augusteyn RC. Growth of the human eye lens. Mol Vis. 2007; 13: 252–257. [PMC free article] [PubMed] [Google Scholar]
- 54. Marussich L, Manns F, Nankivil D, et al.. Measurement of crystalline lens volume during accommodation in a lens stretcher. Invest Ophthalmol Vis Sci. 2015; 56: 4239–4248. [DOI] [PMC free article] [PubMed] [Google Scholar]
- 55. Glasser A, Campbell MC. Presbyopia and the optical changes in the human crystalline lens with age. Vision Res. 1998; 38: 209–229. [DOI] [PubMed] [Google Scholar]
- 56. Perez-Escudero A, Dorronsoro C, Marcos S. Correlation between radius and asphericity in surfaces fitted by conics. J Opt Soc Am A Opt Image Sci Vis. 2010; 27: 1541–1548. [DOI] [PubMed] [Google Scholar]
- 57. Mohamed A, Augusteyn RC. Human lens weights with increasing age. Mol Vis. 2018; 24: 867. [PMC free article] [PubMed] [Google Scholar]
Associated Data
This section collects any data citations, data availability statements, or supplementary materials included in this article.