

Abstract
Osteoporosis affects all populations, but the risk for low bone density and fracture varies greatly by self-reported race and ethnicity. In this article, the relationship between measured percent African admixture and hip structural geometry, estimated from the hip structural analysis (HSA) program, was examined in a subcohort of the Women’s Health Initiative (WHI). The study sample included 793 African-American women and 8559 non-Hispanic white women. All the participants were postmenopausal, between the ages of 50 and 79 years, at the time of recruitment and were followed for up to 9 years. Bone density and hip geometry were assessed using dual-energy X-ray absorptiometry. African admixture was measured for African Americans using genetic ancestry informative markers. Multiple regression and mixed-effects models were used for cross-sectional and longitudinal analyses, respectively. Covariates assessed from questionnaires and physical measurements were included in the analysis to control for possible confounding effects. The study results show significant correlations between percent of African admixture and HSA assessments. In comparison with non-Hispanic white women, significantly greater bone strength, as indicated by higher hip bone mineral density and stronger hip geometry, in women with higher African admixture was observed. However, women with higher percent African admixture had larger reductions in bone strength than non-Hispanic white women during the follow-up.
Keywords: HIP STRUCTURAL ANALYSIS, AFRICAN ADMIXTURE, WOMEN’S HEALTH INITIATIVE, OSTEOPOROSIS, AFRICAN AMERICAN
Introduction
Fractures, particularly hip fractures, are significant health threats to the growing aging populations throughout the world. However, the burden of fractures to older adults differs from population to population owing to genetic and environmental variations. The incidence of fractures in African-American women in the United States is half that of non-Hispanic white women.(1–3) Higher bone density and more favorable hip geometric structures have been reported in self-identified African Americans from previous studies,(4) including the Women’s Health Initiative (WHI).(5) These findings are consistent with the observed low fracture rate in African Americans. However, most previous studies relied on self-reported race and ethnicity. The relative contributions of genetic versus environmental components for the apparent stronger bones in African Americans remains uncertain.(6–10) although one study has demonstrated a possible association of high bone mineral density (BMD) and African origins determined by genetic markers.(11)
Genetic differences between major ancestral groups have been recognized for many years,(12) and differences in the frequency of different disease phenotypes also have been apparent (eg, sickle-cell anemia with a higher frequency in African population groups and cystic fibrosis and multiple sclerosis in European populations). More recently, markers dispersed throughout the genome have been identified that can distinguish between the ancestral origins of African-American and Hispanic populations.(13–20) Studies using several hundred microsatellite markers have suggested that the world’s population can be grouped into six major ancestral groups,(21) and similar results have been obtained using a limited number [92 single-nucleotide polymorphisms (SNPs)] of selected ancestry informative markers (AIMs).(22)
African Americans in the United States are an admixed population deriving primarily from sub-Saharan African origin (referred to as African in the remainder of this article) but with substantial proportions of admixture with European population groups.(23) Although the average contribution of African and European admixture is at a ratio of 4:1, the relative proportion of admixture in African Americans varies by individual.(13,23) Based on more than 1000 well-distributed AIMs that distinguish between sub-Saharan African and European ancestry (selected from Tian and colleagues(17)), the percentage of African admixture for each African-American individual was determined in a subgroup of African Americans who had bone density testing and hip structural geometry measurements in the WHI.
The primary objectives of this study were, first, to assess the association between relative African and European admixture and bone strength as measured by hip structural geometry and, second, to evaluate the association between admixture and the rate of changes in the bone-strength estimates from hip structural geometry in a subcohort of postmenopausal women from the WHI to further investigate the relationship between ancestry and bone strength.
Materials and Methods
Study participants
The WHI is the largest US health study in a multiracial and multiethnic group of postmenopausal women. There were 40 clinical centers nationwide, and the recruitment for over 160,000 women was completed between 1993 and 1998. There were four intervention trials and one observational study in the WHI, with the primary outcomes focusing on cardiovascular disease, cancer, and osteoporotic fractures.(24)
Women who were enrolled at one of the three WHI BMD centers in Birmingham, Alabama; Pittsburgh, Pennsylvania; or Tucson and Phoenix, Arizona, comprised the sample for this report. They were 50 to 79 years of age at the time of enrollment to the WHI and self-reported being either African American or non-Hispanic white. Participants were in good health and not likely to die in 3 years or move to another city. The study protocol and consent forms were approved by the institutional review boards for all participating institutions.
Study procedure and follow-up
Participants in this study completed a series of questionnaires at baseline for eligibility to the WHI as well for information on lifestyle, medical history, and reproductive history. Physical measurements and blood sample collections were conducted during baseline WHI clinical visits. Bone density was measured at baseline and every 3 years during the WHI follow-up. Annual or semiannual questionnaires were sent to participants for completion to ascertain selected health outcomes and updates on information pertaining to lifestyle and medicine use.(24)
DXA measurements
Dual-energy X-ray absorptiometry (DXA;Hologic QDR 2000 or 4500w, Hologic, Inc., Waltham, MA, USA) was used in this study to measure bone density at the hip, spine, and total body. Standard protocols were used for positioning and analysis. All the DXA technicians were trained and certified by the DXA manufacturer and by the WHI BMD coordination center at the University of California at San Francisco. Scans of spine and hip phantoms were a part of the ongoing quality assurance program. In addition, a random sample of all subject scans was reviewed and flagged for specific problems for evaluation and solution. Hardware and software changes were tracked with in vitro and in vivo cross-calibrations and by scans of calibration phantoms across instruments and clinical sites. DXA scans were conducted at baseline and at years 3, 6, and 9 during the WHI follow-up.(24)
Hip structural geometry
The hip structural analysis (HSA) software employs a principle first described by Martin and Burr that a line of pixel values in a bone-mass image is a projection of the mineral in the cross section;details on the measurement method have been published previously.(25) The HSA program uses DXA hip scans to compute conventional BMD, bone outer diameter (OD), cross-sectional areas (CSA), cortical thickness (CT), and location of the center of mass of each cross-section, as well as femur neck length and neck shaft angle for femoral neck, intertrochanter, and femur shaft regions. These parameters are measured directly from the mass profiles, but an estimate of buckling ratio (BR) is also generated as an index of susceptibility to local cortical buckling under compressive loads. In addition, section modulus (SM) is also estimated from HSA as an index showing bone resistance for bending stress. Centriod is the measure of distance from the center of mass of the femoral neck/intertrochanter/shaft to the medial cortex normalized to its corresponding outer diameter. Higher BMD, CSA, CT, and SM indicate higher bone strength, whereas, in contrast, lower BR and OD are more desirable from a mechanical-strength perspective.
Archived DXA hip scans were sent to the Johns Hopkins University for HSA under the supervision of TJB. For HSA, a special phantom, provided by TJB, was scanned on the different DXA machines at the three WHI BMD centers, and scan results of this phantom were used for calibration of HSA readings from hip scans done on different models of DXA.
Genotyping
DNA genotyping was performed according to the manufacturer’s protocol at the University of California Davis Genome Center using the Illumina Bead Station 500G Golden Gate genotyping platform (Illumina, San Diego, CA, USA). In order to assess and ensure the accuracy of our SNP genotype assignments, we included a set of 38 known duplicate DNA samples on each 384-well tray. We discarded assays for any polymorphism for which the rate of error exceeded 3% on repeated assays. The overall precision of these studies was greater than 99.8% based on these duplicate samples.
African-American participants (n = 793) who had hip BMD in the upper or lower third of that of all the African-American participants were genotyped using a panel of 3072 AIMs. To ascertain the interplatform proficiency of the SNP assays, the genotyping also was done in 21 parental population controls. Of the 3072 AIMs, 2989 SNPs showed more than 99% complete typing data and agreement of parental population controls.
European and African contribution to each individual African-American participant was examined. This was done with three independent sets of more than 600 AIMs distributed throughout the genome (minimum intermarker distance 5 cM), and the European-African admixture was estimated using the bayesian clustering algorithm in the program STRUCTURE (see “Statistical Analysis”). The estimation of individual admixture with the three independent sets of markers was nearly the same (mean SD = 0.01, r2 = 0.987). The mean individual admixture proportion then was used in our assessment of the association of percent African admixture with BMD and hip structural geometry from HSA.
Measurements on other covariates
Questionnaires were used at baseline and follow-up to collect demographic, lifestyle, and health-related information, such as age, ethnicity, smoking, recreational physical activities, health insurance, and health status. Recreational physical activity was assessed by questions on the frequency and duration of several types of recreational activity, and metabolic equivalent task (MET) scores (defined as the ratio of work metabolic rate to a standard resting metabolic rate, with 1 MET roughly equivalent to the resting metabolism while sitting quietly) were computed as the product of days per week, minutes per day, and MET value for each activity.(26) Weight was measured to the nearest 0.1 kg on a balance-beam scale with the participant dressed in indoor clothing without shoes. Height was measured to the nearest 0.1 cm using a wall-mounted stadiometer. Body mass index (BMI) was calculated as weight (kg)/height2 (m).
Statistical analysis
Admixture analyses were performed using the model-based nonhierarchical clustering approach applied in the STRUCTURE program (Version 2.1, University of Chicago, Chicago, IL, USA; http://pritch.bsd.uchicago.edu/structure.html).(27,28) The STRUCTURE analyses were performed without any prior population assignment, employed the same parameters as analyses described previously,(29) and used 100,000 replicates and 100,000 burn-in cycles. Genotypes from 80 European and 80 sub-Saharan African subjects were included in the analyses, as described previously.(29,30) For each analysis, we conducted three independent runs, and each demonstrated nearly identical results under these parameters. In addition, almost identical results were obtained with principal-components analyses (PCA) using the EIGENSTRAT software (Harvard Medical School, Boston, MA, USA).(31) Based on the admixture results, African Americans were classified into three groups in the analysis: less than 50%, 50% to 75%, or more than 75% of African admixture. This grouping was used in the descriptive analysis and the cross-sectional data analysis.
Self-reported non-Hispanic whites were used as the comparison group. WHI participants who had at least one measurement of HSA were included in this study. In the descriptive analysis, baseline characteristics including age, weight, height, and health status were compared across the admixture groups. Simple linear regression was conducted for continuous variables. The chi-square test was used for categorical variables, and Fisher’s exact test was used when the cell size was less than 5. Multiple linear regression analysis also was used to compare the differences in hip structural geometry from HSA at baseline and the differences in annual changes of hip structural geometry between baseline and year 6 across the groups. Age and body weight were adjusted for in different linear regression analysis models. Percent differences in selected baseline HSA variables between African admixture groups and non-Hispanic whites were computed, and the level of significance of these differences was tested using linear regression analysis.
Longitudinal data analysis was conducted among African-American women using the mixed-effects model. First, the percent of African admixture was used as a continuous variable to examine its effect on baseline measures as well as the slope of changes of these measurements at different time points during the follow-up. Mixed-effects models also were developed to test longitudinal differences between non-Hispanic whites and African-American groups (non-Hispanic whites as the reference group versus each of the three African-American groups: less than 50%, 50% to 75%, and more than 75% African admixture). Linear contrast was used to test whether the three African-American groups had a different rate of change in BMD and hip structural geometry in comparison with non-Hispanic whites. Basically, rates of change estimated by the mixed-effect models were first tested in non-Hispanic whites; if change did happen (coefficients of estimates are not equal to 0), each African group was compared with non-Hispanic whites to test racial difference in rates of change.
Testing for confounding was done in the cross-sectional and longitudinal models. Possible confounding factors, based on previous studies, were examined one by one for their contributions to the change in regression coefficients. A 10% change in the regression coefficients between with and without the covariate was used to select final covariates into the model. The analyses were done using STATA (Version 10.1, Stata Corporation, Inc., Collage Station, TX, USA).
Results
Baseline characteristics
Baseline characteristics of the participants in this study are presented in Table 1. With the exception of corticosteroid use, women with more than 75% African admixture were different (p<.05) from non-Hispanic whites in almost all the variables listed. There also were statistically significant differences between non-Hispanic whites and women with 50% to 75% African admixture in many variables besides smoking and health insurance. In contrast, African-American women with less than 50% of African admixture were very similar to non-Hispanic whites in baseline characteristics.
Table 1.
Baseline Characteristics of Study Participants
| White (reference), n = 8559 | African (<50%), n = 20 | African (50% to75%), n = 173 | African (>75%), n = 600 | |
|---|---|---|---|---|
| Age (years) | 63.9 ± 7.3 | 64.0 ± 6.7 | 62.6 ± 7.48a | 61.1 ± 7.3a |
| Height (cm) | 161.8 ± 6.3 | 162.4 ± 3.8 | 162.6 ± 6.4a | 162.6 ± 6.0a |
| Weight (kg) | 72.3 ± 15.4 | 77.3 ± 17.4a | 80.2 ± 19.7a | 85.3 ± 20.3a |
| Smoking | a | |||
| Never smoked | 4526 (53.6%) | 9 (47.4%) | 92 (54.4%) | 335 (57.6%) |
| Ex-smoker | 3288 (38.9%) | 9 (47.4%) | 59 (34.9%) | 187 (32.1%) |
| Current smoker | 634 (7.5%) | 1 (5.3%) | 18 (10.7%) | 60 (10.3%) |
| Insurance | a | a | a | |
| No | 8208 (96.5%) | 15 (83.3%) | 160 (93.8%) | 519 (88.4%) |
| Yes | 295 (3.5%) | 3 (16. 7%) | 11 (6.4%) | 68 (11.6%) |
| Parent broke hip After 40 | a | a | ||
| No | 4746 (80.5%) | 9 (69.2%) | 128 (92.8%) | 404 (94.4%) |
| Yes | 1148 (19.5%) | 4 (30.8%) | 10 (7.3%) | 24 (5.6%) |
| Donť know | 3 (0.1%) | 0 (0%) | 0 (0%) | 0 (0%) |
| Fracture on/after age 55 | a | a | ||
| No | 4782 (80.9%) | 16 (88. 9%) | 115 (91.3%) | 373 (92. 6%) |
| Yes | 1129 (19.1%) | 2 (11.1%) | 11 (8.7%) | 30 (7.4%) |
| Corticosteroid use | a | |||
| No | 8491 (99.2%) | 19 (100%) | 168 (97. 7%) | 584 (99.0%) |
| Yes | 68 (0.8%) | 0 (0%) | 4 (2.3%) | 6 (1.0%) |
| General health | a | a | ||
| Excellent | 1376 (16.2%) | 2 (10.5%) | 9 (5. 3%) | 17 (2.9%) |
| Very good | 3344 (39.3%) | 5 (26.3%) | 51 (29.8%) | 109 (18.5%) |
| Good | 3002 (35.3%) | 7 (36.8%) | 75 (43.9%) | 276 (46.7%) |
| Fair/poor | 793 (9.3%) | 5 (26.3%) | 36 (21.1%) | 187 (31.8%) |
| Physical activity (METs) | a | a | ||
| 0 (inactive) | 1253 (16.6%) | 3 (15.8%) | 43 (26.4%) | 160 (29.1%) |
| <5 | 1637 (21.7%) | 9 (47.4%) | 45 (27.6%) | 168 (30.6%) |
| 5 to 12 | 1778 (23.5%) | 3 (15.8%) | 42 (25.8%) | 119 (21.7%) |
| ≥12 | 2888 (38.2%) | 4 (21.1%) | 33 (20.3%) | 102 (18.6%) |
| Diabetes treatment | a | a | ||
| No | 8210 (96.1%) | 17 (89.5%) | 148 (86.1%) | 487 (82.5%) |
| Yes | 337 (3.9%) | 2 (10.5%) | 24 (14.0%) | 103 (17.5%) |
p < .05 versus non-Hispanic whites. Comparisons were tested using simple linear regression models for continuous variables, and chi-square tests were used for categorical variables. If the size of any one cell was less than 5, Fisher’s exact tests were used instead. Self-reported African Americans were divided into three groups: <50%, 50% to 75%, and >75% of African admixture as assessed by analysis of AIMs.
The association between African admixture and hip structural geometry
Compared with non-Hispanic white women, women with higher African admixture had larger BMD, CSA, SM, CT, and centriod values (Table 2) but a smaller BR in all three regions. Adjusting for age alone or both age and weight did not change the associations for the femoral neck region and showed only small changes for the other two regions (data not shown).
Table 2.
Hip Geometric Measurements in Three Regions at Baseline by Ethnicity (Angles, Neck Length, Centriod, CSA, CT, Total-Hip BMD)
| White (reference), n = 8206 | African (<50%), n = 19 | African (50% to 75%), n = 162 | African (>75%), n = 558 | |
|---|---|---|---|---|
| Total hip BMD (g/cm2) | 0.83 ± 0.13 | 0.86 ± 0.19 | 0.92 ± 0.2a | 0.96 ± 0.19a |
| Neck length (cm) | 4.70 ± 0.54 | 4.85 ± 0.46 | 4.78 ± 0.5a | 4.78 ± 0.54a |
| Neck-shaft angle | 130.7 ± 5.0 | 129.8 ± 5.1 | 130.7 ± 5.9 | 129.8 ± 5.0a |
| Femoral neck | ||||
| BMD (g/cm2) | 0.70 ± 0.13 | 0.73 ± 0.15 | 0.77 ± 0.17a | 0.80 ± 0.17a |
| CSA (cm2) | 2.02 ± 0.36 | 2.10 ± 0.44 | 2.20 ± 0.48a | 2.30 ± 0.50a |
| Outer diameter (cm) | 3.02 ± 0.22 | 3.02 ± 0.26 | 3.00 ± 0.20 | 3.01 ± 0.22 |
| Section modulus (cm3) | 0.91 ± 0.19 | 0.94 ± 0.25 | 0.97 ± 0.23a | 1.03 ± 0.27a |
| Cortical thickness (cm) | 0.13 ± 0.03 | 0.14 ± 0.03 | 0.15 ± 0.03a | 0.15 ± 0.03a |
| Buckling ratio | 12.71 ± 2.94 | 12.39 ± 2.94 | 11.63 ± 3.04 | 11.10 ± 2.93a |
| Centriod (cm) | 0.457 ± 0.016 | 0.451 ± 0.017 | 0.459 ± 0.014a | 0.461 ± 0.015a |
| Intertrochanter | ||||
| BMD (g/cm2) | 0.71 ± 0.13 | 0.73 ± 0.18 | 0.77 ± 0.19a | 0.81 ± 0.19a |
| CSA (cm2) | 3.44 ± 0.64 | 3.51 ± 0.87 | 3.70 ± 0.90a | 3.85 ± 0.93a |
| Outer diameter (cm) | 5.11 ± 0.34 | 5.07 ± 0.38 | 5.04 ± 0.37 | 5.03 ± 0.35a |
| Section modulus (cm3) | 2.87 ± 0.61 | 2.88 ± 0.75 | 2.96 ± 0.75a | 3.07 ± 0.80a |
| Cortical thickness (cm) | 0.29 ± 0.06 | 0.29 ± 0.08 | 0.31 ± 0.08a | 0.32 ± 0.08a |
| Buckling ratio | 10.51 ± 2.4 | 10.68 ± 3.26 | 9.78 ± 2.96a | 9.40 ± 2.76a |
| Centriod (cm) | 0.436 ± 0.017 | 0.434 ± 0.019 | 0.436 ± 0.017 | 0.436 ± 0.017 |
| Shaft | ||||
| BMD (g/cm2) | 1.14 ± 0.18 | 1.13 ± 0.28 | 1.18 ± 0.24a | 1.22 ± 0.23a |
| CSA (cm2) | 3.09 ± 0.50 | 3.1 ± 0.78 | 3.16 ± 0.64 | 3.3 ± 0.66a |
| Outer diameter (cm) | 2.86 ± 0.19 | 2.89 ± 0.18 | 2.83 ± 0.20 | 2.85 ± 0.19 |
| Section modulus (cm3) | 1.62 ± 0.29 | 1.64 ± 0.39 | 1.62 ± 0.35 | 1.7 ± 0.37a |
| Cortical thickness (cm) | 0.41 ± 0.08 | 0.4 ± 0.12 | 0.42 ± 0.11a | 0.44 ± 0.10a |
| Buckling ratio | 3.75 ± 0.92 | 3.99 ± 1.21 | 3.63 ± 1.06 | 3.48 ± 0.98a |
| Centriod (cm) | 0.496 ± 0.011 | 0.497 ± 0.013 | 0.496 ± 0.011 | 0.498 ± 0.010a |
Crude means were compared using linear regression models in the table.
p < .05 (compared with the reference group, non-Hispanic whites).
Interestingly, outer diameter was similar across all groups with different African admixture. Figure 1 presents the age-adjusted percent differences between the non-Hispanic white and African admixture groups in HSA measurements. A linear trend in the association of larger African admixture and larger group differences in BMD and other HSA-derived measurements was observed, suggesting stronger hip structural geometry in women with a higher percent African admixture in the cross-sectional observation.
Fig. 1.
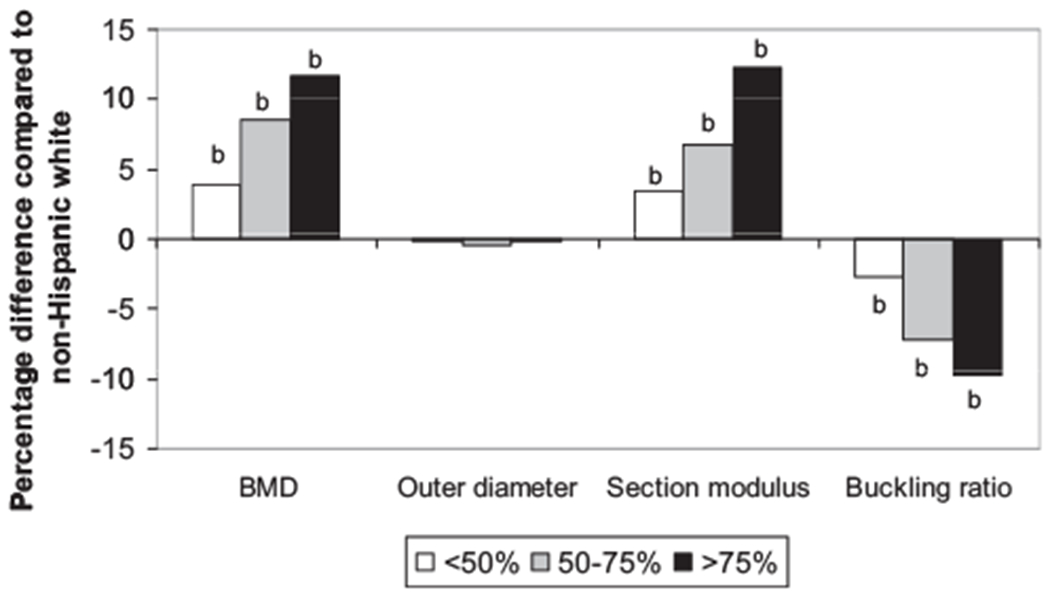
Relative percentage differences in hip geometry measurements (age-adjusted) compared with non-Hispanic whites at baseline. Each bar represents a relative percentage difference in a group of African admixture compared with non-Hispanic whites. Statistically significant levels of the difference between each of the African admixture groups and the non-Hispanic group were assessed using a linear regression model.bp < .01.
However, longitudinally, loss of bone density and reduction in bone strength, indicated from hip structural geometry measurements, seemed greater in women with a higher percent of African admixture (Table 3). For example, the mean (±SD) annual percent change in total hip BMD was —0.01% (±0.90%) in non-Hispanic white women, −0.21% (±0.89%) in African Americans with 50% or less African admixture, —0.27% (±0.78%) in women with 50% to 75% African admixture, and —0.35% (±0.84%) in women with more than 75% African admixture. Adjusting for age or age and weight did not change the findings significantly (data not shown).
Table 3.
Annual Percent Difference in Hip Geometric Measurement From Baseline to Year 6
| White (reference), n = 5274 | African (<50%), n = 15 | African (50% to 75%), n = 114 | African (>75%), n = 371 | |
|---|---|---|---|---|
| Total hip BMD | −0.01 ± 0.90 | −0.21 ± 0.89 | −0.27 ± 0.78b | −0.35 ± 0.84b |
| Neck length (cm) | −0.001 ± 1.62 | −0.017 ± 1.11 | −0.245 ± 1.52 | −0.179 ± 1.84a |
| Neck-shaft angle | 0.04 ± 0.55 | 0.09 ± 0.47 | 0.02 ± 0.61 | 0.05 ± 0.55b |
| Femoral neck | ||||
| BMD (g/cm2) | 0.03 ± 1.56 | 0.04 ± 1.24 | −0.44 ± 1.54b | −0.35 ± 1.84b |
| CSA (cm2) | 0.23 ± 1.60 | 0.38 ± 1.12 | −0.13 ± 1.56a | −0.10 ± 2.17b |
| Outer diameter (cm) | 0.21 ± 0.79 | 0.35 ± 0.43 | 0.33 ± 0.63 | 0.25 ± 0.96 |
| Section modulus (cm3) | 0.67 ± 2.27 | 0.90 ± 1.23 | 0.26 ± 2.02 | 0.18 ± 2.78a |
| Cortical thickness (cm) | 0.03 ± 1.65 | 0.04 ± 1.3 | −0.48 ± 1.62b | −0.37 ± 1.94b |
| Buckling ratio | 0.44 ± 2.34 | 0.35 ± 1.78 | 1.16 ± 2.20b | 0.99 ± 2.50b |
| Centriod (cm) | −0.046 ± 0.541 | 0.130 ± 0.321 | −0.132 ± 0.354 | −0.065 ± 0.563 |
| Intertrochanter | ||||
| BMD (g/cm2) | 0.03 ± 1.41 | 0.52 ± 1.28 | −0.32 ± 1.39a | −0.32 ± 1.82b |
| CSA (cm2) | 0.30 ± 1.35 | 0.74 ± 1.17 | 0.03 ± 1.34a | 0.01 ± 1.79b |
| Outer diameter (cm) | 0.30 ± 0.69 | 0.23 ± 0.47 | 0.37 ± 0.52 | 0.35 ± 0.62 |
| Section modulus (cm3) | 0.66 ± 1.78 | 0.84 ± 1.68 | 0.46 ± 1.63 | 0.39 ± 2.13b |
| Cortical thickness (cm) | 0.18 ± 1.52 | 0.64 ± 1.41 | −0.16 ± 1.47a | −0.19 ± 1.92b |
| Buckling ratio | 0.32 ± 1.88 | −0.14 ± 1.9 | 0.75 ± 1.86a | 0.83 ± 2.23b |
| Centriod (cm) | −0.046 ± 0.432 | −0.085 ± 0.398 | −0.010 ± 0.371 | −0.062 ± 0.513 |
| Shaft | ||||
| BMD (g/cm2) | 0.28 ± 1.34 | 0.58 ± 1.32 | 0.01 ± 1.51a | −0.09 ± 1.68b |
| CSA (cm2) | 0.41 ± 1.25 | 0.67 ± 1.11 | 0.20 ± 1.54 | 0.15 ± 1.71b |
| Outer diameter (cm) | 0.14 ± 0.57 | 0.11 ± 0.48 | 0.20 ± 0.45 | 0.24 ± 0.52b |
| Section modulus (cm3) | 0.76 ± 1.58 | 0.97 ± 1.73 | 0.45 ± 1.91a | 0.41 ± 2.18b |
| Cortical thickness (cm) | 0.34 ± 1.66 | 0.79 ± 1.65 | 0.01 ± 1.85a | −0.10 ± 2.10b |
| Buckling ratio | 0.00 ± 2.07 | −0.60 ± 1.91 | 0.44 ± 2.21a | 0.66 ± 2.41b |
| Centriod (cm) | 0.053 ± 0.283 | 0.044 ± 0.326 | 0.015 ± 0.263 | 0.002 ± 0.283a |
Crude means of African groups were compared with non-Hispanic whites using linear regression models in the table.
p < .05.
p < .01.
Mixed-effects models were used to examine longitudinal changes from baseline to years 3 and 6 in the HSA measurements. Results from mixed-effects models further confirmed the association between higher African admixture (as a continuous variable) and faster rate of loss in bone density and bone strength (data not shown).
Figure 2 shows patterns of longitudinal changes in BMD and hip structural geometry in non-Hispanic whites and the three African-American groups. These plots are based on results from random coefficient models. Covariates included in the models were age, weight, corticosteroid use, physical activity, diabetic treatments, hormone use, randomization status in the hormone trial, and self-reported general health. A faster rate of change from baseline to year 6 was observed in almost all the HSA measurements among women with 50% or more African admixture when they were compared with non-Hispanic white women using linear contrast. Interestingly, the results also show that even with a faster rate of loss in bone strength among women with African admixture, the association between greater bone strength and higher percent African admixture was consistent during the 6-year follow-up.
Fig. 2.

Longitudinal change in hip geometric structure from baseline to year 6 based on random coefficient models. Age, weight, corticosteroid use, physical activity, and diabetes treatment were adjusted in the models.
To explore whether the observed results are due to the confounding effect of medication use, in the liner regression and mixed-effects models, we tested the effect of use of thiazide diuretics, estrogen, calcitonin, bisphosphonates, and teriparatide. None of these variables significantly altered the results when they were added to the models; hence the models presented in this article did not include these additional covariates.
Discussion
Significant ethnic differences in risk of osteoporosis, including differences in bone density and fracture risk, are well known. Studies have consistently found lower fracture rates in African-American women.(32) However, a notable limitation of most of the previous studies is that the classification of African Americans was based on self-reported race categories.(33,34) making it unclear how the amount of African heritage contributes to the observed lower fracture risk.
Our findings on the cross-sectional relationship between BMD and genetic admixture are consistent with the only previous publication among older African-American men and women, which has shown a significant association between higher African admixture and higher BMD at the femoral neck and lumbar spine sites.(11) Our study is the first to show that African-American women with a higher percent of African admixture also have a better hip structural geometry in comparison with non-Hispanic white women. The relationship between increased percent African admixture and better hip structural geometry is linear, suggesting significant contributions of genetic variations to the observed racial difference in osteoporosis risk.
The findings from our study also indicate that results observed in previously published studies may have depended on the percentage of African admixture within the study population. The racial differences in fracture risk reported between African Americans and non-Hispanic whites have relied on self-reported African-American ancestry, in which those with a low percent of African admixture are likely to have had similar bone structural geometry to non-Hispanic whites. The positive relationship between higher bone density, better hip structural geometry, and greater African admixture found in this study is in agreement with previous studies showing low fracture risk in African Americans.(33,34)
Interestingly, our study found that there were no advantages in rate of change in bone density and hip structural geometry for women with higher African admixture;in fact, the rate of loss in bone strength, as indicated by both bone density and hip structural geometry, is greater in women with 50 percent or more African admixture than that of non-Hispanic white women. Nevertheless, benefiting from their high peak bone mass and strength, even with a greater loss in bone density and greater change in hip structural geometry with older age, African-American postmenopausal women still have stronger bones than non-Hispanic white women at any time point of the follow-up in our study. The observed greater loss in bone density and bone strength with increased African admixture could not be explained by use of diabetic treatments, weight change, or use of bone-related medications.
Our results suggest that two components of bone strength appear to track differently depending on the percent African admixture. Peak bone strength may be greater in women with a higher percentage African admixture, but the rate of bone loss also appears to be greater. In contrast to our findings in African-American women, several prior studies in African-American men and women reported a slower rate of bone loss in African Americans than in whites.(35–37) However, all these prior studies used self-reported African origin, whereas our findings are based on an admixture analysis, which may help to explain the discrepancy in findings between our study and previous studies.
If the finding of a faster rate of loss in bone strength in women with higher African admixture can be confirmed by future research, it will have significant implications for osteoporosis prevention and management in African Americans. Although the opportunity for preventing bone loss is great, African Americans are less likely to have osteoporosis screening(38) or to receive osteoporosis medications in comparison with non-Hispanic whites who are at the same level of risk for osteoporosis.(39) These findings have suggested that African-American women who have relatively low bone strength in the perimenopausal period actually may be at higher risk of fracture as they age than women of European ancestry. Many chronic diseases, such as chronic obstructive pulmonary diseases (COPD), diabetes, and rheumatoid arthritis (RA), increase an individual’s risk for osteoporosis.(40–42) African Americans with COPD(43) or RA(44) may have similar increased risk for osteoporosis to that of European Americans. The African-American women in our study were younger, but they had poorer health and a higher rate of diabetes. The increased rate of loss in bone strength in women with high African admixture potentially results from a combination of a high prevalence of other chronic diseases and/or a lack of osteoporosis prevention efforts in these African-American women. Studies to understand the causes for this higher rate of loss in bone strength in this group are warranted, and changes in clinical practices may be considered to help African Americans better maintain their bone strength and low fracture risk in later age.
This study had no direct bone-strength measurement, and bone strength was assessed using HSA, which was derived from 2D DXA images. However, despite the limitations of the HSA measurements, these HSA parameters have been shown to be significantly correlated with fracture risk in previous studies, including our own work,(45–47) supporting the utility of HSA measurements as a proxy for bone strength. In this study, admixture was assessed only in self-reported African Americans, not in non-Hispanic whites;hence the study findings may be biased by the failure to measure admixture in non-Hispanic whites. However, the direction of the bias in this study cannot be assessed. In addition to these limitations, this study has only a small number (n = 20) of African-American women with a low percent(<50%) of African admixture. This may have affected our ability to investigate the relationship between the full range of African admixture and bone strength. It also should be noted that this study did not assess environmental factors that could be associated with admixture and thus cannot exclude nongenetic differences. However, the linear relationship between African admixture and bone strength has provided further support to the role of African heritage in risk of osteoporosis, and the finding is encouraging for continuing studies to identify genes contributing to bone strength.
Our study has many strengths, such as use of DXA scans for assessing BMD and HSA and the use of standard DXA quality-control procedures across different WHI centers. Other strengths include use of well-established ancestry informative markers, both cross-sectional and longitudinal data analysis, rich information on potential confounding factors, and large samples sizes for self-reported African Americans and non-Hispanic whites.
In summary, higher bone density and greater bone strength in older African-American women are associated with higher sub-Saharan African admixture. African-American women with higher African admixture have a greater rate of bone loss, but their strength advantages relative to European population groups are still evident in later life; hence these advantages most likely are due to their significantly higher peak bone mass. Our findings further suggest that genetics may contribute more to peak bone mass and environmental factors may play a major role in the rate of bone loss in older age. Future studies are needed to identify genetic factors that contribute to high bone strength in people with African heritage and to investigate the causes for the observed elevated rate of loss in bone strength among African-American women with a high percent of African admixture. A better understanding of factors responsible for increased bone strength should result from further investigations of genetic factors responsible for the racial differences in fracture risk.
Acknowledgments
Short list of WHI investigators: Program office: National Heart, Lung, and Blood Institute, Bethesda, MD, USA: Elizabeth Nabel, Jacques Rossouw, Shari Ludlam, Linda Pottern, Joan McGowan, Leslie Ford, and Nancy Geller. Clinical coordinating centers: Fred Hutchinson Cancer Research Center, Seattle, WA, USA: Ross Prentice, Garnet Anderson, Andrea LaCroix, Charles L Kooperberg, Ruth E Patterson, Anne McTiernan;Wake Forest University School of Medicine, Winston-Salem, NC, USA: Sally Shumaker;Medical Research Labs, Highland Heights, KY, USA: Evan Stein; University of California San Francisco, San Francisco, CA: Steven Cummings. Clinical centers: Albert Einstein College of Medicine, Bronx, NY, USA: Sylvia Wassertheil-Smoller; Baylor College of Medicine, Houston, TX, USA: Jennifer Hays; Brigham and Women’s Hospital, Harvard Medical School, Boston, MA, USA: JoAnn Manson; Brown University, Providence, RI, USA: Annlouise R Assaf; Emory University, Atlanta, GA, USA: Lawrence Phillips; Fred Hutchinson Cancer Research Center, Seattle, WA, USA: Shirley Beresford; George Washington University Medical Center, Washington, DC, USA: Judith Hsia; Los Angeles Biomedical Research Institute at Harbor-UCLA Medical Center, Torrance, CA, USA: Rowan Chlebowski; Kaiser Permanente Center for Health Research, Portland, OR, USA: Evelyn Whitlock; Kaiser Permanente Division of Research, Oakland, CA, USA: Bette Caan; Medical College of Wisconsin, Milwaukee, WI, USA: Jane Morley Kotchen; MedStar Research Institute/Howard University, Washington, DC, USA: Barbara V Howard; Northwestern University, Chicago-Evanston, IL, USA: Linda Van Horn; Rush Medical Center, Chicago, IL, USA: Henry Black; Stanford Prevention Research Center, Stanford, CA, USA: Marcia L Stefanick; State University of New York at Stony Brook, Stony Brook, NY, USA: Dorothy Lane (Ohio State University, Columbus, OH, USA: Rebecca Jackson; University of Alabama at Birmingham, Birmingham, AL, USA: Cora E Lewis; University of Arizona, Tucson-Phoenix, AZ, USA: Tamsen Bassford; University at Buffalo, Buffalo, NY, USA: Jean Wactawski-Wende; University of California Davis, Sacramento, CA, USA: John Robbins; University of California Irvine, Irving, CA, USA: F Allan Hubbell; University of California Los Angeles, Los Angeles, CA, USA: Howard Judd; University of California San Diego, LaJolla-Chula Vista, CA, USA: Robert D Langer; University of Cincinnati, Cincinnati, OH, USA: Margery Gass; University of Florida, Gainesville-Jacksonville, FL, USA: Marian Limacher; University of Hawaii, Honolulu, HI, USA: David Curb; University of Iowa, Iowa City-Davenport, IA, USA: Robert Wallace; University of Massachusetts Fallon Clinic, Worcester, MA, USA: Judith Ockene; University of Medicine and Dentistry of New Jersey, Newark, NJ, USA: Norman Lasser; University of Miami, Miami, FL, USA: Mary Jo O’Sullivan;University of Minnesota, Minneapolis, MN, USA: Karen Margolis; University of Nevada, Reno, NV, USA: Robert Brunner; University of North Carolina, Chapel Hill, NC, USA: Gerardo Heiss; University of Pittsburgh, Pittsburgh, PA, USA: Lewis Kuller;University of Tennessee, Memphis, TN, USA: Karen C Johnson; University of Texas Health Science Center, San Antonio, TX, USA: Robert Brzyski; University of Wisconsin, Madison, WI, USA: Gloria E Sarto; Wake Forest University School of Medicine, Winston-Salem, NC, USA: Denise Bonds; Wayne State University School of Medicine/Hutzel Hospital, Detroit, MI, USA: Susan Hendrix.
This work was supported by the National Institute of Arthritis and Musculoskeletal and Skin Diseases, Department of Health and Human Services, Grant No. R01 AR049411 (Longitudinal Changes in Hip Geometry and Skeletal Muscle Study) and the National Institutes of Health NHLBI BAA Contract No. HHSN268200764319C. The WHI program is funded by the National Heart, Lung and Blood Institute, US Department of Health and Human Services.
Authors’ roles: Z Chen contributed to the conception and design of the study; data collection, analysis, and interpreting the findings; and drafting and finalizing the manuscript. She is responsible for the integrity of the data analysis. LQi contributed to data analysis, interpreting the findings, and drafting and critical review of the manuscript. TJ Beck contributed to data collection, interpreting the findings, and critical review of the manuscript. J Robbins contributed to study design, data collection, interpreting the findings, and critical review of the manuscript. G Wu contributed to data analysis, interpreting the findings, and drafting the manuscript. CE Lewis contributed to data collection and critical review of the manuscript. JA Cauley contributed to data collection and critical review of the manuscript. NC Wright contributed to data analysis, quality control, and critical review of the manuscript. MF Sedin contributed to data collection, data analysis, interpreting the findings, and drafting and critical review of the manuscript. All authors approved the final version of the submitted manuscript. We thank all the WHI investigators for their contribution to the WHI recruitment and data collection.
Footnotes
Disclosures
All the authors state that they have no conflicts of interest.
References
- 1.Barrett-Connor E, Siris ES, Wehren LE, et al. Osteoporosis and fracture risk in women of different ethnic groups. J Bone Miner Res. 2005;20: 185–194. [DOI] [PubMed] [Google Scholar]
- 2.Melton IL, Marquez MA, Achenbach SJ, et al. Variations in bone density among persons of African heritage. Osteoporos Int. 2002; 13:551–559. [DOI] [PubMed] [Google Scholar]
- 3.Cauley JA, Wu L, Wampler NS, et al. Clinical risk factors for fractures in multi-ethnic women: the Women’s Health Initiative. J Bone Miner Res. 2007;22:1816–1826. [DOI] [PubMed] [Google Scholar]
- 4.Peacock M, Buckwalter KA, Persohn S, Hangartner TN, Econs MJ, Hui S. Race and sex differences in bone mineral density and geometry at the femur. Bone. 2009;45:218–225. [DOI] [PMC free article] [PubMed] [Google Scholar]
- 5.Nelson DA, Beck TJ, Wu G, et al. Ethnic differences in femur geometry in the women’s health initiative observational study. Osteoporos Int. 2011;22:1377–1388. [DOI] [PubMed] [Google Scholar]
- 6.Bryant RJ, Wastney ME, Martin BR, et al. Racial differences in bone turnover and calcium metabolism in adolescent females. J Clin Endocrinol Metab. 2003;88:1043–1047. [DOI] [PubMed] [Google Scholar]
- 7.Finkelstein JS, Lee ML, Sowers M, et al. Ethnic variation in bone density in premenopausal and early perimenopausal women: effects of anthropometric and lifestyle factors. J Clin Endocrinol Metab. 2002;87: 3057–3067. [DOI] [PubMed] [Google Scholar]
- 8.Kleerekoper M, Nelson DA, Peterson EL, et al. Reference data for bone mass, calciotropic hormones, and biochemical markers of bone remodeling in older (55–75) postmenopausal white and black women. J Bone Miner Res. 1994;9:1267–1276. [DOI] [PubMed] [Google Scholar]
- 9.Wang X, Kammerer CM, Wheeler VW, Patrick AL, Bunker CH, Zmuda JM. Genetic and environmental determinants of volumetric and areal BMD in multi-generational families of African ancestry: the Tobago Family Health Study. J Bone Miner Res. 2007;22:527–536. [DOI] [PubMed] [Google Scholar]
- 10.Zmuda JM, Yerges LM, Kammerer CM, et al. Association analysis of WNT10B with bone mass and structure among individuals of African ancestry. J Bone Miner Res. 2009;24:437–447. [DOI] [PMC free article] [PubMed] [Google Scholar]
- 11.Shaffer JR, Kammerer CM, Reich D, et al. Genetic markers for ancestry are correlated with body composition traits in older African Americans. Osteoporos Int. 2007;18:733–741. [DOI] [PubMed] [Google Scholar]
- 12.Cavalli-Sforza LL, Menozzi P, Piazza A. The history and geography of human genes, Abridged paperback ed. Princeton NJ: Princeton University Press, 1996: pp xiii–413. [Google Scholar]
- 13.Collins-Schramm HE, Phillips CM, Operario DJ, et al. Ethnic-difference markers for use in mapping by admixture linkage disequilibrium. Am J Hum Genet. 2002;70:737–750. [DOI] [PMC free article] [PubMed] [Google Scholar]
- 14.Collins-Schramm HE, Chima B, Morii T, et al. Mexican American ancestry-informative markers: examination of population structure and marker characteristics in European Americans, Mexican Americans, Amerindians and Asians. Hum Genet. 2004;114:263–271. [DOI] [PubMed] [Google Scholar]
- 15.Smith MW, Lautenberger JA, Shin HD, et al. Markers for mapping by admixture linkage disequilibrium in African American and Hispanic populations. Am J Hum Genet. 2001;69:1080–1094. [DOI] [PMC free article] [PubMed] [Google Scholar]
- 16.Smith MW, Patterson N, Lautenberger JA, et al. A high-density admixture map for disease gene discovery in african americans. Am J Hum Genet. 2004;74:1001–1013. [DOI] [PMC free article] [PubMed] [Google Scholar]
- 17.Tian C, Hinds DA, Shigeta R, Kittles R, Ballinger DG, Seldin MF. A genomewide single-nucleotide-polymorphism panel with high ancestry information for african american admixture mapping. Am J Hum Genet. 2006;79:640–649. [DOI] [PMC free article] [PubMed] [Google Scholar]
- 18.Tian C, Hinds DA, Shigeta R, et al. A genomewide single-nucleotide-polymorphism panel for Mexican American admixture mapping. Am J Hum Genet. 2007;80:1014–1023. [DOI] [PMC free article] [PubMed] [Google Scholar]
- 19.Mao X, Bigham AW, Mei R, et al. A genomewide admixture mapping panel for Hispanic/Latino populations. Am J Hum Genet. 2007;80: 1171–1178. [DOI] [PMC free article] [PubMed] [Google Scholar]
- 20.Price AL, Patterson N, Yu F, et al. A genomewide admixture map for Latino populations. Am J Hum Genet. 2007;80:1024–1036. [DOI] [PMC free article] [PubMed] [Google Scholar]
- 21.Rosenberg NA, Pritchard JK, Weber JL, et al. Genetic structure of human populations. Science. 2002;298:2381–2385. [DOI] [PubMed] [Google Scholar]
- 22.Nassir R, Kosoy R, Tian C, et al. An ancestry informative marker set for determining continental origin: validation and extension using human genome diversity panels. BMC Genet. 2009;10:39. [DOI] [PMC free article] [PubMed] [Google Scholar]
- 23.Parra EJ, Marcini A, Akey J, et al. Estimating African American admixture proportions by use of population-specific alleles. Am J Hum Genet. 1998;63:1839–1851. [DOI] [PMC free article] [PubMed] [Google Scholar]
- 24.Design of the Women’s Health Initiative clinical trial and observational study. The Women’s Health Initiative Study Group. Control Clin Trials. 1998;19:61–109. [DOI] [PubMed] [Google Scholar]
- 25.Martin RB, Burr DB. Non-invasive measurement of long bone cross-sectional moment of inertia by photon absorptiometry. J Biomech. 1984;17:195–201. [DOI] [PubMed] [Google Scholar]
- 26.Ainsworth BE, Haskell WL, Leon AS, et al. Compendium of physical activities: classification of energy costs of human physical activities. Med Sci Sports Exerc. 1993;25:71–80. [DOI] [PubMed] [Google Scholar]
- 27.Pritchard JK, Stephens M, Donnelly P. Inference of population structure using multilocus genotype data. Genetics. 2000;155:945–959. [DOI] [PMC free article] [PubMed] [Google Scholar]
- 28.Falush D, Stephens M, Pritchard JK. Inference of population structure using multilocus genotype data: linked loci and correlated allele frequencies. Genetics. 2003;164:1567–1587. [DOI] [PMC free article] [PubMed] [Google Scholar]
- 29.Kosoy R, Nassir R, Tian C, et al. Ancestry informative marker sets for determining continental origin and admixture proportions in common populations in America. Hum Mutat. 2009;30: 69–78. [DOI] [PMC free article] [PubMed] [Google Scholar]
- 30.Chung SA, Tian C, Taylor KE, et al. European population substructure is associated with mucocutaneous manifestations and autoantibody production in systemic lupus erythematosus. Arthritis Rheum. 2009; 60:2448–2456. [DOI] [PMC free article] [PubMed] [Google Scholar]
- 31.Patterson N, Price AL, Reich D. Population Structure and Eigenanalysis. PLoS Genet. 2006;2:e190. [DOI] [PMC free article] [PubMed] [Google Scholar]
- 32.Aloia JF. African Americans, 25-hydroxyvitamin D, and osteoporosis: a paradox. Am J Clin Nutr. 2008;88:545S–550S. [DOI] [PMC free article] [PubMed] [Google Scholar]
- 33.Cauley JA, Palermo L, Vogt M, et al. Prevalent vertebral fractures in black women and white women. J Bone Miner Res. 2008;23:1458–1467. [DOI] [PMC free article] [PubMed] [Google Scholar]
- 34.Aloia JF, Vaswani A, Yeh JK, Flaster E. Risk for osteoporosis in black women. Calcif Tissue Int. 1996;59:415–423. [DOI] [PubMed] [Google Scholar]
- 35.Tracy JK, Meyer WA, Flores RH, Wilson PD, Hochberg MC. Racial differences in rate of decline in bone mass in older men: the Baltimore men’s osteoporosis study. J Bone Miner Res. 2005;20: 1228–1234. [DOI] [PubMed] [Google Scholar]
- 36.Cauley JA, Lui LY, Stone KL, et al. Longitudinal study of changes in hip bone mineral density in Caucasian and African-American women. J Am Geriatr Soc. 2005;53:183–189. [DOI] [PubMed] [Google Scholar]
- 37.Finkelstein JS, Brockwell SE, Mehta V, et al. Bone mineral density changes during the menopause transition in a multiethnic cohort of women. J Clin Endocrinol Metab. 2008;93:861–868. [DOI] [PMC free article] [PubMed] [Google Scholar]
- 38.Miller RG, Ashar BH, Cohen J, et al. Disparities in osteoporosis screening between at-risk African-American and white women. J Gen Intern Med. 2005;20:847–851. [DOI] [PMC free article] [PubMed] [Google Scholar]
- 39.Curtis JR, McClure LA, Delzell E, et al. Population-based fracture risk assessment and osteoporosis treatment disparities by race and gender. J Gen Intern Med. 2009;24:956–962. [DOI] [PMC free article] [PubMed] [Google Scholar]
- 40.Brown SA, Sharpless MD. Osteoporosis: an under-appreciated complication of diabetes. Clin Diabetes. 2004;22:10–20. [Google Scholar]
- 41.Kaz Kaz H, Johnson D, Kerry S, Chinappen U, Tweed K, Patel S. Fall-related risk factors and osteoporosis in women with rheumatoid arthritis. Rheumatology (Oxford). 2004;43:1267–1271. [DOI] [PubMed] [Google Scholar]
- 42.Sevenoaks MJ, Stockley RA. Chronic Obstructive Pulmonary Disease, inflammation and co-morbidity-a common inflammatory phenotype? Respir Res. 2006;7:70. [DOI] [PMC free article] [PubMed] [Google Scholar]
- 43.Li L, Brennan KJ, Gaughan JP, Ciccolella DE, Kuzma AM, Criner GJ. African Americans and men with severe COPD have a high prevalence of osteoporosis. COPD. 2008;5:291–297. [DOI] [PubMed] [Google Scholar]
- 44.Curtis JR, Arora T, Donaldson M, et al. Skeletal health among African Americans with recent-onset rheumatoid arthritis. Arthritis Rheum. 2009;61:1379–1386. [DOI] [PMC free article] [PubMed] [Google Scholar]
- 45.Kaptoge S, Beck TJ, Reeve J, et al. Prediction of incident hip fracture risk by femur geometry variables measured by hip structural analysis in the study of osteoporotic fractures. J Bone Miner Res. 2008; 23:1892–1904. [DOI] [PMC free article] [PubMed] [Google Scholar]
- 46.LaCroix AZ, Beck TJ, Cauley JA, et al. Hip structural geometry and incidence of hip fracture in postmenopausal women: what does it add to conventional bone mineral density? Osteoporos Int. 2010; 21:919–929. [DOI] [PMC free article] [PubMed] [Google Scholar]
- 47.Nelson DA, Barondess DA, Hendrix SL, Beck TJ. Cross-sectional geometry, bone strength, and bone mass in the proximal femur in black and white postmenopausal women. J Bone Miner Res. 2000;15:1992–1997. [DOI] [PubMed] [Google Scholar]