

Abstract
Purpose
Considering that ocular expansion is associated with scleral thinning, this study investigated variation in scleral thickness (anterior scleral thickness [AST] and posterior scleral thickness [PST]) in different meridians across emmetropes and a wide range of myopes.
Methods
A total of 95 participants (mean age, 24 ± 4 years) including emmetropes (spherical equivalent refractive error, ±0.75 diopters [D]; n = 20) and myopes (–1.00 to –27.25 D; n = 75) underwent ocular imaging with swept-source optical coherence tomography. All the images were analyzed using semiautomated custom-designed software to determine scleral thickness in 1-mm intervals. AST was estimated from limbus to 5 mm (n = 95), and PST from fovea to 5 mm (n = 25; high myopes only) along the horizontal and vertical meridian.
Results
The median spherical equivalent refractive error and axial length were −4.25 D (IQR, –12.50 to –1.00 D) and 25 mm (IQR, 23.72–28.35 mm), respectively. The anterior sclera was thinnest in the superior and thickest in the inferior region (475.3 ± 19.0 vs. 605.9 ± 18.6 µm; P < 0.001). The inferior AST alone decreased significantly with increasing magnitude of myopia (r = 0.27; P = 0.008). There were no differences in AST between nasal and temporal meridians (583.24 ± 15.00 vs. 587.09 ± 27.00 µm; P > 0.05). The mean subfoveal PST for the subset of high myopes was 251.7 ± 12.0 µm which was thinner than mean AST along all the meridians by more than 45%. The averaged scleral thickness peripheral to fovea (1–5 mm) was similar along different meridians (P > 0.05).
Conclusions
The relative significant thinning of the anterior sclera along the inferior meridian with increasing degree of myopia compared with the other three meridians indicates the potential role of AST, especially in the inferior meridian, to act as a marker for myopia progression.
Keywords: myopia, scleral thickness, optical coherence tomography, myopia model
Eyes with myopia are more susceptible to develop pathologic changes1,2 that could lead to visual impairment and secondary blindness in later life.3–8 Although pathologic myopia lesions are known to primarily occur at the level of retina and choroid,2 recent evidence indicates damage to the posterior sclera (thinning) is associated with high myopes owing to altered biomechanical properties of sclera.9
The introduction of anterior segment optical coherence tomography (OCT), enhanced depth imaging in spectral domain OCT, and the latest swept source OCT (SS-OCT) with better penetration capacity of light signals has enabled the measurement of anterior scleral thickness (AST) and posterior scleral thickness (PST) in vivo. Most of the studies10–16 have investigated the association of either the anterior or the PST in isolation with myopia, but not both in the same population. Scleral thinning is reported to be associated with increasing degrees of myopia, presence of staphyloma, and pathologic myopia lesions in the subfoveal region.10,14–18 Previous studies that reported peripheral AST have certain limitations in terms of the meridians investigated (temporal or nasotemporal meridians only) and included participants with –0.50 to –11.00 diopters (D) of myopic refractive errors.19,20 In addition, there is limited information about the changes in scleral thickness that occur in various locations of sclera from anterior (limbus) to the posterior (foveal) region of the myopic eye.
Various patterns of ocular expansion have been described for myopic eyes in the literature, such as posterior pole expansion,21 where a globe expands only at the posterior pole; equatorial expansion,22 where a globe expands parallel to optic axis at the equatorial level; global expansion,22 where a globe expands in all the directions; and axial expansion,23 where a globe expands both in posterior pole and equatorial directions. Atchison et al.24 reported that myopic eyes expand more in length followed by height and least in width compared with that of emmetropic eyes based on the analysis of data obtained from magnetic resonance imaging (MRI). Considering that ocular expansion is associated with thinning of outer coats of the eyeball, it is important to investigate the AST and PST across different meridians for a wide range of myopic refractive errors. This study aimed to investigate the anterior and posterior scleral thickness along horizontal and vertical meridians in emmetropes and across a wide range of axial myopes.
Methods
A total of 95 participants without any ocular or systemic conditions that could influence the refractive errors of their eyes were recruited for the study. There were 37 males and 58 females in the study and the mean age of the participants was 24 ± 4 years (range, 15–35 years). The study proposal was approved by the institutional review board of L V Prasad Eye Institute, India (LEC 09-17-084) and it adhered to the tenets of declaration of Helsinki. Appropriate written and verbal consent were obtained from all participants explaining the nature and possible consequences of the study before commencing the measurements.
All the participants underwent an initial comprehensive eye examination including a dilated fundus examination. Axial length was measured using a Lenstar LS 900 optical noncontact biometer (Haag Streit, Köniz, Switzerland), central refraction using a Shin-Nippon autorefractor (Nvision-K 5001, Tokyo, Japan), and scleral thickness with a Topcon-3 DRI Triton SS-OCT (Topcon, Tokyo, Japan). An average of three consecutive measurements were taken for the axial length, five measurements for the central refraction (target at 3 m distance), and one measurement using a single line scan protocols (line [H] Anterior seg. for AST and line [H] for PST) for determining both AST and PST. All these measurements were taken by the same examiner under normal room illumination (<250 lux).
To obtain the AST, an anterior segment module was attached in front of the objective lens of the SS-OCT. A 16-mm single line scan protocol (length, 16 mm; depth, 2.6 mm) was used to acquire raw B-scan OCT images along each of the four meridians (superior, inferior, nasal, and temporal) while the participant fixated an appropriately located target for a maximum of 5 seconds within which an image of sclera was acquired. During imaging, the line scan was placed in such a way that it passed above the scleral reflex in each gaze position for all the participants to ensure consistency in obtaining AST in the same region of interest (Fig. 1).
Figure 1.

Sequential steps involved in obtaining AST with SS-OCT. (A) Single line scan passing through the temporal scleral reflex. (B) Cropped raw B-scan image of the anterior sclera (dimension of the exported image: length of 16 mm and depth of 2.6 mm) where yellow arrowheads indicate the episcleral blood vessels and the red arrowhead indicates the location of the scleral spur (reference point). In the magnified image, the anterior scleral boundary is indicated by white arrowheads and posterior scleral boundaries by blue arrowheads. (C) Segmented OCT image obtained after analysis with custom-designed software where the yellow solid lines represent the anterior and posterior scleral boundary and the red solid lines demarcate the 1-mm intervals where scleral thickness was measured.
For PST, a 12-mm single line scan protocol (length, 12 mm; depth, 2.6 mm) was used to acquire raw B-scan OCT images along superoinferior and nasotemporal meridians, keeping the fovea at the center (participant fixating central target) such that 6 mm of sclera was included on both sides of the fovea (Fig. 2). Only those images with a signal strength of 50 or greater were used for analysis.
Figure 2.

Sequential steps involved in obtaining PST with SS-OCT. (A) En face image of the posterior coat of the eye. (B) Cropped raw B-scan image of the posterior ocular coats (dimension of exported image: length of 12 mm, depth of 2.6 mm) where the yellow arrowheads indicate the posterior boundary of the sclera and the red arrowhead indicates the fovea (the reference point). In the magnified image, the anterior scleral boundary is indicated by white arrowheads and posterior scleral boundary by blue arrowheads. (C) Segmented OCT image obtained after analysis with custom-designed software where the yellow solid lines indicate the inner and outer boundary of retina, choroid and sclera and the red solid lines demarcate the 1-mm intervals where the retinal, choroidal, and scleral thicknesses were measured.
Participants were classified into four categories based on spherical equivalent refractive (SER) error (defined as spherical power plus one-half of the cylindrical power): emmetropes (+0.75 to –0.75 D; age, 24.95 ± 2.66 years; n = 20), mild myopes (≤–1.00 to –3.00 D; age, 23.0 ± 2.8 years; n = 19), moderate myopes (≤–3.25 to –8.00 D; age, 23.63 ± 3.32 years; n = 20) and high myopes (≤–8.25 D; age, 23.3 ± 4.97 years; n = 36) to investigate the relationship between increasing degree of myopia and AST. These groups did not differ significantly in age.
The posterior sclera was not visible in any of the emmetropic, low, or moderate myopic eyes (0% of total participants included in the emmetropic, low, and moderate myopic groups), which could be attributed to their thicker choroids that significantly attenuated the OCT signal before it reached their sclera. Of all participants, the posterior sclera was visible in only 36 highly myopic eyes, of which the posterior scleral boundary could be delineated only in a subset of 25 participants with high myopia (70% of total highly myopic eyes).
Image Acquisition, Analysis, and Measurements of AST and PST
Scleral thickness was determined using a custom-designed semiautomated software developed in the Ophthalmic Engineering Lab of the L V Prasad Eye Institute. Images of only right eyes were used for the analysis of both AST and PST. Images of both anterior and posterior sclera were exported as current B-scan (display ratio) in a .jpg file format from the instrument's inbuilt IMAGEnet software. This format was selected to obtain isotropic images that are free of stretching along vertical or horizontal directions. The dimensions of the exported anterior and posterior scleral OCT images were 1024 × 165 pixels and 1024 × 437 pixels, respectively.
On the B-scan images of anterior sclera, the outer boundary was identified as a thin hyporeflective region on the anterior part of the sclera, which is an actual presentation of episcleral blood vessels that separates the episclera and conjunctiva from scleral tissue. The inner boundary is a clearly demarcated line between the hyper-reflective scleral tissue and hyporeflective ciliary body tissue. Scleral thickness is measured as the distance between the outer and inner boundaries at the point of interest (Fig. 1). The boundaries were marked manually by the examiner by selecting multiple sparse points on the boundaries that were taken as input by the software to mark the complete boundary using cubic interpolation.25 The examiner marked the scleral spur as a reference point (a slightly depressed region in the limbal area, facing the anterior chamber) to enable the computation of scleral thickness at intervals of 1 mm, extending peripherally from the scleral spur. In particular, the thickness values were obtained along the direction normal to the tangents passing through the interval points located on the outer boundary for better accuracy. Although AST values were obtained up to 8 mm away from the scleral spur, to avoid the effect of extraocular muscle insertion, measurements beyond 5 mm were not included in the analyses.
Proceeding in the same vein as described for AST measurements, PST was determined using another in-house built software by analyzing OCT images of the posterior sclera. Specifically, the retinal, choroidal, and scleral boundaries were marked manually by the examiner by selecting multiple sparse points that were connected to each other to form a complete boundary using cubic interpolation. Subsequently, PST was determined at 1-mm intervals on both sides of the fovea using the software (reference point chosen by the examiner). The retinal outer boundary (retina–choroid interface) was taken as a reference boundary to locate the 1-mm intervals points and corresponding normals to obtain PST measurements (Fig. 2). Unlike AST, where measurements were obtained in four quadrants (superior, inferior, nasal, and temporal) separately, PST measurements were determined based on meridians, that is, along the nasotemporal meridian and the superoinferior meridian, keeping fovea at the center.
The output of the measurements for both AST and PST were automatically exported to a Microsoft Excel sheet (Microsoft Corporation, Redmond, WA). The examiner was masked for the participants’ SER error while marking anterior and posterior boundaries in the B-scan images of both anterior and posterior sclera. A total of 10 random images each of anterior and posterior sclera were used to determine intraobserver and interobserver variability in AST and PST that is measured with the custom-designed software.
Data Analysis and Statistics
IBM SPSS statistics 20.0.0 (SPSS, Inc, Chicago, IL) was used to perform all the statistical tests and the inbuilt features of MS-Excel 2016 (Microsoft Corporation) were used to plot the graphs. The Shappiro-Wilk test indicated that AST at different eccentricities at each of the four meridians and averaged peripheral AST (defined as the average of AST from 1- to 5-mm eccentric locations from limbus along each meridian) were normally distributed. In contrast, AST and averaged peripheral AST from each meridian, when grouped based on the refractive error type (emmetropia and different grades of myopia; i.e., mild, moderate, and severe) were not normally distributed. Similarly, PST at different eccentricities and averaged peripheral PST (defined as an average of PST from 1- to 5-mm eccentric locations from the fovea) in all the four meridians were not normally distributed.
To assess if AST varied among eccentric locations along each meridian, four separate repeated measures ANOVA with the Bonferroni post hoc test were applied (i.e., nasal, temporal, superior, and inferior) considering the AST at six locations (i.e., 0, 1, 2, 3, 4, and 5 mm from the limbus) as a repeated measure. To assess if there were any meridional differences in the averaged peripheral AST values, another repeated measures ANOVA was applied with averaged AST from four meridians as repeated measures.
The Kruskal-Wallis test was used to investigate (a) if the averaged peripheral AST along each of the meridians was different among different refractive error groups (i.e., 4 meridians × 4 refractive error groups) and (b) if the AST at each of six eccentricities (i.e., 0, 1, 2, 3, 4, and 5 mm) was different among different refractive error groups (i.e., 6 locations × 4 refractive error groups). Similarly, the same test was applied to evaluate (a) if there were any differences in the PST at different eccentricities (i.e., 6 locations; subfovea and 0, 1, 2, 3, 4, and 5 mm from the fovea) along each of the meridians and (b) if there were any meridional differences (superior, inferior, nasal, and temporal) in the averaged peripheral PST. Linear regression analysis was performed to investigate if the slopes of averaged peripheral AST and PST (plotted against SER error) of each of four meridians were significantly different. Last, Pearson correlation was performed to investigate the correlation between averaged peripheral AST with the averaged peripheral PST. The AST and PST data are represented as mean ± SE.
Results
The mean ± SD age of the participants was 23.7 ± 3.9 years (range, 15–35 years). The median SER error and axial length was –4.25 D (Q1, –12.50 D; Q3, –1.0 D) and 25 mm (Q1, 23.72 mm; Q3, 28.35 mm), respectively. The intersession repeatability of scleral thickness obtained with single line scan between two sessions of measurement was (mean ± SE) 10 ± 12 µm for AST and 9 ± 7 µm for PST. The intraobserver and interobserver variability for AST measurement was (mean ± SE) 4 ± 8 µm and 0.3 ± 10.0 µm, respectively, and for PST measurement was 4.00 ± 6.23 µm and 0.57 ± 7.90 µm, respectively.
The AST was thickest at the scleral spur (limbus) compared with that of any other locations in the periphery (P < 0.01) along the horizontal and vertical meridians with differences in thickness among meridians: temporal (714 ± 7 µm) > inferior (694 ± 7 µm) > nasal (653 ± 7 µm) > superior (564 ± 6 µm) (Fig. 3). Repeated measures ANOVA revealed that the averaged peripheral scleral thickness (i.e., the average of scleral thickness of ≤5 mm peripheral locations from the limbus) varied significantly along different meridians (P < 0.01). The averaged peripheral AST was similar along the nasotemporal meridian (583 ± 15 vs. 587 ± 27 µm; P > 0.05), but thinnest in the superior compared with the inferior meridian (475 ± 19 vs. 605 ± 18 µm; P < 0.01) along the superoinferior meridian (Fig. 3).
Figure 3.
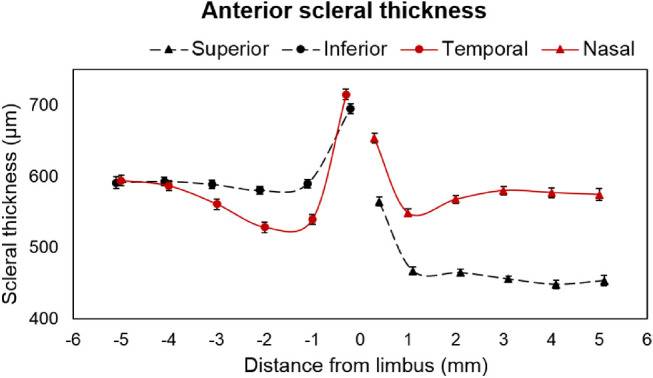
AST in superior, inferior, nasal, and temporal meridians along different eccentricities. “0” indicates scleral spur at the limbus and the error bar represents the standard error. The solid red color line with circular markers indicates temporal and with triangular markers indicates nasal meridians. The black dashed line with circular markers indicate inferior and with triangular markers indicate superior meridians.
The averaged peripheral AST from 1- to 5-mm eccentricities was significantly thinner in myopes compared with emmetropes along the inferior meridian (P < 0.05). On performing linear regression between the averaged peripheral AST along different meridians and the degree of refractive error, the averaged peripheral AST decreased significantly with increasing degree of myopia only along the inferior meridian (P = 0.005) (Fig. 4). It was observed that the changes were significant only at the scleral spur and 1-, 2-, and 3-mm locations (P < 0.001) from the limbus with maximum changes at the 2-mm location (Fig. 5).
Figure 4.

Scatter plot representing linear regression between SER error with averaged peripheral AST (black filled circles) and AST at 2 mm location from the limbal area (red empty circle) in superior (A), nasal (B), inferior (C), and temporal (D) meridians. The linear regression equation in the upper panel represents the result for averaged peripheral AST and in the lower panel, the result for AST at a 2-mm location away from the limbal area (scleral spur) in each graph.
Figure 5.

AST (represented as mean ± SE in micrometers) in superior (A), nasal (B), inferior (C), and temporal (D) meridians at different eccentricities (from limbus to the 5 -mm periphery). ‘0’ represents scleral spur at limbal region and 1, 2, 3, 4, and 5 represents scleral locations away from the limbus in mm. *Statistical significance of <0.05 between emmetropes and different grades of myopes.
The mean subfoveal PST was 251 ± 12 µm in 25 highly myopic participants on whom posterior scleral boundary was visible. The mean subfoveal PST was substantially thinner (by >45%) than the mean AST along all the meridians of the anterior sclera. The averaged peripheral PST was thickest along the superior meridian followed by nasal, inferior, and temporal meridians (superior vs. temporal: 255 ± 12 µm vs. 231 ± 10 µm) as shown in Figure 6. Linear curve fitting indicated nonsignificant changes in PST with increasing eccentricities for all meridians (temporal, y = –3.95x, R2 = 0.008, P = 0.42; inferior, y = –3.35x, R2 = 0.005, P = 0.44; and superior, y = 1.95x, R2 = 0.002, P = 0.67). Also, in contrast with findings for the anterior sclera, no significant asymmetry in the thickness profile was observed along either the horizontal or vertical meridians (P > 0.05). There was no significant change observed in either the subfoveal scleral thickness or averaged peripheral PST with an increasing degree of myopia (P = 0.163) (Fig. 7).
Figure 6.
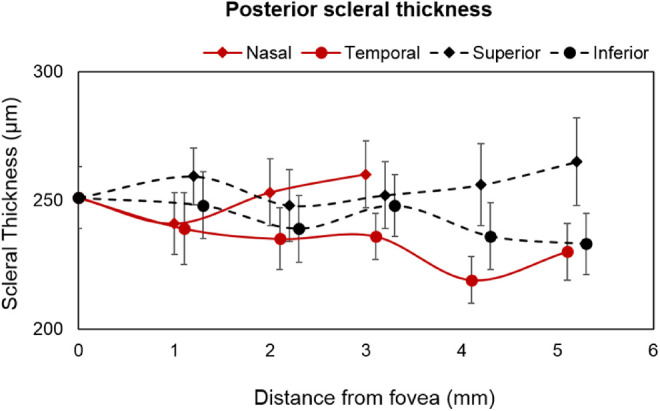
PST of 25 highly myopic participants (represented as mean ± SE in micrometers) measured subfoveal and at different eccentricities (1- to 5-mm peripheral locations in every 1 mm interval from the foveal region).
Figure 7.

Scatter plot showing the linear regression between subfoveal sclera thickness (C) and averaged peripheral PST of 25 highly myopic participants along superior (A), temporal (B), nasal (D) and inferior (E) meridians with the SER error.
The analysis of AST and PST in the same 25 highly myopic participants revealed a poor correlation between any of the four meridians of anterior sclera with that of the four meridians of the posterior sclera (r < 0.284; P > 0.05).
Discussion
This study investigated the AST and PST at different eccentricities from limbal and subfoveal regions, respectively, in emmetropes and a wide range of myopes. AST in all the participants was thickest at the scleral spur located in the limbal region in all the meridians. Although the averaged peripheral AST was similar along the nasotemporal meridian, there was a significant asymmetrical thickness profile along the superoinferior meridian (superior AST thinner than inferior). Among all the meridians, AST at the scleral spur and 1-, 2-, and 3-mm locations along the inferior meridian decreased significantly with the increasing degree of myopia.
The findings of this study that sclera was thickest at the limbal region and gradually decreased on moving away from the limbus corroborates the findings of histomorphometric ex vivo studies by Norman et al.,26 Shen et al.,17 and Vurgese et al.,18 and an in vivo study by Read et al.,19 where AST was reported to decrease from the limbal region toward the equator. However, Buckhurst et al.12 found the anterior sclera to be thickest at and beyond 5 mm compared with the scleral spur (along all the meridians), reason being the inclusion of tendon of extraocular muscles whose insertion point were reported to lie within a distance of 5.5 to 7.7 mm from the limbus.27
AST reported by previous studies are given in Table 1 for comparison with the results of the current study. Among all the four meridians, the sclera was thinnest in the superior meridian in the current study, which is consistent with the results reported by the only in vivo study that investigated AST along vertical meridian in South Asians and Europeans.20,26 Similar results were stated by Norman et al.26 after MRI of 11 enucleated eyes, where the thinnest sclera was found along the superior meridian and the thickest along the inferior meridian from the limbal to the equatorial area. However, the AST reported by Buckhurst et al.12 along each meridian is thicker than our findings, which could be attributed to the inclusion of episcleral tissue thickness for computing scleral thickness, because the poor axial resolution of AS-OCT used in their study (18 µm with AS-OCT vs. 8 µm with SS-OCT) makes it difficult to demarcate the boundary between the episclera and the sclera. Read et al.19 showed thinner AST in Caucasians (thinner by >75 µm) in a relatively smaller range of myopes (≤–8.00 D) compared with the current study (included ≤–27.25 D). Assuming that the scleral thinning is associated with the increasing degree of myopia, the AST reported in the current study should be thinner than that reported by Read et al. based on the range of myopes included in their study. Thus, the inclusion of two different cohorts of myopes cannot be the only reason for such differences in the AST between the studies and could be attributed to the role of ethnicity in myopia.28,29
Table 1.
Averaged Peripheral AST from the Limbus to the Different Peripheral Eccentricities Along Horizontal and Vertical Meridians Investigated by Three Other Studies in Myopes Compared with the Results of the Current Study
| Authors (year) | Country (Population) | N | Refractive Error (D) | Instrument Used | Location from Limbus | S (µm) | I (µm) | N (µm) | T (µm) |
|---|---|---|---|---|---|---|---|---|---|
| Pekel et al.20 (2015) | Turkey (Caucasian) | 31 | –4 to –11 | AS-OCT | 3 mm | — | — | — | 626 ± 56 |
| Buckhurst et al.12 (2015) | British (Caucasian and Indian) | 74 | –0.50 to –10.50 | AS-OCT | ≤6 mm | 695 ± 71 | 806 ± 60 | 736 ± 61 | 709 ± 47 |
| Read et al.19 (2016) | Australia (Caucasian) | 111 | +1.25 to –8 | HS-OCT | ≤4 mm | — | — | 506 ± 72 | 504 ± 93 |
| Current study (2019) | India (Indian) | 95 | +0.75 to –27.25 | SS-OCT | ≤5 mm | 475 ± 19 | 605 ± 18 | 583 ± 15 | 587 ± 27 |
AS-OCT, anterior segment OCT; HS-OCT, Heidelberg Spectralis OCT.
The AST was not influenced by a refractive error in the current study along the superior, nasal, or temporal meridians, which is in concordance with the results of the other studies,12,19,20 except for the inferior meridian, which decreased with the increasing degree of myopic refractive error. The only study by Buckhurst et al.12 that investigated the change in AST with a refractive error along both horizontal and vertical meridians indicated a null relationship between AST and myopia. This difference with the result of the current study could be due to the inclusion of only few high myopes (SER error range, +0.75 to –27.25 D in the current study vs. –0.51 to –10.56 D in Buckhurst et al. study; in n = 14 participants with an axial length of >25.5 mm) and the use of an OCT system that has relatively weaker penetration capacity and axial resolution (AS-OCT in the Buckhurst et al. study vs. SS-OCT in the current study). Histomorphometric analysis of scleral thickness in enucleated eyes did not look into the correlation between the change in AST with axial length/refractive errors.17,18,26
The PST reported by previous studies is given in Table 2 for comparison with the results of the current study. The average subfoveal PST (251 ± 12 µm) reported in this study is comparable with that of the two published in vivo studies.10,16 The recent study by Ohno-Matsui et al.,15 which investigated the PST at subfoveal and two other locations in the temporal meridian, reported a thinner subfoveal (mean ± SD: 197 ± 73 µm vs. 251 ± 59 µm in the current study) and peripheral scleral thickness (mean ± SD: 164 ± 64 µm at 1 mm and 146 ± 59 µm at 2.5 mm) compared with the current study. It has been reported that the scleral fibril diameter decreases in high myopes,3,30,31 causing thinning and weakening of the sclera, which eventually leads to posterior staphyloma formation, especially in older participants.16,32 Ohno Matsui et al. included relatively older populations (59.1 ± 12.3 years vs. 23.3 ± 4.9 years in the current study) with posterior staphyloma in 100% of the eyes compared with the current study where none of the participants had any ocular pathology or staphyloma. This difference could be the reason for the differences in the outcomes between the two studies. Deng et al.33 in Chinese children and adolescent reported a thicker subfoveal PST compared with the current study (Table 2). The inclusion of relatively lower magnitude of myopia (–2.9 ± 2.4 D vs. –17.4 ± 5.1 D in the current study) and lower age of participants (Table 2) in their study could be the reason for finding such thicker scleral thickness.
Table 2.
Averaged Peripheral PST from Subfoveal to Different Peripheral Eccentricities Along Horizontal and Vertical Meridians in Six Earlier Published Studies Compared with the Results of the Current Study in Myopes
| Refractive | Age (years) | Instrument | Subfoveal | |||||||
|---|---|---|---|---|---|---|---|---|---|---|
| Authors (year) | Population | N (eyes) | Error/AL | (mean ± SD) | Used | (µm) | S (µm) | I (µm) | N (µm) | T (µm) |
| Immamura et al.11 (2010) | Japanese (DSM) | 23 | –13.6 ± 5.0 D | 59.3 ± 12 | EDI-OCT (SD-OCT) | 570 ± 221 | 337 | |||
| Ohno-Matsui et al.10 (2012) | Japanese | 246 | –15.1 ± 4.3 D | 60.9 ± 11 | SS-OCT | 228 ± 82 | 191 ± 71 | 182 ± 70 | 253 ± 91 | 182 ± 75 |
| Maruko et al.14 (2012) | Japanese (DSM) | 58 | –12.8 ± 3.6 D | 65.5 | HP/SS-OCT | 559 ± 167 | 322 ± 109 | 296 ± 102 | 407 ± 175 | 284 ± 106 |
| Hayashi et al.16 (2013) | Japanese | 75 | –12.9 ± 4.1 D | 62.3 ± 11 | EDI-OCT | 284 ± 70 | ||||
| Ohno-Matsui et al.15 (2017) | Japanese (PS) | 164 | AL: 30.9 ± 1.9 mm | 59.1 ± 12 | SS-OCT | 197 ± 73 | 146 ± 59 | |||
| Deng et al.33 (2018) | Chinese | 810 | –2.9 ± 2.4 D | 12.8 ± 3 | SS-OCT | 524 ± 57 | ||||
| Current study (2019) | Indian (NP) | 25 | –17.4 ± 5.1 D | 23.3 ± 5 | SS-OCT | 251 ± 12 | 252 ± 12 | 248 ± 11 | 260 ± 12 | 236 ± 10 |
AL, axial length; DSM, dome-shaped macula; EDI-OCT, enhanced depth imaging OCT; HP-OCT, high penetration OCT; SD-OCT, spectral domain OCT; NP, no pathology; S, superior; I, inferior; N, nasal; T, temporal.
The PST did not change significantly with increasing myopic refractive errors among the involved highly myopic participants, a finding similar to the results reported by Hayashi et al.16 in Japanese patients. However, a study by Deng et al.33 that included children with a mild to moderate category of myopia recently reported a decreasing trend of subfoveal scleral thickness with increasing myopic refractive error and age. The inclusion of only adults whose eyes are no longer actively growing and highly myopic participants where the sclera might have undergone extreme thinning up to the limit beyond which further thinning may not possible could be the reason for absence of such trend in the current study.
Various myopia ocular expansion models, such as the posterior pole, equatorial, global, and axial expansion models, were proposed based on the information obtained from repeated photography of cadaveric eyes after inflating the vitreous chamber with saline, photographic ophthalmophakometry, and quantification of in vivo MRIs taken in axial and sagittal planes using an inbuilt caliper21–24,34 (Fig. 8). We found that the inferior scleral meridian in the anterior sclera alone undergoes thinning with increasing degree of myopia compared with the other three meridians and overall posterior scleral thinning along all the four meridians. Considering that expansion of eyeball is associated with thinning of sclera, the result of the current study skews more toward the global ocular expansion model of myopia with the possibility of an asymmetrical expansion (inferior more than superior in the anterior region) along the vertical meridian (Fig. 8). This factor can be linked with the anatomic asymmetry in the orbit, where the presence of extraconal space (the space between the equatorial surface of the eyeball and the orbital walls) in the inferior region is greater than that of superior, medial, and lateral regions, allowing space for the eyeball to expand. Stephan et al.,35 after dissecting adult human cadavers, reported the space between equator of the eyeball and orbital wall to be greatest in the inferior region (7.8 mm in the inferior region vs 5.1 mm in the superior region). Similarly, Atchison et al.,36 based on the findings from MRIs of emmetropic and myopic eyes, reported that the space between the globe and the orbital wall was greater in the vertical meridian compared with that of the horizontal meridian. However, given that there is lack of continuity of data from anterior to posterior eye, that is, beyond 5 mm from the limbus to 5 mm anterior to fovea along each meridian, further investigations are required to map the scleral thickness across the globe in different meridians to validate the asymmetrical nature of global eye expansion. The exact mechanism behind the thinning of anterior sclera along the inferior meridian with increasing myopic refractive error is not clear. Given that ocular growth is associated with the excitation/inhibition of different receptors on the sclera (such as GABA receptors37–39 and muscarinic receptors40) and scleral remodeling,30,41,42 further research in this domain is warranted to investigate (a) possible asymmetrical distribution of these receptors on the anterior sclera and (b) possible asymmetrical remodeling of the scleral tissue.
Figure 8.

Different models of globe expansion during myopia progression. The black dotted line represents the previously reported models and a red dotted line filled with red color represents the assumed possible asymmetrical model of global ocular expansion which needs further investigation.
Major strengths of this study are the inclusion of a wider range of SER error from +0.75 D to –27.25 D and computing scleral thickness perpendicular to a tangent drawn to the anterior scleral boundary (for measuring AST) and retinochoroidal interface boundary (for measuring PST). There are certain limitations to the current study. First, given that the visualization of the posterior sclera was possible only in 25 participants with high myopia of SER error of less than –9.00 D, the relationship between the PST and the refractive error ranging from emmetrope to high myopes and how the AST correlates with the PST in low to moderate myopes could not be established. Second, we have analyzed the anterior and PST only up to 5 mm eccentricity from the reference point. This factor seems to be too narrow to allow a valid extrapolation of results to test the myopia expansion models. Improvement in technology for imaging complete scleral arc ranging from the limbus in the anterior to subfovea in the posterior region will provide deeper insights about ocular expansion models and the potential role of sclera in the myopia development and progression. Third, all participants in this study were Indian ethnic in origin, where the prevalence of myopia is not as high as East Asian countries. Given the differences in ocular anatomy such as eye shape among different ethnicities is reported in the literature,43,44 the potential influence of such entities on the ocular expansion and scleral thickness cannot be ignored.
Posterior ocular structures seen in the B-scan image of the OCT system tend to be flatter than that obtained through ultrasound examination and MRI, which shows the more circular shape of the globe. The nonlinear optical distortions in the B-scan images of posterior ocular structures extracted from OCT were reported to be higher in the peripheral region of the image compared with the central region.45 Kuo et al.45 have shown significant change in posterior segment OCT image curvature between uncorrected and distortion corrected images obtained from spectral domain OCT, but negligible change in retinal thickness (3% error for assumed 200 µm thick retina) within the central 3-mm zone (0.82–4.25 µm with a mean of 2.54 µm) and outside of central 3 mm zone (2.50–9.14 µm with a mean of 6 µm). However, the retinal thickness measured by Kuo et al. was only along the z-axis of the OCT image. Our work constitutes involvement of both the x-axis (because the scleral thickness was measured perpendicular to a tangent drawn to anterior scleral boundary for measuring AST and retinochoroidal interface boundary for measuring PST) and the z-axis of the OCT images. Therefore, the magnitude and effect of optical distortion on the PST profile, especially peripheral to fovea, remains unclear. Additionally, Karnowski et al.46 reported minimal distortions in the radius of curvature of cornea with the use of inbuilt external optical attachment of SS-OCT, but it remains unclear if thickness would be affected. It is therefore not known whether AST measurement in this study is affected by such distortion.
In conclusion, the relatively significant thinning of the anterior sclera along the inferior meridian (from scleral spur to 3 mm eccentricity) with increasing degree of myopia compared with the other three meridians indicates the potential role of AST, especially in the inferior meridian, to act as a marker for myopia progression. Given that this study only shows an association between scleral thickness and the magnitude of myopia, but not the progression of myopia, further studies with a longitudinal study design are warranted to establish a normative database of scleral thicknesses in a larger sample with stable versus progressing myopes across different age groups (for integration into clinical practice for the monitoring of myopia progression) and diverse ethnicities, including children who are vulnerable for myopiogenesis for generalizability of the outcomes of this study.
Acknowledgments
The authors thank Ashutosh Richhariya and Sreenivasa Raju Valivarthy for supporting in developing custom-designed software for measuring scleral thickness, Neelima Manchikanti for helping in repeating the measurements for anterior and posterior thickness, Vijay Yellagondula for critically reviewing the manuscript, and Hyderabad Eye Research Foundation for the support in conducting the study.
Supported by an ARVO publication grant.
Disclosure: R. Dhakal, None; K.K. Vupparaboina, None; P.K. Verkicharla, None
References
- 1. Dhakal R, Goud A, Narayanan R, Verkicharla PK. Patterns of posterior ocular complications in myopic eyes of Indian population. Sci Rep. 2018; 8: 13700. [DOI] [PMC free article] [PubMed] [Google Scholar]
- 2. Ohno-Matsui K, Lai TY, Lai C-C, Cheung CMG. Updates of pathologic myopia. Prog Retin Eye Res. 2016; 52: 156–187. [DOI] [PubMed] [Google Scholar]
- 3. Curtin BJ, Teng CC. Scleral changes in pathological myopia. Trans Am Acad Ophthalmol Otolaryngol. 1958; 62: 777–788; discussion 788–790. [PubMed] [Google Scholar]
- 4. Xu L, Wang Y, Li Y, et al.. Causes of blindness and visual impairment in urban and rural areas in Beijing: the Beijing Eye Study. Ophthalmology. 2006; 113: 1134 e1131–1111. [DOI] [PubMed] [Google Scholar]
- 5. Wong TY, Ferreira A, Hughes R, Carter G, Mitchell P. Epidemiology and disease burden of pathologic myopia and myopic choroidal neovascularization: an evidence-based systematic review. Am J Ophthalmol. 2014; 157: 9–25 e12. [DOI] [PubMed] [Google Scholar]
- 6. Cedrone C, Culasso F, Cesareo M, et al.. Incidence of blindness and low vision in a sample population: the Priverno Eye Study, Italy. Ophthalmology. 2003; 110: 584–588. [DOI] [PubMed] [Google Scholar]
- 7. Cotter SA, Varma R, Ying-Lai M, Azen SP, Klein R, Los Angeles Latino Eye Study G. Causes of low vision and blindness in adult Latinos: the Los Angeles Latino Eye Study. Ophthalmology. 2006; 113: 1574–1582. [DOI] [PubMed] [Google Scholar]
- 8. Iwase A, Araie M, Tomidokoro A, et al.. Prevalence and causes of low vision and blindness in a Japanese adult population: the Tajimi Study. Ophthalmology. 2006; 113: 1354–1362. [DOI] [PubMed] [Google Scholar]
- 9. Rada JAS, Shelton S, Norton TT. The sclera and myopia. Exp Eye Res. 2006; 82: 185–200. [DOI] [PubMed] [Google Scholar]
- 10. Ohno-Matsui K, Akiba M, Modegi T, et al.. Association between shape of sclera and myopic retinochoroidal lesions in patients with pathologic myopia. Invest Ophthalmol Vis Sci. 2012; 53: 6046–6061. [DOI] [PubMed] [Google Scholar]
- 11. Imamura Y, Iida T, Maruko I, Zweifel SA, Spaide RF. Enhanced depth imaging optical coherence tomography of the sclera in dome-shaped macula. Am J Ophthalmol. 2011; 151: 297–302. [DOI] [PubMed] [Google Scholar]
- 12. Buckhurst HD, Gilmartin B, Cubbidge RP, Logan NS. Measurement of scleral thickness in humans using anterior segment optical coherent tomography. PLoS One. 2015; 10: e0132902. [DOI] [PMC free article] [PubMed] [Google Scholar]
- 13. Ebneter A, Haner NU, Zinkernagel MS. Metrics of the normal anterior sclera: imaging with optical coherence tomography. Graefes Arch Clin Exp Ophthalmol. 2015; 253: 1575–1580. [DOI] [PMC free article] [PubMed] [Google Scholar]
- 14. Maruko I, Iida T, Sugano Y, Oyamada H, Akiba M, Sekiryu T. Morphologic analysis in pathologic myopia using high-penetration optical coherence tomography. Invest Ophthalmol Vis Sci. 2012; 53: 3834–3838. [DOI] [PubMed] [Google Scholar]
- 15. Ohno-Matsui K, Fang Y, Morohoshi K, Jonas JB. Optical coherence tomographic imaging of posterior episclera and tenon's capsule. Invest Ophthalmol Vis Sci. 2017; 58: 3389–3394. [DOI] [PubMed] [Google Scholar]
- 16. Hayashi M, Ito Y, Takahashi A, Kawano K, Terasaki H. Scleral thickness in highly myopic eyes measured by enhanced depth imaging optical coherence tomography. Eye. 2013; 27: 410–417. [DOI] [PMC free article] [PubMed] [Google Scholar]
- 17. Shen L, You QS, Xu X, et al.. Scleral and choroidal thickness in secondary high axial myopia. Retina. 2016; 36: 1579–1585. [DOI] [PubMed] [Google Scholar]
- 18. Vurgese S, Panda-Jonas S, Jonas JB. Scleral thickness in human eyes. PloS One. 2012; 7: e29692. [DOI] [PMC free article] [PubMed] [Google Scholar]
- 19. Read SA, Alonso-Caneiro D, Vincent SJ, et al.. Anterior eye tissue morphology: scleral and conjunctival thickness in children and young adults. Sci Rep. 2016; 6: 33796. [DOI] [PMC free article] [PubMed] [Google Scholar]
- 20. Pekel G, Yagc R, Acer S, Ongun GT, Çetin EN, Simavl H. Comparison of corneal layers and anterior sclera in emmetropic and myopic eyes. Cornea. 2015; 34: 786–790. [DOI] [PubMed] [Google Scholar]
- 21. Van Alphen G. Choroidal stress and emmetropization. Vision Res. 1986; 26: 723–734. [DOI] [PubMed] [Google Scholar]
- 22. Sorsby A, Benjamin B, Sheridan M, Stone J, Leary GA. Refraction and its components during the growth of the eye from the age of three. Memo Med Res Counc. 1961; 301(Special): 1–67. [PubMed] [Google Scholar]
- 23. Verkicharla PK, Mathur A, Mallen EA, Pope JM, Atchison DA. Eye shape and retinal shape, and their relation to peripheral refraction. Ophthalmic Physiol Opt. 2012; 32: 184–199. [DOI] [PubMed] [Google Scholar]
- 24. Atchison DA, Jones CE, Schmid KL, et al.. Eye shape in emmetropia and myopia. Invest Ophthalmol Vis Sci. 2004; 45: 3380–3386. [DOI] [PubMed] [Google Scholar]
- 25. De Boor C, De Boor C, Mathématicien E-U, De Boor C, De Boor C. A practical guide to splines. Vol 27: Springer-Verlag; New York; 1978. [Google Scholar]
- 26. Norman RE, Flanagan JG, Rausch SM, et al.. Dimensions of the human sclera: thickness measurement and regional changes with axial length. Exp Eye Res. 2010; 90: 277–284. [DOI] [PubMed] [Google Scholar]
- 27. Sevel D. The origins and insertions of the extraocular muscles: development, histologic features, and clinical significance. Trans Am Ophthalmol Soc. 1986; 84: 488. [PMC free article] [PubMed] [Google Scholar]
- 28. Verkicharla PK, Suheimat M, Schmid KL, Atchison DA. Differences in retinal shape between East Asian and Caucasian eyes. Ophthalmic Physiol Opt. 2017; 37: 275–283. [DOI] [PubMed] [Google Scholar]
- 29. Rudnicka AR, Owen CG, Nightingale CM, Cook DG, Whincup PH. Ethnic differences in the prevalence of myopia and ocular biometry in 10-and 11-year-old children: the Child Heart and Health Study in England (CHASE). Invest Ophthalmol Vis Sci. 2010; 51: 6270–6276. [DOI] [PMC free article] [PubMed] [Google Scholar]
- 30. McBrien NA, Cornell LM, Gentle A. Structural and ultrastructural changes to the sclera in a mammalian model of high myopia. Invest Ophthalmol Vis Sci. 2001; 42: 2179–2187. [PubMed] [Google Scholar]
- 31. McBrien NA, Gentle A. Role of the sclera in the development and pathological complications of myopia. Prog Retin Eye Res. 2003; 22: 307–338. [DOI] [PubMed] [Google Scholar]
- 32. Curtin BJ, Iwamoto T, Renaldo DP. Normal and staphylomatous sclera of high myopia. An electron microscopic study. Arch Ophthalmol. 1979; 97: 912–915. [DOI] [PubMed] [Google Scholar]
- 33. Deng J, Jin J, Lv M, et al.. Distribution of scleral thickness and associated factors in 810 Chinese children and adolescents: a swept‐source optical coherence tomography study. Acta Ophthalmologica. 2018; 97: e410–e418. [DOI] [PMC free article] [PubMed] [Google Scholar]
- 34. Stone R, Flitcroft D. Ocular shape and myopia. Ann Acad Med Singapore. 2004; 33: 7–15. [PubMed] [Google Scholar]
- 35. Stephan CN, Davidson PL. The placement of the human eyeball and canthi in craniofacial identification. J Forens Sci. 2008; 53: 612–619. [DOI] [PubMed] [Google Scholar]
- 36. Atchison DA, Jones CE, Schmid KL, et al.. Eye shape in emmetropia and myopia. Invest Ophthalmol Vis Sci. 2004; 45: 3380–3386. [DOI] [PubMed] [Google Scholar]
- 37. Leung C, Yeung C, Chiang S, Chan K, Pang C, Lam D. GABAA and GABAC (GABAA0r) receptors affect ocular growth and form-deprivation myopia. Cutaneous Ocular Toxicol. 2005; 24: 187–196. [Google Scholar]
- 38. McDonald EF. Expression of GABA receptors in human sclera. Queensland University of Technology; 2014. [Google Scholar]
- 39. Stone RA, Liu J, Sugimoto R, Capehart C, Zhu X, Pendrak K. GABA, experimental myopia, and ocular growth in chick. Invest Ophthalmol Vis Sci. 2003; 44: 3933–3946. [DOI] [PubMed] [Google Scholar]
- 40. Barathi V, Weon S, Beuerman R. Expression of muscarinic receptors in human and mouse sclera and their role in the regulation of scleral fibroblasts proliferation. Mol Vis. 2009; 15: 1277. [PMC free article] [PubMed] [Google Scholar]
- 41. Phillips JR, Khalaj M, McBrien NA. Induced myopia associated with increased scleral creep in chick and tree shrew eyes. Invest Ophthalmol Vis Sci. 2000; 41: 2028–2034. [PubMed] [Google Scholar]
- 42. Curtin BJ. Physiopathologic aspects of scleral stress-strain. Trans Am Ophthalmol Soc. 1969; 67: 417. [PMC free article] [PubMed] [Google Scholar]
- 43. Verkicharla PK, Atchison DA, Suheimat M, et al.. Is retinal shape different in Asians and Caucasians? Estimation from peripheral refraction and peripheral eye length methods. Invest Ophthalmol Vis Sci. 2014; 55: 3592–3592. [Google Scholar]
- 44. Verkicharla PK, Suheimat M, Schmid KL, Atchison DA. Differences in retinal shape between East Asian and Caucasian eyes. Ophthalm Physiol Optics. 2017; 37: 275–283. [DOI] [PubMed] [Google Scholar]
- 45. Kuo AN, McNabb RP, Chiu SJ, et al.. Correction of ocular shape in retinal optical coherence tomography and effect on current clinical measures. Am J Ophthalmol. 2013; 156: 304–311. [DOI] [PMC free article] [PubMed] [Google Scholar]
- 46. Karnowski K, Kaluzny BJ, Szkulmowski M, Gora M, Wojtkowski M. Corneal topography with high-speed swept source OCT in clinical examination. Biomed Opt Exp. 2011; 2: 2709–2720. [DOI] [PMC free article] [PubMed] [Google Scholar]