Abstract
Purpose
To determine the risk between degree of myopia and myopic macular degeneration (MMD), retinal detachment (RD), cataract, open angle glaucoma (OAG), and blindness.
Methods
A systematic review and meta-analyses of studies published before June 2019 on myopia complications. Odds ratios (OR) per complication and spherical equivalent (SER) degree (low myopia SER < –0.5 to > –3.00 diopter [D]; moderate myopia SER ≤ –3.00 to > –6.00 D; high myopia SER ≤ –6.00 D) were calculated using fixed and random effects models.
Results
Low, moderate, and high myopia were all associated with increased risks of MMD (OR, 13.57, 95% confidence interval [CI], 6.18–29.79; OR, 72.74, 95% CI, 33.18–159.48; OR, 845.08, 95% CI, 230.05–3104.34, respectively); RD (OR, 3.15, 95% CI, 1.92–5.17; OR, 8.74, 95% CI, 7.28–10.50; OR, 12.62, 95% CI, 6.65–23.94, respectively); posterior subcapsular cataract (OR, 1.56, 95% CI, 1.32–1.84; OR, 2.55, 95% CI, 1.98–3.28; OR, 4.55, 95% CI, 2.66–7.75, respectively); nuclear cataract (OR, 1.79, 95% CI, 1.08–2.97; OR, 2.39, 95% CI, 1.03–5.55; OR, 2.87, 95% CI, 1.43–5.73, respectively); and OAG (OR, 1.59, 95% CI, 1.33–1.91; OR, 2.92, 95% CI, 1.89–4.52 for low and moderate/high myopia, respectively). The risk of visual impairment was strongly related to longer axial length, higher myopia degree, and age older than 60 years (OR, 1.71, 95% CI, 1.07–2.74; OR, 5.54, 95% CI, 3.12–9.85; and OR, 87.63, 95% CI, 34.50–222.58 for low, moderate, and high myopia in participants aged >60 years, respectively).
Conclusions
Although high myopia carries the highest risk of complications and visual impairment, low and moderate myopia also have considerable risks. These estimates should alert policy makers and health care professionals to make myopia a priority for prevention and treatment.
Keywords: myopia, myopic macular degeneration, retinal detachment, cataract, open angle glaucoma
Myopia or nearsightedness is a refractive error caused by excessive axial elongation.1,2 Myopia can be corrected optically by glasses, contact lenses, or refractive surgery. Nevertheless, it has been associated with complications, such as myopic macular degeneration (MMD), retinal detachment (RD), cataract, and open angle glaucoma (OAG).3 These complications can lead to irreversible visual impairment later in life.4
The most important complication of myopia is MMD, which is a common cause of visual impairment, particularly for high myopia.5 Characteristics of MMD are lacquer cracks, Fuchs spot, choroidal neovascularization (CNV), or chorioretinal atrophy.6 Posterior staphyloma is sometimes considered a specific type of MMD, whereas others consider it rather a risk factor for developing MMD.6,7 Common peripheral retinal lesions in high myopia patients are RD, pigmentary degeneration, lattice degeneration, and pavingstone degeneration, of which RD is the most sight-threatening.5,8 For cataract, the relationship with myopia is less evident. In particular, nuclear cataract may result in a myopic shift, which hampers determination of the original refractive error.9 Considering OAG, Perkins et al.10 already published in 1982 about a higher percentage of myopic patients in the OAG population. A meta-analysis performed on 11 population-based studies also identified an increased risk of OAG for myopic persons.11 Whether visual field progression in myopes is similar to other OAG patients is still unclear.
High myopia (spherical equivalent [SER] ≤ –6 D) is associated with reduced vision-related quality of life and has significant socioeconomic impact.12 The incidence of myopia and high myopia is rising globally, and it is expected that the burden of its complications will lead to considerable visual morbidity in the near future.13,14 Myopia is already the most common cause of irreversible visual impairment in the working population. A recent study estimated $6 billion global productivity loss due to MMD, and this financial burden will undoubtedly become worse in the coming decades.15,16
Although the association with myopic complications has been well established, precise risk estimates of MMD, RD, cataract, and OAG per degree of myopia are yet unknown.17 In this review, we aim to provide a systematic review of the visual morbidity of myopia. First, we calculated the risk estimates of the most prevalent complications, that is, MMD, RD, cataract, and OAG, by performing meta-analyses on all existing data. Because data on other myopia-related complications, such as posterior staphyloma, retinoschisis, and dome-shaped macula, are limited, we did not include these in our review. Second, we explored the impact of these complications on best-corrected visual acuity (BCVA). Considering that cataract can be surgically treated, we also investigated whether this procedure is safe and effective in myopic patients. The risk estimates derived from this study may create awareness among eye care providers for vision-threatening complications associated with myopia and help to inform myopic patients.
Methods
We followed the guidelines of the PRISMA (Preferred Reporting Items for Systematic Reviews and Meta-Analyses) statement for the meta-analyses.18 As published literature was used, ethical approval was not required.
Search Methods
We conducted an extensive literature search in PubMed on myopia and myopia-related complications using the following MeSH terms: “myopia,” “myopia, degenerative,” “visual acuity,” “retinal degeneration,” “choroidal neovascularization,” “retinal detachment,“ “cataract,” and “glaucoma.” The complete PubMed search strategy is available in Supplementary Table S1, and the PRISMA flow diagram is available in Supplementary Figure S1. Titles and abstracts of articles, published before June 1, 2019, were independently reviewed for relevancy by two authors (AEGH and CAE) and included when the following criteria were met: (1) full text available; (2) written in English; and (3) subject of article was myopia complications, visual consequences of myopia, epidemiology of myopia, or epidemiology of visual impairment. Any discrepancies between the two authors were solved by a thorough discussion with other experts until consensus was reached. A manual search was additionally performed by screening of the references of the included articles. All observational studies were considered for inclusion in the meta-analyses.
Data Extraction and Quality Assessment
We obtained (1) geographic region of data collection; (2) period of data collection; (3) risk estimates of MMD, RD, cataract, and OAG for myopia and different myopia categories; and (4) visual acuity (VA) data of myopic patients with and without complications from each selected study. We assessed the quality of all studies using the criteria proposed by Sanderson et al.19 The variables examined included the definitions of the exposures (any, low, moderate, and high myopia), definitions of the outcome variables (MMD, RD, cataract, and OAG), number of participants, age ranges, sex prevalence, study design, and confounding factors used for adjustment. Crude odds ratios (ORs) were calculated for MMD when they were not reported in the studies, using the following formula:
If the number of cases was zero, it was set to 1 for the OR calculation. Refractive error was categorized into five groups: no myopia (SER > –0.5 diopter D]), any myopia (SER ≤ –0.5 D), low myopia (SER < –0.5 to > –3.00 D), moderate myopia (SER ≤ –3.00 to > –6.00 D), and high myopia (SER ≤ –6.00 D), in line with the most recent classification system.20
Data Syntheses
Meta-analyses were performed using a previously validated method in Microsoft Excel 2010 (Microsoft, Redmond, WA, USA); forest plots for all complications and myopia categories were constructed in GraphPad Prism 5 (GraphPad, San Diego, CA, USA).21 A fixed or random effects model was used depending on the number of included studies and the critical value of the calculated Q statistic on the χ2 distribution. The Q statistic was calculated as the weighted sum of squared differences between individual study effects and the pooled effect across different studies. We calculated I2 to investigate heterogeneity between studies, using the formula: ((Q-df)/Q)*100% (df represents degrees of freedom). We used a fixed effects model if heterogeneity was low, that is, the calculated Q was lower than the critical value on a χ2 distribution, and we used a random effects model otherwise.21 Heterogeneity was considered as no, low, moderate, or high for values of <25%, 25% to 50%, 50% to 75%, and ≥75%, respectively.22
Results
Myopic Macular Degeneration
Prevalence of MMD
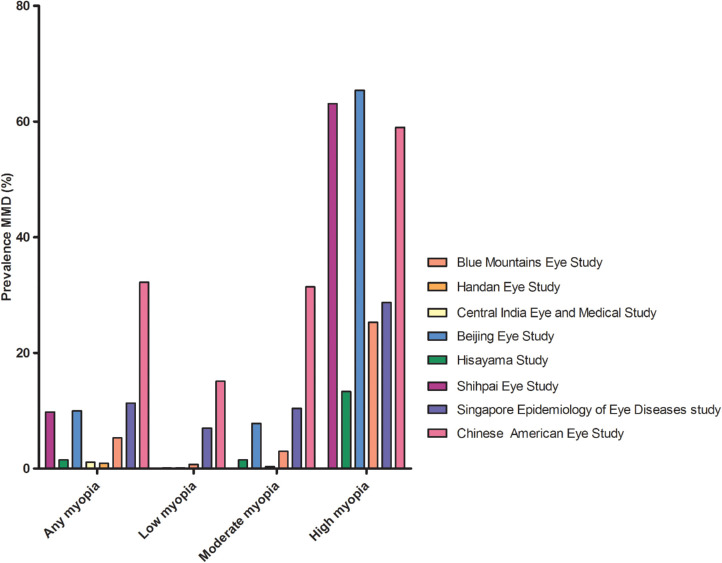
The prevalence of MMD in population-based studies varied from 0.2% in rural central India, to 1.2% in Caucasian Australians, and 4.0% in the Singapore Epidemiology of Eye Diseases (SEED) study (Table 1).23–30 Definitions of MMD differed slightly among studies (Supplementary Table S2). After stratification for myopia degree, the prevalence ranged from 13.3% to 65.4% in high myopes, 0.3% to 7.8% in moderate myopes, and 0.1% to 7.0% in low myopes (Fig. 1).23–30 In six nonpopulation-based studies focusing on high myopia patients only, MMD prevalence ranging from 8.3% to 64.0% was reported (Supplementary Table S3).31–36 A remarkably low MMD prevalence (<15%) among high myopia patients was reported in two studies.33,37 The first study was performed in a very young population, Singaporean men aged 19 to 25 years, and the second study was performed in asymptomatic Chinese patients aged 18 years and older, possibly explaining the low prevalence.33,37 The study of Zhao et al.36 included the most myopic and oldest participants of which 96.9% had at least a tessellated fundus, and 54.5% also had diffuse, patchy, or macular atrophy.
Table 1.
Characteristics of the Studies Investigating the Relationship Between Myopia and MMD
| Study | Authors | Country | Region | Data Collection Period | Total participants (n) | Study type | Age, y* | Male Sex (%) | Definition of Myopia (D) | Myopia (%) | High myopia (%) | Total MMD (%) | MMD Definition (Supplementary Table S2) |
|---|---|---|---|---|---|---|---|---|---|---|---|---|---|
| Blue Mountains Eye Study | Vongphanit et al.23 (2002) | Australia | Urban | 1992–1993 | 3583 | Prospective | 67 (49–97) | 43.5 | Low: –1 to –3 Moderate: –3 to –5 High: ≤ –5 |
16.8 | 2.7 | 1.2 | a (excluding tessellation) |
| Beijing Eye Study | Liu et al.24 (2010) | China | 53.9% urban, 46.1% rural | 2001 | 4319 | Prospective | 57 (40–101) | 45.8 | Low: –0.5 to –2 Moderate: –2 to –6 High: ≤ –6 |
23.3 | 2.4 | 3.1 | a (excluding tessellation) |
| Handan Eye Study | Gao et al.25 (2011) | China | Rural | 2006–2007 | 6603 | Prospective | 52 (>29) | 46.4 | Moderate: –0.5 to –5 High: ≤ –5 |
26.6 | 2.1 | 0.9 | a (excluding tessellation) |
| Shihpai Eye Study | Chen et al.28 (2012) | Taiwan | Urban | 1999–2000 | 1058 | Prospective | 72 (65–91) | 60.4 | Any: ≤ –0.5 High: ≤ –6 |
30.8 | 4.2 | 3.0 | b (≥M3; excluding tessellation) |
| Central India Eye and Medical Study | Jonas et al.27 (2017) | India | Rural | 2006–2009 | 4561 | Prospective | 49 (30–100) | 46.3 | Any: ≤ –1 High: ≤ –8 |
16.6 | 0.5 | 0.02 | c (excluding tessellation) |
| Hisayama Study | Asakuma et al.26 (2012) | Japan | Urban | 2005 | 1892 | Prospective | 64 (>39) | 41.0 | Low: 0 to –2 Moderate: –2 to –6 High: ≤ –6 |
49.0 | 3.7 | 1.7 | d (excluding tessellation) |
| Chinese American Eye Study | Choudhury et al.30 (2018) | United States | Urban | 2010–2013 | 4582 | Prospective | – (<49) | 63 | Low: –0.5 to –2 Moderate: –2 to –5 High: ≤ –5 |
32.2 | 8.0 | 3.1 | c (excluding tessellation) |
| Singapore Epidemiology of Eye Diseases (SEED) Study | Wong et al.29 (2018) | Singapore | Urban | 2004–2011 | 8716 | Prospective | 57 (40–80) | 49.6 | Low: –0.5 to –3 Moderate: –3 to –5 High: ≤ –5 |
35.7 | 6.0 | 4.0 | c (excluding tessellation) |
Mean (range).
Figure 1.
Prevalence of MMD among groups with any, low, moderate, and high myopia derived from eight population-based studies.
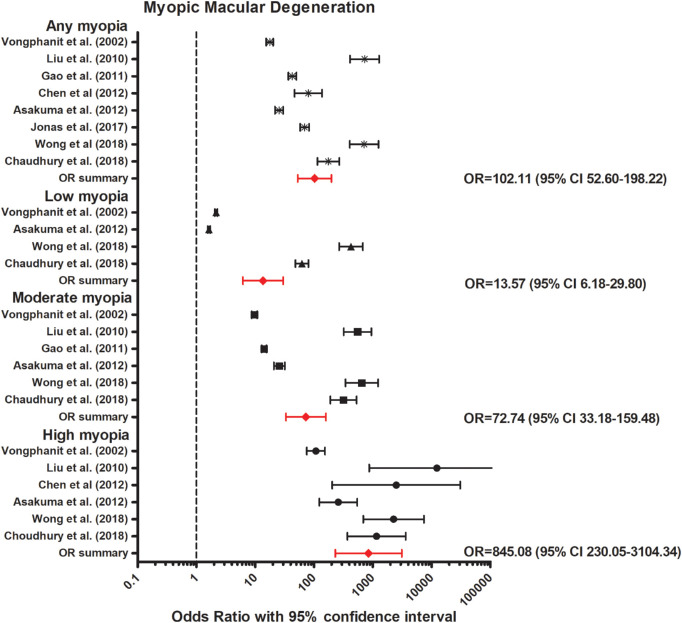
Our meta-analyses, including eight population-based studies, revealed an increased OR for any myopia (OR, 102.11; 95% confidence interval [CI], 52.60–198.22, moderate heterogeneity); low myopia (OR, 13.57; 95% CI, 6.18–29.79, high heterogeneity); moderate myopia (OR, 72.74; 95% CI, 33.18–159.48, moderate heterogeneity); and high myopia (OR, 845.08; 95% CI, 230.05–3104.34, no heterogeneity) (Fig. 2).23–30 The association between axial length (AL) and MMD was investigated in three studies. In a Russian population-based study, patients with MMD had a 1.22 mm increased AL compared with those without MMD.38 In the Chinese American Eye Study, 80.4% of the participants in the fourth quartile of AL (AL ≥25.60 mm) had a particular lesion (MMD including tessellation, tilted disc, and parapapillary atrophy), whereas in the third (AL 24.65–25.60 mm), second (AL 23.85–24.65 mm), and first quartile (AL <23.85 mm) the percentage was 50.1%, 31.9%, and 17.3%, respectively.30 In the Hisayama study, MMD (excluding tessellation, tilted disc, and parapapillary atrophy) was only observed in eyes ≥23.0 mm in men and ≥22.0 mm in women, and the discriminating ability for the presence of MMD was highest at 25.9 mm in men and 25.3 mm in women.39
Figure 2.
Forest plot of MMD in any myopia (random effects model; Q = 16.1; I2 = 56.5); low myopia (random effects model; Q = 27.6; I2 = 85.5); moderate myopia (random effects model; Q = 18.0; I2 = 72.2), and high myopia (random effects model; Q = 5.2; I2 = 4.3). Red lines with diamond represents the summary OR per myopia category. Summary OR for myopia categories are as follows: any myopia OR, 102.11 (95% CI, 52.60–198.22); low myopia OR, 13.57 (95% CI, 6.18–29.79); moderate myopia OR, 72.74 (95% CI, 33.18–159.48); and high myopia OR, 845.08 (95% CI, 230.05–3104.34).
Visual Burden of MMD
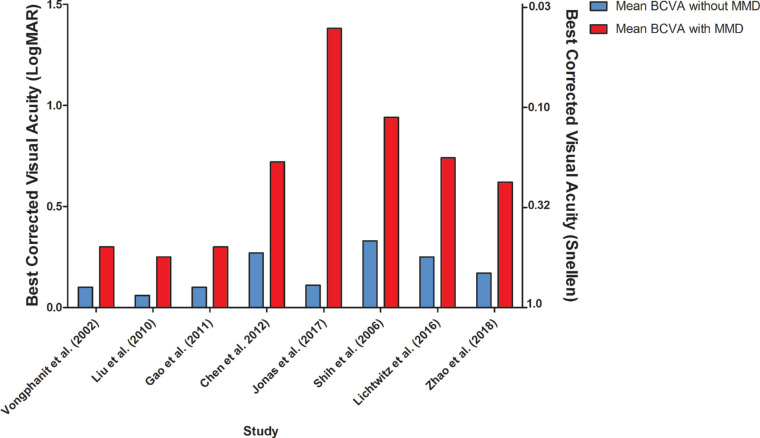
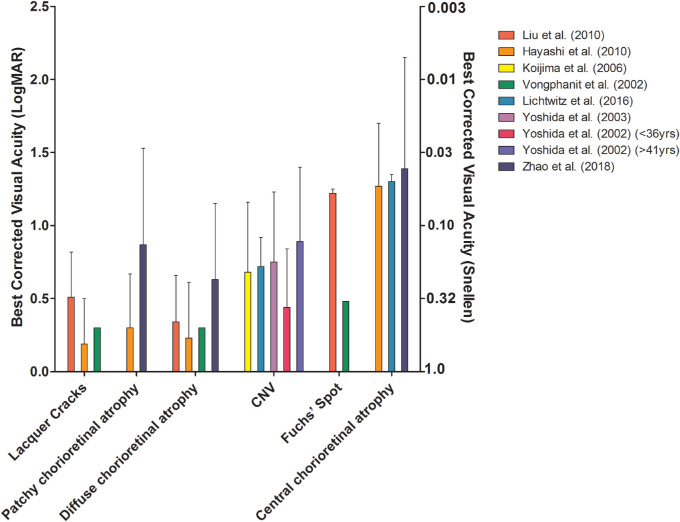
BCVA was measured in eight studies; they all showed a worse BCVA in eyes with MMD compared with eyes without MMD (Supplementary Table S4; Fig. 3).23–25,27,28,36,40,41 Macular atrophy had the largest impact on BCVA, followed by CNV, patchy atrophy, diffuse atrophy, or lacquer cracks according to a longitudinal study of MMD patients in Japan. Patients with only a tessellated fundus did not have a decreased BCVA.42 Other studies also reported that patients with macular atrophy, CNV, or Fuchs spot had worse BCVA compared with those with patchy or diffuse atrophy, lacquer cracks, or tessellated fundus (Fig. 4).23–25,36,41,43 Progression of MMD to more severe stages was more frequent in older patients.42
Figure 3.
BCVA in eyes with and without MMD.
Figure 4.
BCVA in eyes with different stages of MMD.
Retinal Detachment
Incidence of RD
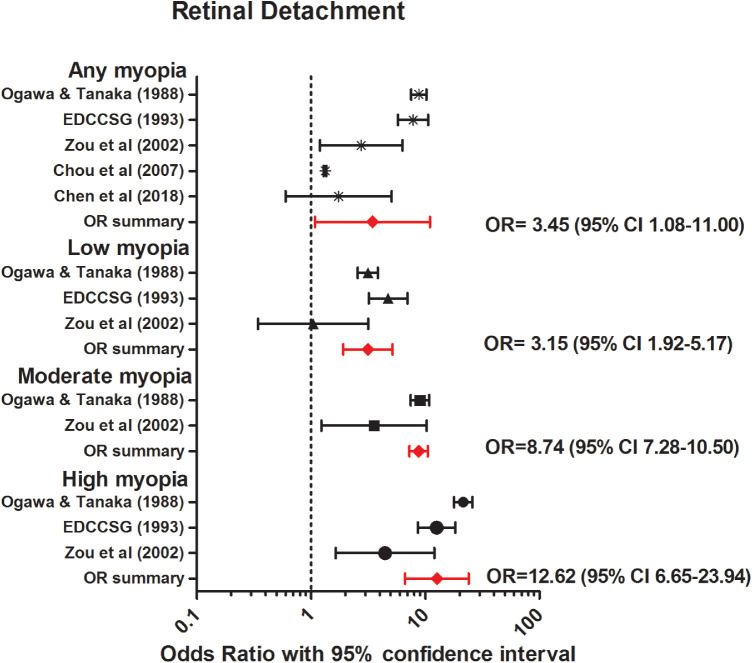
Annual incidence rates of RD ranged from 5.4 per 100,000 persons in Croatia (95% CI, 4.1–6.4), to 16.5 per 100,000 persons in Japan (95% CI, 15.0–18.1) (Table 2).44,47,117,118,120–126 Annual incidence of RD per degree of refractive error was only investigated by Burton et al.,44 reporting increased incidence rates of RD with decreasing SER from 3 in 100,000 persons with hyperopia (>0 D), to 102 in 100,000 persons with high myopia (< –9 D) (Table 2). Five case-control studies were available for meta-analyses to determine the relationship between myopia and RD in various refractive error categories (Table 3).45–49 All but one study showed a significant higher odds of RD for myopic persons (<0 D) compared with nonmyopic persons (Fig. 5).45–49 Pooled analyses revealed an increased OR for any myopia (OR, 3.45; 95% CI, 1.08–11.00, no heterogeneity); low myopia (OR, 3.15; 95% CI, 1.92–5.17, no heterogeneity); moderate myopia (OR, 8.74, 95% CI, 7.28–10.50, no heterogeneity); and high myopia (OR, 12.62; 95% CI, 6.65–23.94, no heterogeneity).
Table 2.
Annual Incidence of RD
| Authors | Country | Data Collection Period | Total RD Cases | Male Sex (%) | Age Cases, y* | Annual Incidence per 100,000 |
|---|---|---|---|---|---|---|
| Laatikainen et al.121 (1985) | Finland | 1978–1981 | 310 | 48.7 | 54.2 ± 1.0 (5.7–83.0) | 6.9 (5.5–8.7) |
| Törnquist et al.126 (1987) | Sweden | 1971–1975 | 590 | 46.6 | 59.5 (–) | 9.8 |
| 1976–1980 | 11.4 | |||||
| Li et al.122 (2003) | China | 1999–2000 | 519 | 57 | 51 (median) (4–84) | 8.0 (7.3–8.7) |
| Ivansevic et al.120 (1999) | Croatia | 1988–1998 | 278 | 54.4 | 58.3 ± 15.3 (7–89) | 5.4 (4.1–6.4) |
| Haga et al.117 (2017) | Japan | 2009–2011 | 897 | 62 | 54.4 ± 15.5 (6–95) | 16.5 (15.0–18.1) |
| Polkinghorne et al.125 (2004) | New Zealand | 1997–1998 | 146 | 56.7 | 53.9 ± 19.6 (5–96) | 11.8 (9.8–13.7) |
| Mitry et al.124 (2010) | United Kingdom | 2007–2009 | 1244 | 61.1 | 60–69 (median group) | 12.1 (11.4–12.7) |
| Mitry et al123 (2011) | United Kindom | 1987 | – | – | – | 10.1 (9.2–10.9) |
| 1991 | 11.0 (10.19–11.9) | |||||
| 1996 | 12.5 (11.5–13.6) | |||||
| 2001 | 12.2 (12.2–14.2) | |||||
| 2006 | 15.28 (14.21–16.35) | |||||
| Zou et al.47 (2002) | China | 1996 | 61 | 47.5 | 40–59 (median group) | 11.3 |
| 1997 | 14.1 | |||||
| 1998 | 14.1 | |||||
| 1999 | 17.9 | |||||
| Burton44 (1989) | United States | 1976 | 172 | 55.9 ± 17.9 | 3 (>0.00 D) | |
| 1976 | 15 (–0.10 D to –6.00 D) | |||||
| 1976 | 102 (< –6.00 D) | |||||
| Chen et al.118 (2016) | Taiwan | 2000–2012 | 2359 | 56.6 | 47.8 (47.1–48.4) | 16.40 (15.34–17.46) |
Mean ± SD (range).
Table 3.
Characteristics of the Studies Investigating the Relationship Between Myopia and RD
| Authors | Country | Data Collection Period | Total Participants (n) | Study Type | Male Sex (%) | Age, y* | Definition of Myopia (D) | Adjusted Covariates |
|---|---|---|---|---|---|---|---|---|
| Ogawa and Tanaka49 (1988) | Japan | 1961–1985 | 12,837 | Case-control | – | – | ≤ –0.75 | Crude OR |
| Chen et al.45 (2018) | China | 2012 | 749 | Case-control | 100 | 21.2 (19–25) | ≤ –6.00 | Crude OR |
| The Eye Disease Case-Control Study Group46 (1993) | United States | 1986–1990 | 1,391 | Case-control | 47.4 | – (21–80) | ≤ –1.00 | Crude OR |
| Zou et al.47 (2002) | China | 1999 | 122 | Case-control | – | – | <0.00 | Crude OR |
| Chou et al.48 (2007) | Taiwan | 1995–2001 | 4,569 | Case-control | 58.2 | 43 ± 18.2 | ≤ –1.00 | Age and sex |
Mean ± SD (range).
Figure 5.
Forest plot of RD in any myopia (random effects model; Q = 1.7; I2 = 0.0); low myopia (random effects model; Q = 3.7; I2 = 0.5); moderate myopia (fixed effects model; Q = 2.8; I2 = 0.6); and high myopia (random effects model; Q = 3.3; I2 = 0.4). Red lines with diamond represents the summary OR per myopia category. Summary OR for myopia categories are as follows: any myopia OR, 3.45 (95% CI, 1.08–11.00); low myopia OR, 3.15 (95% CI, 1.92–5.17); moderate myopia OR, 8.74 (95% CI, 7.28–10.50); and high myopia OR, 12.62 (95% CI, 6.65–23.94).
Visual Burden of RD
Three studies reported BCVA after RD in myopic patients, and they all concluded that visual prognosis was often worse in myopic RD compared with nonmyopic RD.46,50,51 The number of patients with postoperative BCVA of <20/200 was 34% in the high myopia group (SER < –6D) compared with 19% in those without high myopia.50 Four studies reported on the association between myopia and reattachment of the macula after surgery. Two of these studies mentioned that reattachment of the macula after detachment was less successful in highly myopic patients, requiring more reoperations.52–55
Cataract
Myopia and Development of Various Types of Cataract
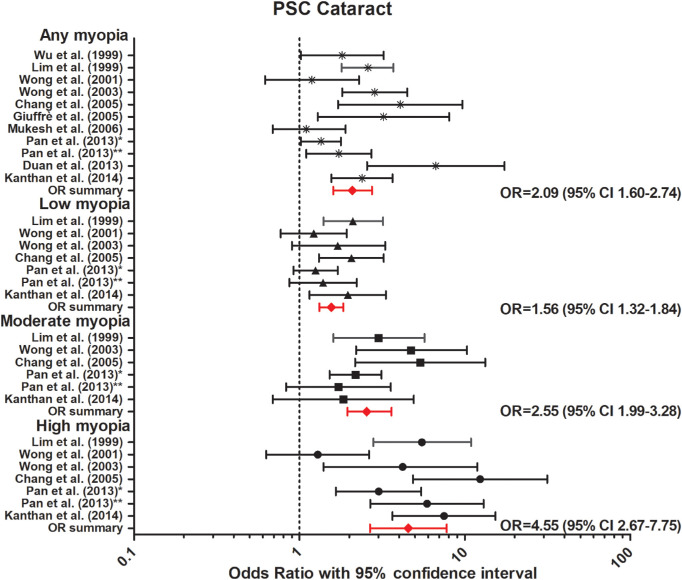
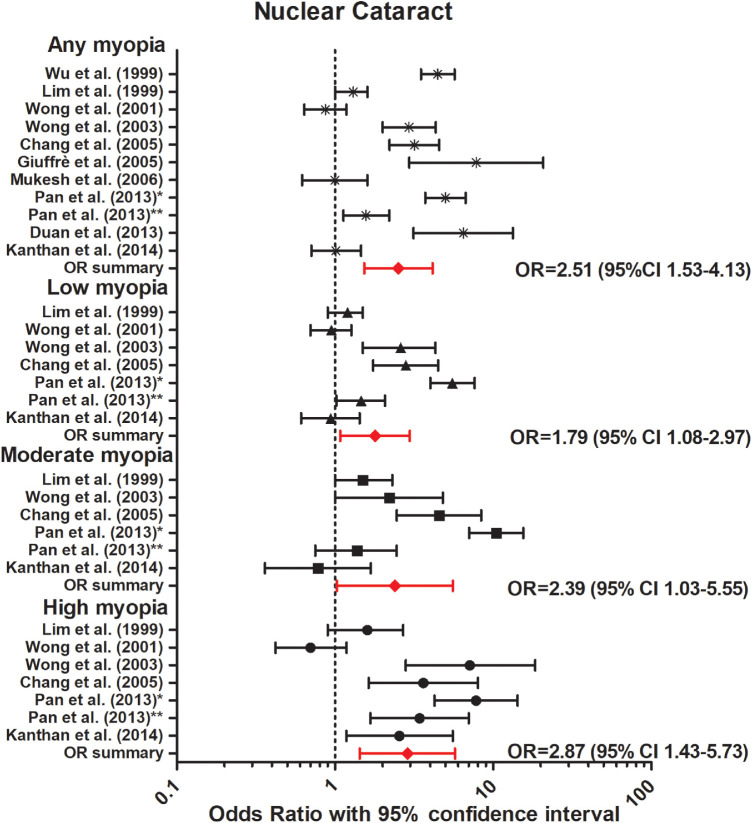
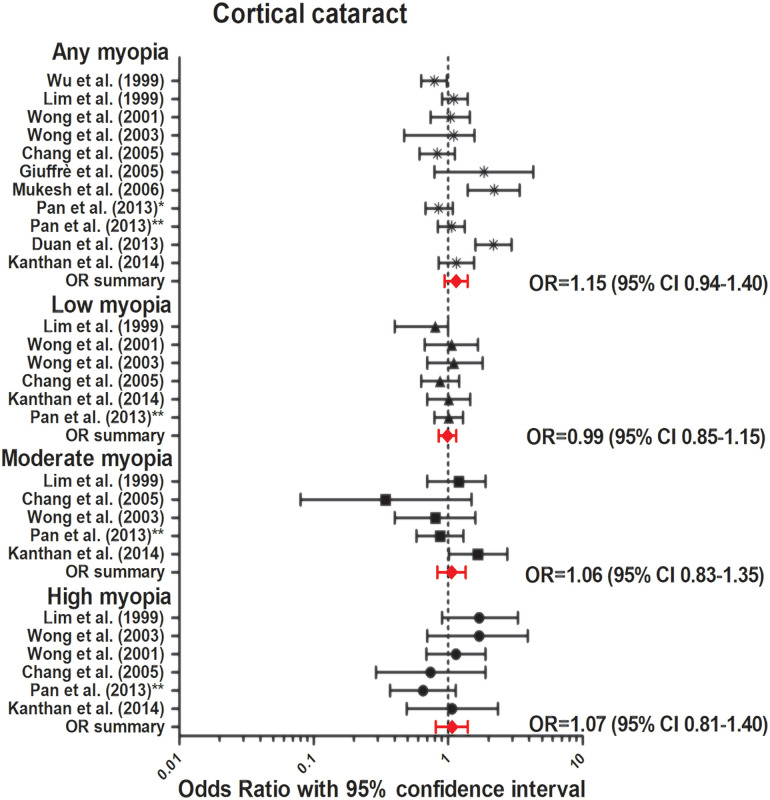
The association between myopia and incident or prevalent cataract was investigated in three prospective and eight cross-sectional studies (Table 4).56–66 Nine out of 11 studies identified a strong association between myopia and posterior subcapsular cataract (PSC).56–66 Our meta-analysis revealed a strong association for any myopia (OR, 2.09; 95% CI, 1.60–2.74, no heterogeneity), low myopia (OR, 1.56; 95% CI, 1.32–1.84, no heterogeneity), moderate myopia (OR, 2.55; 95% CI, 1.98–3.23, no heterogeneity), and high myopia (OR, 4.55; 95% CI, 2.67–7.75, no heterogeneity) (Fig. 6). Seven out of the 11 studies reported an association between myopia and nuclear cataract, and our meta-analysis showed a significant association for any myopia (OR, 2.51; 95% CI, 1.53–4.13, no heterogeneity); low myopia (OR, 1.79; 95% CI, 1.08–2.97, no heterogeneity); moderate myopia (OR, 2.39; 95% CI, 1.03–5.55, no heterogeneity); and high myopia (OR, 2.86; 95% CI, 1.43–5.73, no heterogeneity). Regarding cortical cataract, neither prospective nor cross-sectional studies reported an association (Fig. 7). Our meta-analysis showed a summary OR of 1.15 (95% CI, 0.94–1.40, no heterogeneity) for any myopia; OR, 0.99 (95% CI, 0.85–1.15, no heterogeneity) for low myopia; OR, 1.06 (95% CI, 0.83–1.35, no heterogeneity) for moderate myopia; and OR, 1.07 (95% CI, 0.81–1.40, low heterogeneity) for high myopia (Fig. 8).
Table 4.
Characteristics of the Studies Investigating the Relationship Between Myopia and Cataract
| Study | Authors | Country | Data Collection Period | Total Participants (n) | Study Type | Ethnicity | Male Sex (%) | Age, y* | Definition of Myopia (D) | Adjusted Covariates |
|---|---|---|---|---|---|---|---|---|---|---|
| Blue Mountains Eye Study (BMES) | Kanthan et al.54 2014 | Australia | 1992–2004 | 2564 | Prospective | – | 43.3 | 66 (49–97) | Low: –1 to ≥ –3.5 Moderate: –3.5 to ≥ –6 High: ≤ –6 |
Age, sex |
| Salisbury Eye Evaluation (SEE) | Chang et al.58 2005 | United States | 2520 | Cross-sectional | 73.6% White 26.4% Black |
42.1 | 73.0 ± 5.1 | Low: –0.5 to > –4Moderate: –4 to > –6High: ≤ –6 | Age, race, sex, tobacco use, education, and clustering between eyes | |
| Beaver Dam Eye Study (BDES) | Wong et al.57 2001 | United States | 1988–1990 | 3053 | Prospective | – | 55.1 | 58.8 ± 9.7 | Low: –1 to –3High: ≤ –3.25 | Age, sex |
| Blue Mountains Eye Study (BMES) |
Lim et al.59 1999 | Australia | 1992– 1994 | 3654 | Cross-sectional | – | 43.3 | 66 (49–97) | Low: –1 to > –3.5 Moderate: –3.5 > –6 High: ≤ –6 | Age, sex |
| Singapore Malay Eye Study (SiMES) | Pan et al. 201360 | Singapore, | 2004 | 3280 | Cross-sectional | Malay | – | – (40–80) | Low: –0.5 to ≥ –2Moderate: –2 to ≥ –5High: < –5.0 | Age, sex, body mass index, systolic blood pressure, HbA1c, smoking history, and education level |
| Singapore Indian Eye Study | Pan et al. 201361 | Singapore | 2007 | 3400 | Cross-sectional | Indian | – | – (40– 84) | Any: ≤ –0.5Low: –0.5 to > –3 High: –3 to < –6 | Age, sex, smoking, education, body mass index, hypertension, and total cholesterol level |
| The Casteldaccia Eye Study | Giuffre et al.65 2005 | Italy | – | 1068 | Case-control | White | – | ≥ 40 | Any: > –1.5 | None |
| The Barbados Eye Study | Wu et al.66 1999 | Barbados | 1997–2003 | 4036 | Cross-sectional | Black | 43 | (40–84) | Any: < –0.5 | Age, sex, SES, lens opacity |
| The Handan Eye Study | Duan et al.64 2013 | China | 2006–2007 | 6544 | Cross-sectional | Chinese | 46.3 | 52.0 ± 11.8 | Any: < –0.5 | Not specified (age) |
| The Tanjong Pagar Survey | Wong et al.62 2003 | Singapore | 1997–1998 | 1029 | Cross-sectional | Chinese | 45.6 | – (40–81) | Any: ≤ –0.5 Low: –0.5 to > –3.00 Moderate: –3.0 to > –6 High: < –6 |
Age, sex, education, diabetes, and smoking status |
| The Visual Impairment Project | Mukesh et al.63 2006 | Australia | 1992–1999 | 2392 | Prospective | Caucasian | 45 | 62.5 ± 10.9 | Any: < –1.0 | Age, sex, country of birth, occupation, smoking status, arthritis, diabetes mellitus, vitamin C supplements, calcium channel blockers |
Mean ± SD (range). SES, socio-economic status.
Figure 6.
Forest plot of PSC in any myopia (random effects model; Q = 11.6; I2 = 13.8); low myopia (fixed effects model; Q = 7.5; I2 = 19.7); moderate myopia (fixed effects model; Q = 7.5; I2 = 19.2); and high myopia (random effects model; Q = 6.0; I2 = 0.14). Red lines with diamond represents the summary OR per myopia category, which are as follows: any myopia OR, 2.09 (95% CI, 1.60–2.74); low myopia OR, 1.56 (95% CI, 1.32–1.84); moderate myopia OR, 2.55 (95% CI, 1.99–3.28); and high myopia OR, 4.55 (95% CI, 2.67–7.75). *Represents Pan et al.60 2013 Singapore Malay Eye Study. **Represents Pan et al.61 2013 Singapore Indian Eye Study.
Figure 7.
Forest plot of nuclear cataract in any myopia (random effects model; Q = 9.3; I2 = 0); low myopia (random effects model; Q = 5.7; I2 = 0); moderate myopia (random effects model; Q = 4.0; I2 = 0.0); and high myopia (random effects model; Q = 5.0; I2 = 0.0). Red lines with diamond represents the summary OR per myopia category, which are as follows: any myopia OR, 2.51 (95% CI, 1.53–4.13); low myopia OR, 1.79 (95% CI, 1.08–2.97); moderate myopia OR, 2.39 (95% CI, 1.03–5.55); and high myopia OR, 2.87 (95% CI, 1.43–5.73). *Represents Pan et al.60 2013 Singapore Malay Eye Study. **Represents Pan et al.61 2013 Singapore Indian Eye Study.
Figure 8.
Forest plot of cortical cataract in any myopia (random effects model; Q = 11.5; I2 = 12.8); low myopia (fixed effects model; Q = 0.9; I2 = 0.0); moderate myopia (fixed effects model; Q = 7.15; I2 = 30.1); and high myopia (fixed effects model; Q = 6.7; I2 = 25.9). Red lines with diamond represents the summary OR per myopia category, which are as follows: any myopia OR, 1.15 (95% CI, 0.94–1.40); low myopia OR, 0.99 (95% CI, 0.85–1.15); moderate myopia OR, 1.06 (95% CI, 0.83–1.35); and high myopia OR, 1.07 (95% CI, 0.81–1.40). *Represents Pan et al.60 2013 Singapore Malay Eye Study. **Represents Pan et al.61 2013 Singapore Indian Eye Study.
The Risk of Cataract Extraction (CE)
To investigate whether CE is equally safe in myopic versus nonmyopic patients, we included seven studies investigating the association between CE in myopic patients and development of RD after CE (Fig. 9; Supplementary Table S5).67–73 In five retrospective case series, prevalence of RD in myopic patients ranged from 0% to 3.84%.67–71 Two case–control studies and one cohort study reported a significant risk of RD after CE in myopic patients (1.27% vs. 0.28%, P < 0.001; 8.0% vs. 1.2%, P < 0.01, and HR, 6.12; 95% CI, 5.84–6.41), and the association was stronger in patients undergoing CE aged younger than 55 years (HR, 25.05; 95% CI, 24.76–25.18).72–74 The presence of posterior vitreous detachment prior to CE was not reported.67–71,73,74
Figure 9.
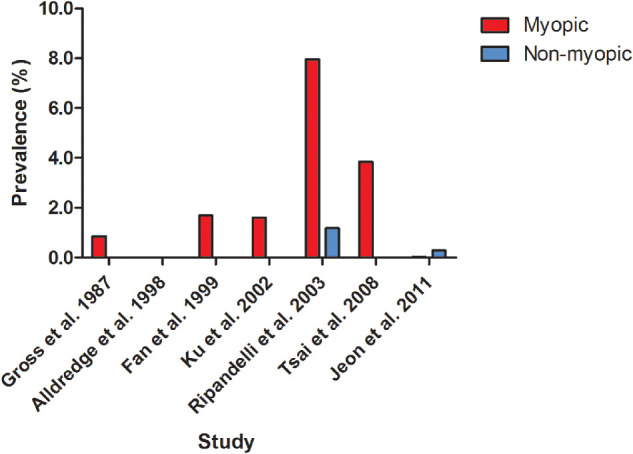
Prevalence of RD after CE in myopic patients. Horizontal axis represent different studies investigating RD rate. Two studies are case–control studies (Ripandelli et al.73 2003 and Jeon et al.72 2011), the other five studies are retrospective case series. The vertical axis represent the prevalence of RD.
Open Angle Glaucoma
The Association Between Myopia and OAG
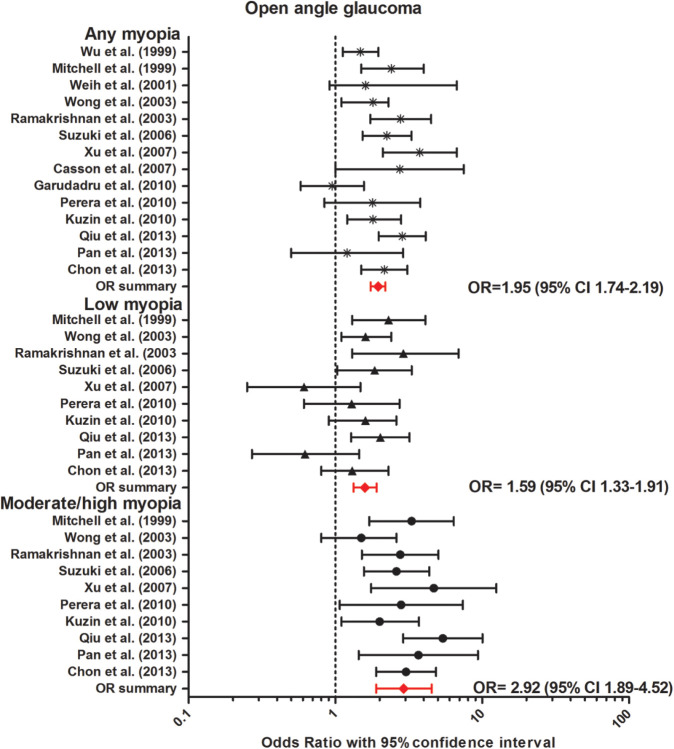
We performed a meta-analysis of 14 population-based studies on the association between myopia and OAG (Table 5).61,66,75–86 Diagnosis of OAG was based on visual field defects and optic disc aberrations in most studies. The overall OR was 1.95 (95% CI, 1.74–2.19, no heterogeneity) for any myopia compared with emmetropia. The association became stronger with increasing myopia degree; the overall pooled OR was 1.59 (95% CI, 1.33–1.91, no heterogeneity) for low myopia (> –3 D); and OR, 2.92 (95% CI, 1.89–4.52, no heterogeneity) for moderate/high myopia (≤ –3 D) (Fig. 10).
Table 5.
Characteristics of the Studies Investigating the Relationship Between Myopia and OAG
| Study | Authors | Data Collection Period | Total Participants (n) | Study Type | Ethnicity | Age, Y | Glaucoma Definition | Definition of Myopia (D) | Adjusted Covariates |
|---|---|---|---|---|---|---|---|---|---|
| The Barbados Eye Study | Wu et al.66 1999 | 1997–2003 | 4,036 | Cross-sectional | Black | 40–84 | GVFL, optic disc abnormalities | Any: < –0.5 | Age, sex, SES, lens opacity |
| The Blue Mountains Eye Study | Mitchell et al.75 1999 | 1992–1994 | 3,654 | Cross-sectional | White | 49–97 | GVFL, CD-ratio ≥0.7 or asymmetry ≥0.3 | Any: ≤ –1.0Low: ≤1.0 to > –3.0High: ≤ –3.0 | Age, sex, family history, DM, steroid use, typical migraine history, hypertension, pseudoexfoliation |
| Visual Impairment Project | Weih et al.76 2001 | 1992–1996 | 4,498 | Cross-sectional | Diverse | ≥40 | IOP ≥22 mm Hg, GVFL, CD-ratio ≥0.7 or asymmetry ≥0.3, family history of glaucoma |
Any: ≤ –0.5 | Age, rural residence, and family history |
| The Beaver Dam Eye Study | Wong et al.77 2003 | 1987–1988 | 4,670 | Cross-sectional | White | 43–86 | GVFL, IOP ≥22 mm Hg, CD-ratio ≥0.8 or asymmetry ≥0.2, history of glaucoma treatment |
Any: ≤ –1.0Low: ≤1.0 to > –3.0High: ≤ –3.0 | Age, sex |
| The Aravind Comprehensive Eye Survey | Ramakrishnan et al.78 2003 | 1995–1997 | 5,150 | Cross-sectional | Indian | ≥40 | GVFL, CD-ratio ≥0.9 or asymmetry ≥0.3, optic disc abnormalities, normal gonioscopy |
Any: ≤-0.5Low, moderate, and high(no specific definition) | Age, sex, DM, hypertension, pseudoexfoliation |
| The Tajimi Study | Suzuki et al.79 2006 | 2000–2001 | 2,874 | Cross-sectional | Japanese | ≥40 | Optic disc abnormalities, perimetric results, other ocular findings |
Any: ≤ –1.0 Low: ≤1.0 to > –3.0High: ≤ –3.0 | Age, IOP |
| The Beijing Eye Study | Xu et al.80 2007 | 2001 | 4,319 | Cross-sectional | Chinese | ≥40 | Optic disc abnormalities, GVFL | Any: < –0.5 Low: <0.5 to > –3High: (< –8) | Age, IOP |
| The Meiktila Eye Study | Casson et al.81 2007 | 2005 | 1,997 | Cross-sectional | Diverse | ≥40 | CD-ratio ≥0.7 or ≥0.6 with asymmetry ≥0.3, reduced NRRW, GVFL, >900 of TM visible | Any: < –0.5 | Age, IOP, AL |
| The Andhra Pradesh Eye Disease Study | Garudadri et al.82 2010 | 1996–2000 | 3,724 | Cross-sectional | Indian | ≥40 | Asymmetrical CD-ratio, NRRW reduced to 0.1, GVFL | Any: < –0.5 | Age, DM, sex, IOP, hypertension |
| The Singapore Malay Eye Study | Perera et al.83 2010 | 2010–2013 | 3,109 | Cross-sectional | Malay | 40–80 | Optic disc abnormalities, GVFL | Any: ≤ –1.0;Low: ≤ –1.0 to >–4.0High: ≤ –4.0 | Age, sex, IOP, education, height, CCT, hypertension, HbA1c |
| The Los Angeles Latino Eye Study | Kuzin et al.84 2010 | 2000–2003 | 5,927 | Cross-sectional | Latino | ≥40 | Optic disc abnormalities, GVFL | Any: ≤ –1.0Low: ≤1.0 to > –3.0High: ≤ –3.0 | Age, IOP, DM, sex, family history, NO, CP |
| National Health and Nutrition Examination Survey | Qiu et al.85 2013 | 2005–2008 | 5,277 | Cross-sectional | Diverse | ≥40 | GVFL | Any: ≤ –1.0Low: –1.00 to –2.99High: ≤ –3.0 | Age, sex, ethnicity, income, and education |
| Singapore Indian Eye Study |
Pan et al.61 2013 | 2007 | 3,400 | Cross-sectional | Indian | 40–84 | Optic disc abnormalities, GVFL | Any: ≤ –0.5Low: –0.5 to –2.99High: ≤ –3.0 | Age, sex, education,HbA1c, total cholesterol level, IOP, and central corneal thickness in generalized estimating equation models |
| Korean National Health and Nutrition Examination Survey | Chon et al.86 2013 | 2008–2011 | 13,433 | Cross-sectional | Korean | ≥40 | Optic disc abnormalities (CD-ratio ≥0.9),GVFL, or IOP >21 mm Hg and VA <3/60 | Any: ≤ –1.0Low: –1.0 to –2.99High: ≤ –3.0 | Age, sex, income, and education |
CCT, central corneal thickness; CD, cup disc; CP, corneal power; DM, diabetes mellitus. NO, lens nuclear opacification; SES, socio-economic status; TM, trabecular meshwork.
Figure 10.
Forest plot of OAG in any myopia (fixed effects model; Q = 8.3; I2 = 0.0); low myopia (fixed effects model; Q = 0.3; I2 = 0.0); and moderate/high myopia (random effects model; Q = 2.6; I2 = 0.0). Red lines with diamond represents the summary OR per myopia category, which are as follows: any myopia OR, 1.95 (95% CI, 1.74–2.19); low myopia OR, 1.59 (95% CI, 1.33–1.91); moderate/high myopia OR, 2.92 (95% CI, 1.89–4.52).
Visual Burden of OAG
Seven retrospective studies, four case only, and three case–control studies reported on the association between myopia and visual field loss progression (Fig. 11; Supplementary Table S6). OAG patients with normotensive intraocular pressure under treatment were included in all studies, and follow-up length ranged from 2 to 10 years. Myopia was identified as a risk factor for visual field progression in OAG in three studies.87–89 However, the other four studies did not report an association.90–93 Whether progressive OAG is an important cause of myopic visual morbidity therefore remains questionable. Lack of data hampered investigation of the association between myopia and VA in OAG patients.
Figure 11.
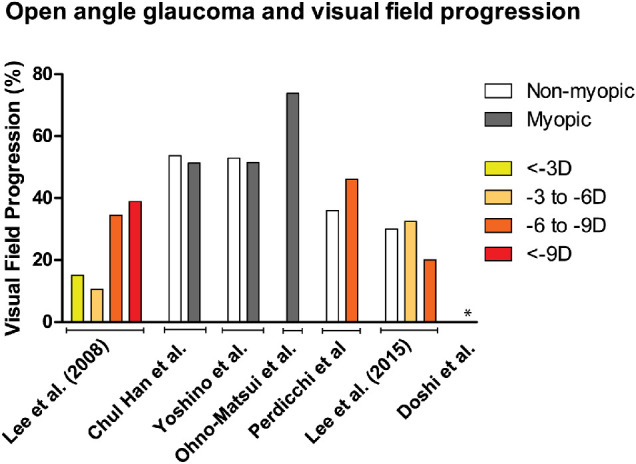
Overview of visual field progression (%) between nonmyopic and myopic patients. Different refractive error categories were indicated by orange patterns. Patients were categorized as myopic if refractive error category was unavailable. Doshi et al.90 found 0% progression in the group SER ≤ –6 D.
Visual Burden of Myopia
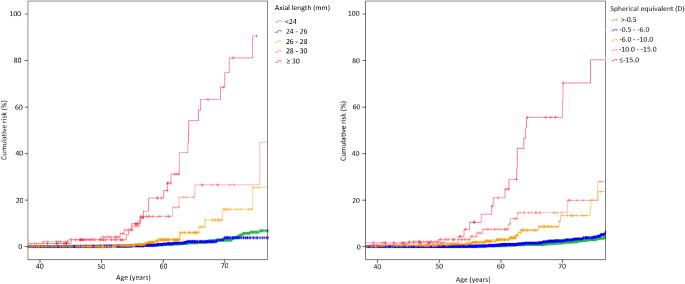
Vision loss from any cause in myopia was investigated in only a few studies. A study using data from the Rotterdam Study, performed in The Netherlands, showed that 34.6% of the high myopes will eventually develop bilateral visual impairment (25.0%) or blindness (9.6%).5 Visual impairment (VA <0.3 and VA ≥0.05) and blindness (VA <0.05) were defined according to the World Health Organization criteria in this study.5 The risk of visual impairment in high myopia started to increase already before the age of 60 years.5 Another Dutch study, including population-based, family-based, and case–control data, investigated the association between myopia, AL, and visual impairment. An overall risk of visual impairment was reported, which increased myopia degree (OR, 0.92, 95% CI, 0.62–1.35 for SER –0.5 to > –3 D; OR, 1.71, 95% CI, 1.07–2.74 for SER –3 to > –6 D; OR, 5.54, 95% CI, 3.12–9.85 for SER –6 to > –10D; OR, 7.77, 95% CI, 3.36–17.99 for SER –10 to > –15 D; OR, 87.63, 95% CI, 34.50–222.58 for SER < –15 D in participants aged >60 years).4 AL was a stronger predictor for visual impairment or blindness than refractive error. The cumulative risk of visual impairment or blindness increased from 6.9% in eyes less than 24 mm, up to 90.6% in eyes of 30 mm or greater in participants aged 75 years or older.4 For those with AL ≥26 mm, one in three was at risk of developing bilateral low vision with increasing age. The rise in cumulative risk started at age 55 years for participants with SER ≤ –10 D, and at age 65 years for participants with SER –6 D to –10 D, and showed an almost exponential increase for SER ≤ –10D thereafter (Fig. 12).4 Considering visual function, 10 studies reported on ERG responses (multifocal and full-field ERG) in mostly healthy adults with different ALs, and identified decreased amplitudes of both a- and b-wave responses, correlating negatively with AL.94–103 Contrast sensitivity was only investigated in healthy myopic participants, and multiple studies reported a decreased contrast sensitivity in myopic compared with emmetropic participants.104–106
Figure 12.
Kaplan–Meier curve of the cumulative risk of visual impairment with increasing age per category of AL (left) and SER (right). Reproduced with permission from Tideman JL, Snabel MC, Tedja MS, et al. Association of axial length with risk of uncorrectable visual impairment for Europeans with myopia. JAMA Ophthalmol. 2016;134:1355–1363. © 2016 American Medical Association.
Discussion
Our study showed that myopia is associated with MMD, RD, PSC, and OAG. The risk of these complications was not only increased for high myopia, but also for low or moderate myopia. Overall, myopic patients had 100-fold higher risk of MMD, three-fold higher risk of RD, three-fold higher risk of PSC, and an almost doubled risk of OAG.
MMD was by far the most hazardous complication. Emmetropic eyes, which served as the reference, did not develop MMD, which hampered interpretation of the high-risk estimates for myopes. Frequency data on MMD could be more informative, but nonuniform definitions, highly variable age distributions of study participants, and the potential selection bias due to hospital recruitment caused large heterogeneity in prevalence estimates. MMD prevalence ranged from 0.1% to 7% in low myopia, 0.3% to 10% in moderate myopia, and 13% to 65% in high myopia.24–26,29 BCVA was generally worse in patients with macular atrophy, CNV, or Fuchs spot.23–25,36,41,43 Tessellation of the fundus did not influence VA, but may increase the risk of more severe MMD with age.42
Our meta-analysis revealed an increased risk for RD in all myopia groups, with higher risk for those with more severe myopia. The OR for moderate myopia was already 8.7, and given the relatively high frequency of myopes in this category, the RD prevalence is expected to rise dramatically. Frequency data of RD per degree of myopia were limited in literature, but Japan and Taiwan reported remarkably higher incidence rates of RD than other countries with a lower myopia prevalence.14 This confirms the notion that RD rates will increase when myopia becomes more prevalent.107 The visual prognosis of myopic RD appeared to be worse than nonmyopic RD in some studies, but this needs more comprehensive research.52–55
Our meta-analysis identified a strong association between myopia, PSC, and nuclear cataract, but not between myopia and cortical cataract. Three mechanisms have been proposed to explain the relationship between myopia and cataract. First, myopic eyes may be exposed to a higher level of oxidative stress caused by faster vitreous liquefaction, or by a decreased level of glutathione, an antioxidative agent in the lens of myopic eyes leading to cataract formation.56,108,109 Second, the higher level of byproducts of lipid peroxidation in myopia may increase cataract formation.56,110–112 Third, longer AL may lead to diminished diffusion of nutrients from the posterior chamber to the lens causing cataract. This mechanism seems less plausible because the aqueous humor also provides nutrients to the lens.58 It should be noted that the association between myopia and nuclear cataract may be influenced by the myopic shift occurring with this type of cataract.9 Cataract is a disorder that can be resolved rather easily by performing CE. In myopic patients, however, reports suggest an increased risk of postsurgery RD, as CE causes a disruption of the capsular-zonular diaphragm and vitreous traction of a thin peripheral retina may then predispose to RD in myopes.69,70,113 However, the long interval between CE and RD in some studies makes a direct causal relationship unlikely.72–74 The procedure itself may be more difficult. After vitreous removal in high myopes zonular weakness may occur, leading to potential zonular instability. In addition, sculpting maneuvers may be more difficult due to a deeper anterior chamber.114 Given all considerations, when posterior vitreous detachment has taken place and substantial vision loss due to lens opacities is present, the visual benefits outweigh the risks and CE is recommended.74 Nevertheless, careful preoperative inspection for retinal tears and prophylactic treatment with laser are warranted.67,68,73
The positive association between myopia and OAG is in line with previous reports.11 Distinguishing myopic optic neuropathy from OAG remains a challenge, and may have led to misclassification and invalid estimations of the calculated OR.115 Considering that myopic eyes have larger optic disc sizes, and therefore larger excavations, OAG is prone to misdiagnosis. The underlying mechanism for a predisposition to OAG is still unclear. Doshi et al.90 mentioned that longer AL leads to tilting of the optic disc, and may possibly cause damage to the axons in the lamina cribrosa. Considering the differences in study design and definitions myopic OAG may unlikely progress to central visual field defects.
To our knowledge, this is the first systematic review and meta-analysis regarding complications associated with myopia. One of the strengths is the completeness of our literature search. We believe that we included all observational studies performed from 1988–2019 in the meta-analyses. Another asset is the estimations of risk per refractive error category, which elucidated the profound risk increase for the higher degrees of myopia, but also revealed substantial risks for the much more common low and moderate myopia. Limitations of our study include the different definitions used for myopic complications, in particular for MMD and OAG. We strived to use the recently defined guidelines by the International Myopia Institute to optimize uniformity between studies, but sometimes had to apply best clinical judgement if this was not possible.20 Our decisions may have affected the results. Another limitation was the lack of multimodal imaging to detect all retinal complications; most studies only used color fundus photographs. In particular, retinoschisis, macular hole, different types of staphylomas, and peripheral lesions are better visualized with other imaging techniques, such as optical coherence tomography and wide-field imaging. We therefore chose to focus only on MMD, RD, cataract, and OAG. We expect that future studies will provide more results using newer and multimodal imaging techniques. Finally, although AL is more closely related to myopic complications than refractive error, we could not study this for most complications, as data on eye biometry were missing.
Regarding clinical management, the results from our meta-analyses suggest that vision-threatening complications can appear from moderate myopia onward. There is a strong relationship between myopia degree, age of the participant, and visual impairment; more severe myopia results in an earlier onset of visual-threatening complications.4,5 Therefore both factors should be taken into account regarding screening programs and clinical guidelines. A period of 20 years between diagnosis and perimetric blindness was estimated for OAG patients with average visual field loss progression.116,117 A significant visual loss over a follow-up period of 10 years was determined for the natural course of MMD.40,42 Considering the asymptomatic period and window of possible action before the onset of complications, we advise an ophthalmologic screen at the age of 30 in myopic patients with SER ≤ –10 D, and at the age of 50 in patients with SER –6 D to –10 D.
Conclusions
This literature review and meta-analyses provide detailed risk estimates of myopic complications. One in three high myopes is at risk of bilateral low vision with age. Low and moderate myopes are less likely to develop such a severe visual outcome; nevertheless, they are at significant risk to develop MMD, RD, cataract, and OAG. This not only affects the individual patient, it has a major impact on health care and society, in particular because future generations may become even more myopic. Awareness of the complications of myopia among patients, physicians, and policy makers is crucial, and a global strategy for prevention and treatment of myopia progression should become a priority.
Supplementary Material
Acknowledgments
The authors thank the research group of the Chinese American Eye Study for providing the number of MMD cases according to the definition of the META-PM study.
Supported by the following foundations: Oogfonds, ODAS, Uitzicht 2017-28 (LSBS, MaculaFonds, Oogfonds), Netherlands Organization for Scientific Research (NWO); Grant 91617076 (VJMV) and Grant 91815655 (CCWK), and European Research Council (ERC) under the European Union's Horizon 2020 research and innovation programme Grant 648268 (CCWK). The funding organizations had no role in the design or conduct of this research. They provided unrestricted grants. None of the authors have financial disclosures that relate to this manuscript.
Disclosure: A.E.G. Haarman, None; C.A. Enthoven, None; J.W.L. Tideman, None; M.S. Tedja, None; V.J.M. Verhoeven, None; C.C.W. Klaver, None
References
- 1. Morgan I, Rose K. How genetic is school myopia? Prog Retin Eye Res. 2005; 24: 1–38. [DOI] [PubMed] [Google Scholar]
- 2. Meng W, Butterworth J, Malecaze F, Calvas P. Axial length of myopia: a review of current research. Ophthalmologica. 2011; 225: 127–134. [DOI] [PubMed] [Google Scholar]
- 3. Flitcroft DI. The complex interactions of retinal, optical and environmental factors in myopia aetiology. Prog Retin Eye Res. 2012; 31: 622–660. [DOI] [PubMed] [Google Scholar]
- 4. Tideman JL, Snabel MC, Tedja MS, et al.. Association of axial length with risk of uncorrectable visual impairment for Europeans with myopia. JAMA Ophthalmol. 2016; 134: 1355–1363. [DOI] [PubMed] [Google Scholar]
- 5. Verhoeven VJ, Wong KT, Buitendijk GH, Hofman A, Vingerling JR, Klaver CC. Visual consequences of refractive errors in the general population. Ophthalmology. 2015; 122: 101–109. [DOI] [PubMed] [Google Scholar]
- 6. Ohno-Matsui K, Kawasaki R, Jonas JB, et al.. International photographic classification and grading system for myopic maculopathy. Am J Ophthalmol. 2015; 159: 877–883.e7. [DOI] [PubMed] [Google Scholar]
- 7. Avila MP, Weiter JJ, Jalkh AE, Trempe CL, Pruett RC, Schepens CL. Natural history of choroidal neovascularization in degenerative myopia. Ophthalmology. 1984; 91: 1573–1581. [DOI] [PubMed] [Google Scholar]
- 8. Lam DS, Fan DS, Chan WM, et al.. Prevalence and characteristics of peripheral retinal degeneration in Chinese adults with high myopia: a cross-sectional prevalence survey. Optom Vis Sci. 2005; 82: 235–238. [DOI] [PubMed] [Google Scholar]
- 9. Brown NA, Hill AR. Cataract: the relation between myopia and cataract morphology. Br J Ophthalmol. 1987; 71: 405–414. [DOI] [PMC free article] [PubMed] [Google Scholar]
- 10. Perkins ES, Phelps CD. Open angle glaucoma, ocular hypertension, low-tension glaucoma, and refraction. Arch Ophthalmol. 1982; 100: 1464–1467. [DOI] [PubMed] [Google Scholar]
- 11. Marcus MW, de Vries MM, Junoy Montolio FG, Jansonius NM. Myopia as a risk factor for open-angle glaucoma: a systematic review and meta-analysis. Ophthalmology. 2011; 118: 1989–1994.e2. [DOI] [PubMed] [Google Scholar]
- 12. Rose K, Harper R, Tromans C, et al.. Quality of life in myopia. Br J Ophthalmol. 2000; 84: 1031–1034. [DOI] [PMC free article] [PubMed] [Google Scholar]
- 13. Holden B, Sankaridurg P, Smith E, Aller T, Jong M, He M. Myopia, an underrated global challenge to vision: where the current data takes us on myopia control. Eye (Lond). 2014; 28: 142–146. [DOI] [PMC free article] [PubMed] [Google Scholar]
- 14. Holden BA, Fricke TR, Wilson DA, et al.. Global prevalence of myopia and high myopia and temporal trends from 2000 through 2050. Ophthalmology. 2016; 123: 1036–1042. [DOI] [PubMed] [Google Scholar]
- 15. Naidoo KS, Fricke TR, Frick KD, et al.. Potential lost productivity resulting from the global burden of myopia: systematic review, meta-analysis, and modeling. Ophthalmology. 2019; 126: 338–346. [DOI] [PubMed] [Google Scholar]
- 16. Fricke TR, Jong M, Naidoo KS, et al.. Global prevalence of visual impairment associated with myopic macular degeneration and temporal trends from 2000 through 2050: systematic review, meta-analysis and modelling. Br J Ophthalmol. 2018; 102: 855–862. [DOI] [PMC free article] [PubMed] [Google Scholar]
- 17. Morgan IG, Ohno-Matsui K, Saw S-M. Myopia. Lancet. 2012; 379: 1739–1748. [DOI] [PubMed] [Google Scholar]
- 18. Moher D, Liberati A, Tetzlaff J, Altman DG, Group P. Preferred reporting items for systematic reviews and meta-analyses: the PRISMA statement. PLoS Med. 2009; 6: e1000097. [DOI] [PMC free article] [PubMed] [Google Scholar]
- 19. Sanderson S, Tatt ID, Higgins J. Tools for assessing quality and susceptibility to bias in observational studies in epidemiology: a systematic review and annotated bibliography. Int J Epidemiol. 2007; 36: 666–676. [DOI] [PubMed] [Google Scholar]
- 20. Flitcroft DI, He M, Jonas JB, et al.. IMI-defining and classifying myopia: a proposed set of standards for clinical and epidemiologic studies. Invest Ophthalmol Vis Sci. 2019; 60: M20–M30. [DOI] [PMC free article] [PubMed] [Google Scholar]
- 21. Neyeloff JL, Fuchs SC, Moreira LB. Meta-analyses and Forest plots using a Microsoft Excel spreadsheet: step-by-step guide focusing on descriptive data analysis. BMC Res Notes. 2012; 5: 52. [DOI] [PMC free article] [PubMed] [Google Scholar]
- 22. Higgins JPT, Thompson SG, Deeks JJ, Altman DG. Measuring inconsistency in meta-analyses. BMJ. 2003; 327: 557–560. [DOI] [PMC free article] [PubMed] [Google Scholar]
- 23. Vongphanit J, Mitchell P, Wang JJ. Prevalence and progression of myopic retinopathy in an older population. Ophthalmology. 2002; 109: 704–711. [DOI] [PubMed] [Google Scholar]
- 24. Liu HH, Xu L, Wang YX, Wang S, You QS, Jonas JB. Prevalence and progression of myopic retinopathy in Chinese adults: the Beijing Eye Study. Ophthalmology. 2010; 117: 1763–1768. [DOI] [PubMed] [Google Scholar]
- 25. Gao LQ, Liu W, Liang YB, et al.. Prevalence and characteristics of myopic retinopathy in a rural Chinese adult population: the Handan Eye Study. Arch Ophthalmol. 2011; 129: 1199–1204. [DOI] [PubMed] [Google Scholar]
- 26. Asakuma T, Yasuda M, Ninomiya T, et al.. Prevalence and risk factors for myopic retinopathy in a Japanese population: the Hisayama Study. Ophthalmology. 2012; 119: 1760–1765. [DOI] [PubMed] [Google Scholar]
- 27. Jonas JB, Nangia V, Gupta R, Bhojwani K, Nangia P, Panda-Jonas S. Prevalence of myopic retinopathy in rural central India. Acta Ophthalmol. 2017; 95: e399–e404. [DOI] [PubMed] [Google Scholar]
- 28. Chen SJ, Cheng CY, Li AF, et al.. Prevalence and associated risk factors of myopic maculopathy in elderly Chinese: the Shihpai eye study. Invest Ophthalmol Vis Sci. 2012; 53: 4868–4873. [DOI] [PubMed] [Google Scholar]
- 29. Wong YL, Sabanayagam C, Ding Y, et al.. Prevalence, risk factors, and impact of myopic macular degeneration on visual impairment and functioning among adults in Singapore. Invest Ophthalmol Vis Sci. 2018; 59: 4603–4613. [DOI] [PubMed] [Google Scholar]
- 30. Choudhury F, Meuer SM, Klein R, et al.. Prevalence and characteristics of myopic degeneration in an adult Chinese American population: the Chinese American Eye Study. Am J Ophthalmol. 2018; 187: 34–42. [DOI] [PMC free article] [PubMed] [Google Scholar]
- 31. Chen H, Wen F, Li H, et al.. The types and severity of high myopic maculopathy in Chinese patients. Ophthalmic Physiol Opt. 2012; 32: 60–67. [DOI] [PubMed] [Google Scholar]
- 32. Chang L, Pan C-W, Ohno-Matsui K, et al.. Myopia-related fundus changes in Singapore adults with high myopia. Am J Ophthalmol. 2013; 155: 991–999.e1. [DOI] [PubMed] [Google Scholar]
- 33. Lai TYY, Fan DSP, Lai WWK, Lam DSC. Peripheral and posterior pole retinal lesions in association with high myopia: a cross-sectional community-based study in Hong Kong. Eye. 2008; 22: 209. [DOI] [PubMed] [Google Scholar]
- 34. Koh VT, Nah GK, Chang L, et al.. Pathologic changes in highly myopic eyes of young males in Singapore. Ann Acad Med Singapore. 2013; 42: 216–224. [PubMed] [Google Scholar]
- 35. Xiao O, Guo X, Wang D, et al.. Distribution and severity of myopic maculopathy among highly myopic eyes. Invest Ophthalmol Vis Sci. 2018; 59: 4880–4885. [DOI] [PubMed] [Google Scholar]
- 36. Zhao X, Ding X, Lyu C, et al.. Morphological characteristics and visual acuity of highly myopic eyes with different severities of myopic maculopathy. Retina. 2020; 40: 461–467. [DOI] [PubMed] [Google Scholar]
- 37. Koh V, Tan C, Tan PT, et al.. Myopic maculopathy and optic disc changes in highly myopic young Asian eyes and impact on visual acuity. Am J Ophthalmol. 2016; 164: 69–79. [DOI] [PubMed] [Google Scholar]
- 38. Bikbov MM, Kazakbaeva GM, Gilmanshin TR, et al.. Axial length and its associations in a Russian population: the Ural Eye and Medical Study. PLoS One. 2019; 14: e0211186. [DOI] [PMC free article] [PubMed] [Google Scholar]
- 39. Hashimoto S, Yasuda M, Fujiwara K, et al.. Association between axial length and myopic maculopathy: the Hisayama Study. Ophthalmology Retina. 2019; 3: 867–873. [DOI] [PubMed] [Google Scholar]
- 40. Shih YF, Ho TC, Hsiao CK, Lin LL. Visual outcomes for high myopic patients with or without myopic maculopathy: a 10 year follow up study. Br J Ophthalmol. 2006; 90: 546–550. [DOI] [PMC free article] [PubMed] [Google Scholar]
- 41. Lichtwitz O, Boissonnot M, Mercie M, Ingrand P, Leveziel N. Prevalence of macular complications associated with high myopia by multimodal imaging. J Fr Ophtalmol. 2016; 39: 355–363. [DOI] [PubMed] [Google Scholar]
- 42. Hayashi K, Ohno-Matsui K, Shimada N, et al.. Long-term pattern of progression of myopic maculopathy: a natural history study. Ophthalmology. 2010; 117: 1595–1611.e1–4. [DOI] [PubMed] [Google Scholar]
- 43. Hayasaka S, Uchida M, Setogawa T. Subretinal hemorrhages with or without choroidal neovascularization in the maculas of patients with pathologic myopia. Graefes Arch Clin Exp Ophthalmol. 1990; 228: 277–280. [DOI] [PubMed] [Google Scholar]
- 44. Burton TC. The influence of refractive error and lattice degeneration on the incidence of retinal detachment. Trans Am Ophthalmol Soc. 1989; 87: 143–157. [PMC free article] [PubMed] [Google Scholar]
- 45. Chen DZ, Koh V, Tan M, et al.. Peripheral retinal changes in highly myopic young Asian eyes. Acta Ophthalmol. 2018; 96: e846–e851. [DOI] [PubMed] [Google Scholar]
- 46. Risk factors for idiopathic rhegmatogenous retinal detachment. The Eye Disease Case-Control Study Group. Am J Epidemiol. 1993; 137: 749–757. [PubMed] [Google Scholar]
- 47. Zou H, Zhang X, Xu X, Wang X, Liu K, Ho PC. Epidemiology survey of rhegmatogenous retinal detachment in Beixinjing District, Shanghai, China. Retina. 2002; 22: 294–299. [DOI] [PubMed] [Google Scholar]
- 48. Chou SC, Yang CH, Lee CH, et al.. Characteristics of primary rhegmatogenous retinal detachment in Taiwan. Eye (Lond). 2007; 21: 1056–1061. [DOI] [PubMed] [Google Scholar]
- 49. Ogawa A, Tanaka M. The relationship between refractive errors and retinal detachment–analysis of 1,166 retinal detachment cases. Jpn J Ophthalmol. 1988; 32: 310–315. [PubMed] [Google Scholar]
- 50. Salicone A, Smiddy WE, Venkatraman A, Feuer W. Visual recovery after scleral buckling procedure for retinal detachment. Ophthalmology. 2006; 113: 1734–1742. [DOI] [PubMed] [Google Scholar]
- 51. Ross WH, Stockl FA. Visual recovery after retinal detachment. Curr Opin Ophthalmol. 2000; 11: 191–194. [DOI] [PubMed] [Google Scholar]
- 52. Tornquist R, Tornquist P. Retinal detachment. A study of a population-based patient material in Sweden 1971-1981. III. Surgical results. Acta Ophthalmol (Copenh). 1988; 66: 630–636. [DOI] [PubMed] [Google Scholar]
- 53. Arias L, Caminal JM, Rubio MJ, et al.. Autofluorescence and axial length as prognostic factors for outcomes of macular hole retinal detachment surgery in high myopia. Retina. 2015; 35: 423–428. [DOI] [PubMed] [Google Scholar]
- 54. Sharma T, Challa JK, Ravishankar KV, Murugesan R. Scleral buckling for retinal detachment. Predictors for anatomic failure. Retina. 1994; 14: 338–343. [DOI] [PubMed] [Google Scholar]
- 55. Grizzard WS, Hilton GF, Hammer ME, Taren D. A multivariate analysis of anatomic success of retinal detachments treated with scleral buckling. Graefes Arch Clin Exp Ophthalmol. 1994; 232: 1–7. [DOI] [PubMed] [Google Scholar]
- 56. Kanthan GL, Mitchell P, Rochtchina E, Cumming RG, Wang JJ. Myopia and the long-term incidence of cataract and cataract surgery: the Blue Mountains Eye Study. Clin Exp Ophthalmol. 2014; 42: 347–353. [DOI] [PubMed] [Google Scholar]
- 57. Wong TY, Klein BE, Klein R, Tomany SC, Lee KE. Refractive errors and incident cataracts: the Beaver Dam Eye Study. Invest Ophthalmol Vis Sci. 2001; 42: 1449–1454. [PubMed] [Google Scholar]
- 58. Chang MA, Congdon NG, Bykhovskaya I, Munoz B, West SK. The association between myopia and various subtypes of lens opacity: SEE (Salisbury Eye Evaluation) project. Ophthalmology. 2005; 112: 1395–1401. [DOI] [PubMed] [Google Scholar]
- 59. Lim R, Mitchell P, Cumming RG. Refractive associations with cataract: the Blue Mountains Eye Study. Invest Ophthalmol Vis Sci. 1999; 40: 3021–3026. [PubMed] [Google Scholar]
- 60. Pan CW, Boey PY, Cheng CY, et al.. Myopia, axial length, and age-related cataract: the Singapore Malay eye study. Invest Ophthalmol Vis Sci. 2013; 54: 4498–4502. [DOI] [PubMed] [Google Scholar]
- 61. Pan CW, Cheung CY, Aung T, et al.. Differential associations of myopia with major age-related eye diseases: the Singapore Indian Eye Study. Ophthalmology. 2013; 120: 284–291. [DOI] [PubMed] [Google Scholar]
- 62. Wong TY, Foster PJ, Johnson GJ, Seah SK. Refractive errors, axial ocular dimensions, and age-related cataracts: the Tanjong Pagar survey. Invest Ophthalmol Vis Sci. 2003; 44: 1479–1485. [DOI] [PubMed] [Google Scholar]
- 63. Mukesh BN, Le A, Dimitrov PN, Ahmed S, Taylor HR, McCarty CA. Development of cataract and associated risk factors: the Visual Impairment Project. Arch Ophthalmol. 2006; 124: 79–85. [DOI] [PubMed] [Google Scholar]
- 64. Duan XR, Liang YB, Wang NL, et al.. Prevalence and associations of cataract in a rural Chinese adult population: the Handan Eye Study. Graefes Arch Clin Exp Ophthalmol. 2013; 251: 203–212. [DOI] [PubMed] [Google Scholar]
- 65. Giuffre G, Dardanoni G, Lodato G. A case-control study on risk factors for nuclear, cortical and posterior subcapsular cataract: the Casteldaccia Eye Study. Acta Ophthalmol Scand. 2005; 83: 567–573. [DOI] [PubMed] [Google Scholar]
- 66. Wu SY, Nemesure B, Leske MC. Refractive errors in a black adult population: the Barbados Eye Study. Invest Ophthalmol Vis Sci. 1999; 40: 2179–2184. [PubMed] [Google Scholar]
- 67. Fan DS, Lam DS, Li KK. Retinal complications after cataract extraction in patients with high myopia. Ophthalmology. 1999; 106: 688–691; discussion 691–682. [DOI] [PubMed] [Google Scholar]
- 68. Tsai CY, Chang TJ, Kuo LL, Chou P, Woung LC. Visual outcomes and associated risk factors of cataract surgeries in highly myopic Taiwanese. Ophthalmologica. 2008; 222: 130–135. [DOI] [PubMed] [Google Scholar]
- 69. Ku WC, Chuang LH, Lai CC. Cataract extraction in high myopic eyes. Chang Gung Med J. 2002; 25: 315–320. [PubMed] [Google Scholar]
- 70. Alldredge CD, Elkins B, Alldredge OC Jr.. Retinal detachment following phacoemulsification in highly myopic cataract patients. J Cataract Refract Surg. 1998; 24: 777–780. [DOI] [PubMed] [Google Scholar]
- 71. Gross KA, Pearce JL. Modern cataract surgery in a highly myopic population. Br J Ophthalmol. 1987; 71: 215–219. [DOI] [PMC free article] [PubMed] [Google Scholar]
- 72. Jeon S, Kim HS. Clinical characteristics and outcomes of cataract surgery in highly myopic Koreans. Korean J Ophthalmol. 2011; 25: 84–89. [DOI] [PMC free article] [PubMed] [Google Scholar]
- 73. Ripandelli G, Scassa C, Parisi V, Gazzaniga D, D'Amico DJ, Stirpe M. Cataract surgery as a risk factor for retinal detachment in very highly myopic eyes. Ophthalmology. 2003; 110: 2355–2361. [DOI] [PubMed] [Google Scholar]
- 74. Daien V, Le Pape A, Heve D, Carriere I, Villain M. Incidence, risk factors, and impact of age on retinal detachment after cataract surgery in France: a national population study. Ophthalmology. 2015; 122: 2179–2185. [DOI] [PubMed] [Google Scholar]
- 75. Mitchell P, Hourihan F, Sandbach J, Wang JJ. The relationship between glaucoma and myopia: the Blue Mountains Eye Study. Ophthalmology. 1999; 106: 2010–2015. [DOI] [PubMed] [Google Scholar]
- 76. Weih LM, Nanjan M, McCarty CA, Taylor HR. Prevalence and predictors of open-angle glaucoma: results from the visual impairment project. Ophthalmology. 2001; 108: 1966–1972. [DOI] [PubMed] [Google Scholar]
- 77. Wong TY, Klein BE, Klein R, Knudtson M, Lee KE. Refractive errors, intraocular pressure, and glaucoma in a white population. Ophthalmology. 2003; 110: 211–217. [DOI] [PubMed] [Google Scholar]
- 78. Ramakrishnan R, Nirmalan PK, Krishnadas R, et al.. Glaucoma in a rural population of southern India: the Aravind comprehensive eye survey. Ophthalmology. 2003; 110: 1484–1490. [DOI] [PubMed] [Google Scholar]
- 79. Suzuki Y, Iwase A, Araie M, et al.. Risk factors for open-angle glaucoma in a Japanese population: the Tajimi Study. Ophthalmology. 2006; 113: 1613–1617. [DOI] [PubMed] [Google Scholar]
- 80. Xu L, Wang Y, Wang S, Wang Y, Jonas JB. High myopia and glaucoma susceptibility the Beijing Eye Study. Ophthalmology. 2007; 114: 216–220. [DOI] [PubMed] [Google Scholar]
- 81. Casson RJ, Gupta A, Newland HS, et al.. Risk factors for primary open-angle glaucoma in a Burmese population: the Meiktila Eye Study. Clin Exp Ophthalmol. 2007; 35: 739–744. [DOI] [PubMed] [Google Scholar]
- 82. Garudadri C, Senthil S, Khanna RC, Sannapaneni K, Rao HB. Prevalence and risk factors for primary glaucomas in adult urban and rural populations in the Andhra Pradesh Eye Disease Study. Ophthalmology. 2010; 117: 1352–1359. [DOI] [PubMed] [Google Scholar]
- 83. Perera SA, Wong TY, Tay WT, Foster PJ, Saw SM, Aung T. Refractive error, axial dimensions, and primary open-angle glaucoma: the Singapore Malay Eye Study. Arch Ophthalmol. 2010; 128: 900–905. [DOI] [PubMed] [Google Scholar]
- 84. Kuzin AA, Varma R, Reddy HS, Torres M, Azen SP; Los Angeles Latino Eye Study Group. Ocular biometry and open-angle glaucoma: the Los Angeles Latino Eye Study. Ophthalmology. 2010; 117: 1713–1719. [DOI] [PMC free article] [PubMed] [Google Scholar]
- 85. Qiu M, Wang SY, Singh K, Lin SC. Association between myopia and glaucoma in the United States population. Invest Ophthalmol Vis Sci. 2013; 54: 830–835. [DOI] [PMC free article] [PubMed] [Google Scholar]
- 86. Chon B, Qiu M, Lin SC. Myopia and glaucoma in the South Korean population. Invest Ophthalmol Vis Sci. 2013; 54: 6570–6577. [DOI] [PubMed] [Google Scholar]
- 87. Ohno-Matsui K, Shimada N, Yasuzumi K, et al.. Long-term development of significant visual field defects in highly myopic eyes. Am J Ophthalmol. 2011; 152: 256–265.e1. [DOI] [PubMed] [Google Scholar]
- 88. Perdicchi A, Iester M, Scuderi G, Amodeo S, Medori EM, Recupero SM. Visual field damage and progression in glaucomatous myopic eyes. Eur J Ophthalmol. 2007; 17: 534–537. [DOI] [PubMed] [Google Scholar]
- 89. Lee YA, Shih YF, Lin LL, Huang JY, Wang TH. Association between high myopia and progression of visual field loss in primary open-angle glaucoma. J Formos Med Assoc. 2008; 107: 952–957. [DOI] [PubMed] [Google Scholar]
- 90. Doshi A, Kreidl KO, Lombardi L, Sakamoto DK, Singh K. Nonprogressive glaucomatous cupping and visual field abnormalities in young Chinese males. Ophthalmology. 2007; 114: 472–479. [DOI] [PubMed] [Google Scholar]
- 91. Han JC, Lee EJ, Kim SH, Kee C. Visual field progression pattern associated with optic disc tilt morphology in myopic open-angle glaucoma. Am J Ophthalmol. 2016; 169: 33–45. [DOI] [PubMed] [Google Scholar]
- 92. Yoshino T, Fukuchi T, Togano T, et al.. Rate of progression of total, upper, and lower visual field defects in patients with open-angle glaucoma and high myopia. Jpn J Ophthalmol. 2016; 60: 78–85. [DOI] [PubMed] [Google Scholar]
- 93. Lee JY, Sung KR, Han S, Na JH. Effect of myopia on the progression of primary open-angle glaucoma. Invest Ophthalmol Vis Sci. 2015; 56: 1775–1781. [DOI] [PubMed] [Google Scholar]
- 94. Kawabata H, Adachi-Usami E. Multifocal electroretinogram in myopia. Invest Ophthalmol Vis Sci. 1997; 38: 2844–2851. [PubMed] [Google Scholar]
- 95. Westall CA, Dhaliwal HS, Panton CM, et al.. Values of electroretinogram responses according to axial length. Doc Ophthalmol. 2001; 102: 115–130. [DOI] [PubMed] [Google Scholar]
- 96. Hidajat R, McLay J, Burley C, Elder M, Morton J, Goode D. Influence of axial length of normal eyes on PERG. Doc Ophthalmol. 2003; 107: 195–200. [DOI] [PubMed] [Google Scholar]
- 97. Luu CD, Lau AM, Lee SY. Multifocal electroretinogram in adults and children with myopia. Arch Ophthalmol. 2006; 124: 328–334. [DOI] [PubMed] [Google Scholar]
- 98. Kader MA. Electrophysiological study of myopia. Saudi J Ophthalmol. 2012; 26: 91–99. [DOI] [PMC free article] [PubMed] [Google Scholar]
- 99. Ho WC, Kee CS, Chan HH. Myopic children have central reduction in high contrast multifocal ERG response, while adults have paracentral reduction in low contrast response. Invest Ophthalmol Vis Sci. 2012; 53: 3695–3702. [DOI] [PubMed] [Google Scholar]
- 100. Koh V, Tan C, Nah G, et al.. Correlation of structural and electrophysiological changes in the retina of young high myopes. Ophthalmic Physiol Opt. 2014; 34: 658–666. [DOI] [PubMed] [Google Scholar]
- 101. Ismael ZF, El-Shazly AAE, Farweez YA, Osman MMM. Relationship between functional and structural retinal changes in myopic eyes. Clin Exp Optom. 2017; 100: 695–703. [DOI] [PubMed] [Google Scholar]
- 102. Sachidanandam R, Ravi P, Sen P. Effect of axial length on full-field and multifocal electroretinograms. Clin Exp Optom. 2017; 100: 668–675. [DOI] [PubMed] [Google Scholar]
- 103. Wan W, Chen Z, Lei B. Increase in electroretinogram rod-driven peak frequency of oscillatory potentials and dark-adapted responses in a cohort of myopia patients. Doc Ophthalmol. 2019. Oct 28. doi: 10.1007/s10633-019-09732-4 . [Epub ahead of print]. [DOI] [PubMed] [Google Scholar]
- 104. Liou SW, Chiu CJ. Myopia and contrast sensitivity function. Curr Eye Res. 2001; 22: 81–84. [DOI] [PubMed] [Google Scholar]
- 105. Stoimenova BD. The effect of myopia on contrast thresholds. Invest Ophthalmol Vis Sci. 2007; 48: 2371–2374. [DOI] [PubMed] [Google Scholar]
- 106. Collins JW, Carney LG. Visual performance in high myopia. Curr Eye Res. 1990; 9: 217–223. [DOI] [PubMed] [Google Scholar]
- 107. Williams KM, Verhoeven VJM, Cumberland P, et al.. Prevalence of refractive error in Europe: the European Eye Epidemiology (E3) Consortium. Eur J Epidemiol. 2015; 30: 305–315. [DOI] [PMC free article] [PubMed] [Google Scholar]
- 108. Boscia F, Grattagliano I, Vendemiale G, Micelli-Ferrari T, Altomare E. Protein oxidation and lens opacity in humans. Invest Ophthalmol Vis Sci. 2000; 41: 2461–2465. [PubMed] [Google Scholar]
- 109. Palmquist BM, Philipson B, Barr PO. Nuclear cataract and myopia during hyperbaric oxygen therapy. Br J Ophthalmol. 1984; 68: 113–117. [DOI] [PMC free article] [PubMed] [Google Scholar]
- 110. Younan C, Mitchell P, Cumming RG, Rochtchina E, Wang JJ. Myopia and incident cataract and cataract surgery: the Blue Mountains Eye Study. Invest Ophthalmol Vis Sci. 2002; 43: 3625–3632. [PubMed] [Google Scholar]
- 111. Micelli-Ferrari T, Vendemiale G, Grattagliano I, et al.. Role of lipid peroxidation in the pathogenesis of myopic and senile cataract. Br J Ophthalmol. 1996; 80: 840–843. [DOI] [PMC free article] [PubMed] [Google Scholar]
- 112. Simonelli F, Nesti A, Pensa M, et al.. Lipid peroxidation and human cataractogenesis in diabetes and severe myopia. Exp Eye Res. 1989; 49: 181–187. [DOI] [PubMed] [Google Scholar]
- 113. Klaver CC, Wolfs RC, Vingerling JR, Hofman A, de Jong PT.. Age-specific prevalence and causes of blindness and visual impairment in an older population: the Rotterdam Study. Arch Ophthalmol. 1998;116: 653–658. [DOI] [PubMed] [Google Scholar]
- 114. Eleftheriadis H, Amoros S, Bilbao R, Teijeiro MA. Spontaneous dislocation of a phakic refractive lens into the vitreous cavity. J Cataract Refract Surg. 2004; 30: 2013–2016. [DOI] [PubMed] [Google Scholar]
- 115. Ohno-Matsui K, Lai TY, Lai CC, Cheung CM. Updates of pathologic myopia. Prog Retin Eye Res. 2016; 52: 156–187. [DOI] [PubMed] [Google Scholar]
- 116. Saunders LJ, Medeiros FA, Weinreb RN, Zangwill LM. What rates of glaucoma progression are clinically significant? Expert Rev Ophthalmol. 2016; 11: 227–234. [DOI] [PMC free article] [PubMed] [Google Scholar]
- 117. Hattenhauer MG, Johnson DH, Ing HH, et al.. The probability of blindness from open-angle glaucoma. Ophthalmology. 1998; 105: 2099–2104. [DOI] [PubMed] [Google Scholar]
- 118. Chen SN, Ie B Lian, Wei YJ. Epidemiology and clinical characteristics of rhegmatogenous retinal detachment in Taiwan. Br J Ophthalmol. 2016; 100: 1216–1220. [DOI] [PubMed] [Google Scholar]
- 119. Haga A, Kawaji T, Tsutsumi T, Ideta R, Tanihara H. The incidence of rhegmatogenous retinal detachment in kumamoto, Japan between 2009 and 2011. J Clin Exp Ophthalmol. 2017; 8: 2. [Google Scholar]
- 120. Ivanisevic M, Bojic L, Eterovic D. Epidemiological study of nontraumatic phakic rhegmatogenous retinal detachment. Ophthalmic Res. 2000; 32: 237–239. [DOI] [PubMed] [Google Scholar]
- 121. Laatikainen L, Tolppanen EM, Harju H. Epidemiology of rhegmatogenous retinal detachment in a Finnish population. Acta ophthalmologica. 1985; 63: 59–64. [DOI] [PubMed] [Google Scholar]
- 122. Li X, Beijing G. Rhegmatogenous Retinal Detachment Study Incidence and epidemiological characteristics of rhegmatogenous retinal detachment in Beijing, China. Ophthalmology. 2003; 110: 2413–2417. [DOI] [PubMed] [Google Scholar]
- 123. Mitry D, Chalmers J, Anderson K, Williams L, Fleck BW, Wright A, Campbell H. Temporal trends in retinal detachment incidence in Scotland between 1987 and 2006. British journal of ophthalmology. 2011; 95: 365–369. [DOI] [PubMed] [Google Scholar]
- 124. Mitry D, Charteris DG, Yorston D, Siddiqui MAR, Campbell H, Murphy A-L, Fleck BW, Wright AF, Singh J. The Epidemiology and Socioeconomic Associations of Retinal Detachment in Scotland: A Two-Year Prospective Population-Based Study. Investigative Ophthalmology & Visual Science. 2010; 51(10): 4963–4968. [DOI] [PubMed] [Google Scholar]
- 125. Polkinghorne PJ, Craig JP. Northern New Zealand Rhegmatogenous Retinal Detachment Study: epidemiology and risk factors. Clin Exp Ophthalmol. 2004; 32: 159–163. [DOI] [PubMed] [Google Scholar]
- 126. Törnquist R, Stenkula S, Tornquist P. Retinal detachment. A study of a population-based patient material in Sweden 1971-1981. I. Epidemiology. Acta Ophthalmol (Copenh). 1987; 65: 213–222. [DOI] [PubMed] [Google Scholar]
Associated Data
This section collects any data citations, data availability statements, or supplementary materials included in this article.


