Abstract
Type 1 diabetes (T1D) is an autoimmune disorder which develops when insulin-producing, pancreatic beta cells are destroyed by an aberrant immune response. Current therapies for T1D either treat symptoms or cause global immunosuppression, which leave patients at risk of developing long-term complications or vulnerable to foreign pathogens. Antigen-specific immunotherapies have emerged as a selective approach for autoimmune diseases by inducing tolerance while mitigating global immunosuppression. We previously reported SAgAs with multiple copies of a multiple sclerosis (MS) autoantigen grafted onto hyaluronic acid (HA) as an efficacious therapy in experimental autoimmune encephalomyelitis. While the immune response of MS is distinct from T1D, the mechanism of SAgAs was hypothesized to be similar and via induction of immune tolerance to diabetes antigens. We synthesized SAgAs composed of HA polymer backbone conjugated with multiple copies of the T1D autoantigen mimotope p79 using aminooxy chemistry (SAgAp79) or using copper-catalyzed alkyne-azide cycloaddition (cSAgAp79) chemistry. SAgAs constructed using the hydrolyzable aminooxy linkage, thus capable of releasing p79, exhibited physicochemical properties similar to the triazole linkage. Both SAgAp79 versions showed high specificity and efficacy in stimulating epitope-specific T cells. SAgAs can be taken up by most immune cell populations but do not induce their maturation, and conventional dendritic cells are responsible for the brunt of antigen presentation within splenocytes. cSAgAp79 was more stimulatory than SAgAp79 both in vitro and in vivo, an effect that was ascribed to the peptide modification rather than the type of linkage. In summary, we provide here the first proof-of-principle that SAgA therapy could also be applicable to T1D.
Graphical Abstract
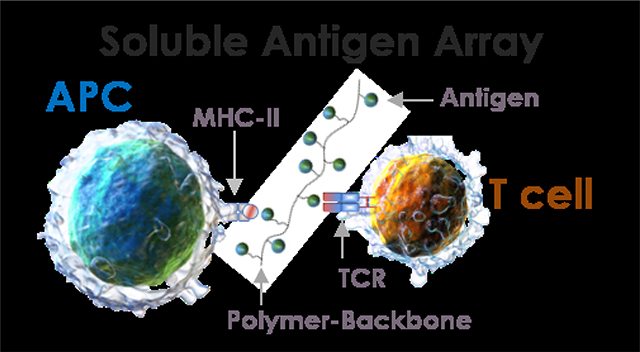
Soluble Antigen Arrays have high specificity and efficacy in stimulating epitope-specific T cells, via T-cell receptors (TCRs), without directly promoting antigen presenting cell (APC) maturation.
INTRODUCTION
Type 1 diabetes (T1D) is an autoimmune disease that affects 2 in 1000 children and young adults.1 It is an aggressive and devastating form of diabetes caused by an aberrant immune response resulting in T cell-mediated destruction of insulin-producing beta cells in the pancreas. The cause for the development of T1D is still unknown but a combination of genetic and environmental factors increase the susceptibility of developing the disease.1, 2 Advancements over the last few decades have led to new diagnostics tools, novel therapies for managing the disease, and the discovery of causative antigens. Recent research has aimed to deliver antigens in a format that induces antigen-specific tolerance.3, 4 Peptide-based approaches are more selective than protein-based therapies for delivery of specific epitopes including mimotopes, which target T cell clones for which the natural epitope is not known or for which the known epitope is recognized with poor affinity. However, a drawback of the administration of peptides in vivo is their rapid diffusion and dilution, which may result in insufficient uptake on a per cell basis.
Many current approaches to antigen-specific immunotherapy (ASIT) exhibit characteristics similar to traditional vaccines. Vaccines are typically particulate and designed to initiate a directed adaptive immune response to specific antigens in order to elicit a robust “protective” immunological response upon re-challenge. Conversely, allergy shot therapies use soluble allergens to hyposensitize the immune response and establish tolerance.5 This is typically accomplished by delivering low doses of soluble antigens via subcutaneous (s.c) injection over an extended period of time. Allergen-specific immunotherapies are known to hyposensitize immune responses, thus providing a potential benchmark for design of ASIT delivery systems for autoimmune diseases that has yet to be explored.6
SAgAs have been designed to bundle peptides / proteins together for more efficient uptake in vivo and, in some cases, achieve multivalent engagement of B cells.7, 8 In addition, SAgA uptake results in epitope presentation to targeted T cells in the absence of costimulation or proinflammatory cytokines, which may induce antigen-specific immune tolerance as a way to treat T1D. SAgAs are constructed using a hydrophilic linear polymer, hyaluronic acid (HA), grafted with multiple repeating epitopes from an autoantigen. Unlike particulate antigen delivery systems (i.e., nanoparticles, microspheres), SAgA size and solubility are more likely to drain from the injection site to the regional and systemic lymphoid tissues. Particle antigen delivery systems are also innately more ridged with fixed spacing and positioning of ligands, while SAgAs are flexible and capable of contouring the receptor spacing on the cell surface. Thus, SAgAs may improve receptor binding avidity as a result flexibility to allow for a greater number of interactions with the cell surface to bind and cluster receptors.9–16
We have previously reported utilizing soluble antigen arrays (SAgAPLP) constructed by conjugating multiple repeating copies of autoantigen proteolipid protein peptide (PLP139–151) to HA to induce tolerance in a multiple sclerosis (MS) mouse model known as experimental autoimmune encephalomyelitis (EAE). Both the hydrolyzable linked molecule SAgAPLP (i.e. releasable epitope) and nonhydrolyzable “clicked” molecule cSAgAPLP (i.e. non-releasable epitope) were able to cause B cell anergy, which was induced by BCR engagement and clustering in in vitro studies and suppressed EAE disease symptoms. cSAgAPLP showed enhanced efficacy when compared to SAgAPLP, possibly due the more stable covalent linkage in cSAgAPLP.7, 17–23
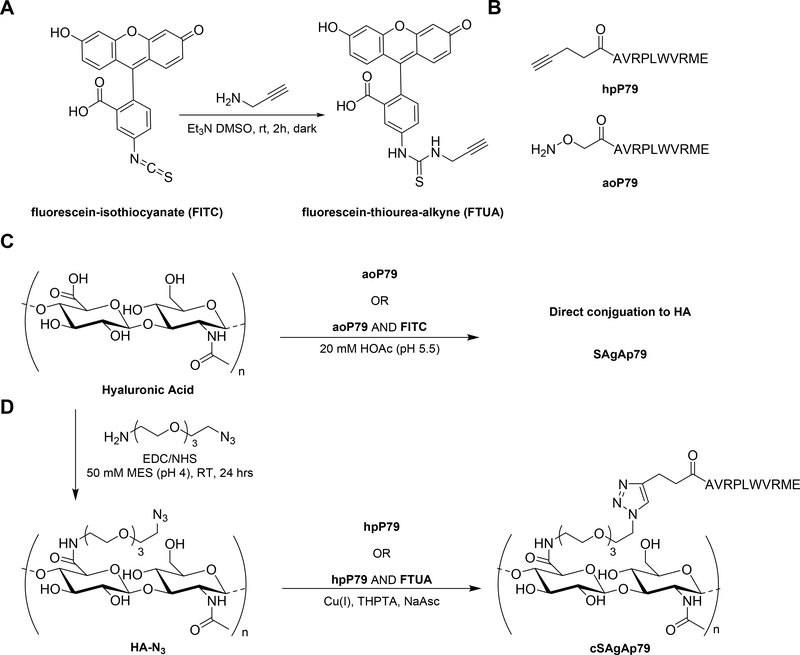
While the immune response of MS is distinct from T1D, the mechanism of SAgAs offers a general strategy for the delivery of autoantigens. Here, we tailored SAgA technology as an ASIT for T1D. We synthesized two versions of SAgAs composed of HA polymer backbone with multiple repeating copies of the T1D autoantigen-related mimotope p79 (AVRPLWVRME) employing either a degradable or covalent linker. The p79 mimotope presented on the I-Ag7 MHC class II of non-obese diabetic (NOD) mice is recognized by CD4+ T cells from BDC2.5 T cell receptor (TCR) transgenic mice.24 These T cells have been identified as islet-infiltrating T cells25 and shown to also respond to the WE14 peptide from ChgA that has been modified by transglutaminase26 and to hybrid insulin peptides resulting from the fusion of insulin C peptide and WE14 (aka 2.5HIP).27 These T cells are pathogenic and rapidly initiate disease when transferred as activated cells in NOD mice or as naïve T cells in NOD.SCID mice.28, 29 Importantly, similar BDC2.5 T cell-targeting mimotope peptides have demonstrated potential to induce tolerance.30, 31 In addition, these endogenous p79-reactive CD4+ T cells are also readily identifiable in peripheral lymphoid tissues of NOD mice using MHC tetramers.27
The SAgAs were constructed via aminooxy chemistry (hydrolyzable: SAgAp79) or copper-catalyzed alkyne-azide cycloaddition (CuAAC) chemistry (nonhydrolyzable: cSAgAp79) and immune cell responses were elucidated (Scheme 1). The specificity and efficiency of T cell stimulation by these SAgAs was demonstrated by in vitro treatment of splenocytes from BDC2.5 versus NOD mice, and we identified conventional dendritic cells (cDCs) as the most efficient type of antigen-presenting cells (APCs) responsible for the presentation of SAgA-derived epitopes to T cells. We also observed that SAgAs do not induce APC maturation. In vivo, SAgAs efficiently distributed to different lymphoid tissues, inducing a similar response in draining and more distal lymph nodes, as well as in spleen. In summary, our results show that both types of SAgAs containing multiple copies of p79 can efficiently stimulate antigen-specific autoreactive T cells both in vitro and in vivo, and that in both settings, cSAgAp79 were more stimulatory than SAgAp79.
Scheme 1:
Synthesis of SAgA and cSAgA components and molecules: (A) Alkyne-functionalization of fluorescein isothiocyanate; (B) Structures of homopropargyl-modified peptide (hpP79) and aminooxy-modified peptide (aoP79); (C) Hydrolyzable soluble antigen array (SAgA); (D) “Click” soluble antigen array (cSAgA)
RESULTS & DISCUSSION
Analytical Characterization of Soluble Antigen Arrays
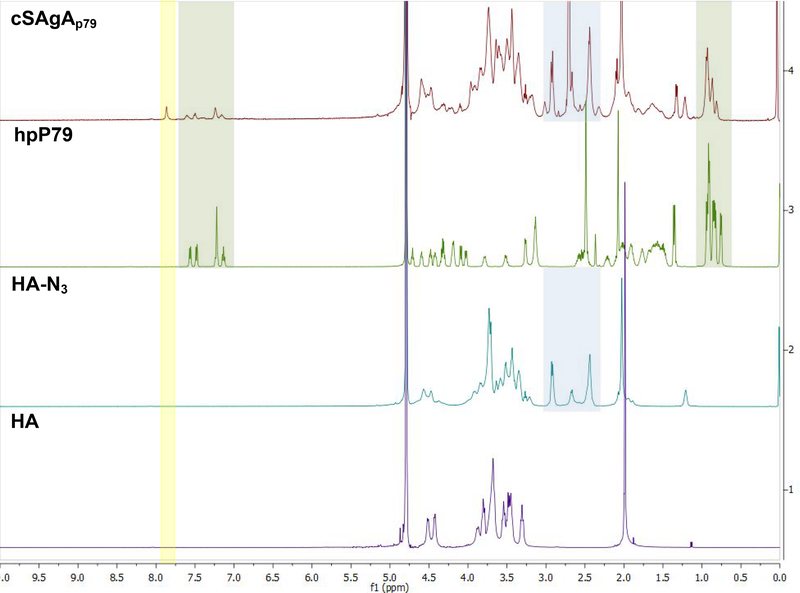
Hydrolyzable multivalent soluble antigen arrays (SAgAp79) capable of antigen release and the nonhydrolyzable (cSAgAp79) version were synthesized by conjugating approximately 9–11 p79 peptides to a 16 kDa HA linear polymer. Seminal studies by Dintzis and others have suggested a multivalent linear polymer with a valency of 10–20 haptens and a molecular weight (MW) less than 100 kDa could induce immune tolerance.16, 32, 33 Characterization was completed using various analytical techniques. 1H NMR was utilized to confirm the successful CuAAC conjugation of all the starting materials to furnish cSAgAp79 (Figure 1). The peak at 7.8 ppm for cSAgAp79, highlighted in yellow, is consistent with previously reported proton chemical shift for a triazole proton. This peak was not seen in any of the starting materials since it can only form after the successful CuAAC reaction between the azide (HA-N3) and alkyne (hpP79). Resonance of both starting materials are seen in the final product highlighted in green (hpP79), purple (HA-N3), and blue (PEG3).
Figure 1:
1H NMR spectra of starting materials and the reaction product. Resonances from the peptide starting materials are present in the final compound cHAP79. A new peak only found in the product is highlighted in light yellow.
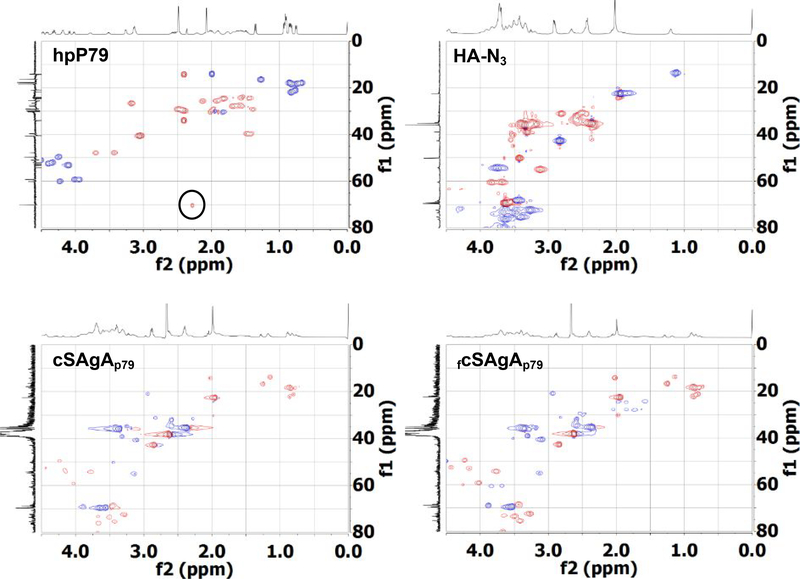
1H/13C Heteronuclear Single Quantum Coherence (HSQC) NMR spectroscopy was used to confirm the existence of resonances present in peptide sample hpP79 and HA-N3, which were carried over to the final dialyzed products cSAgAp79 and fcSAgAp79. These experiments affirm the complete absence of the terminal alkyne resonance from the terminal alkyne of the homopropargyl linker on the mimotope (δ(1H) ≈ 2.9 ppm, δ(13C) ≈ 70 ppm) in both the fluorescent and non-fluorescent SAgAp79 products (Figure 2). These experiments in combination with the 1H NMR confirm the final product contains only the conjugated peptide of nonhydrolyzable cSAgAs. 1H NMR was not used to confirm successful conjugation of hydrolyzable SAgAp79 due lack of material. Previous publication confirm RP-HPLP is sufficient to demonstrate successful conjugation.7, 8
Figure 2:
HSQC NMR spectra of starting materials and the product fcSAgAp79 and cSAgAp79. Resonances from the peptide starting materials are present in the final compounds for both cSAgAp79 and fcSAgAp79. The alkyne peak found only hpP79 is not found in any of the products, which implies complete no residual unconjugated p79.
Quantitative analysis of peptide conjugation efficiency was done using a RP-HPLC by measuring the decrease in peak area of the peptide throughout the course of the reaction (Figure S1: Supplementary Info). In CuAAC chemistry, Cu1+, which is a catalyst that allows the reaction to proceed, is generated in situ upon the addition of NaAsc, the reducing agent, to an inactive Cu2+ in solution. An aliquot of the reaction mixture was removed before the final NaAsc addition step, for HPLC analysis to establish a baseline response correlating to the molar excess of peptide used in the reaction. Thus, following the addition of NaAsc, any decrease in peak area of free alkyne-containing peptide (hpP79) was attributed to conjugation. A small aliquot pre-NaAsc was taken from the reaction mixture as a control sample. hpP79 displayed <5% degradation (2.7%) at 37°C for 24 hours, demonstrating a minimal impact of peptide degradation on the accuracy of the analytical methodology. Quantitative analysis of peptide conjugation efficiency for cSAgAp79 was done by analyzing 1H NMR (Figure S2).
Bioconjugation optimization, which is required to achieve the desired peptide conjugation to HA-N3 (~10 peptides), was performed by testing various conditions such as buffer type, temperature, reactant concentrations, and molar excess of free peptide. From these observations, the desired peptide valency in cSAgAp79 (9–11 p79) and fcSAgAp79 (7:1; p79:FTUA) were identified. Similar to CuAAC reaction, the aminooxy reaction was tracked by measuring the decrease in peptide. Unlike the CuAAC, milder conditions were used, thus negligible degradation of peptide was seen via RP-HPLC. The reaction between aoP79 and HA was a one-step reaction resulting in the final desired peptide valence of SAgAp79 (10 p79) and fSAgAp79 (8:2; p79:FITC) (See Table 1 for more information). The increased retention time of the bioconjugates following peptide conjugation (Figure S1) was consistent with increased product hydrophobicity. The hydrophilic polymer backbone comprises only ~32% by mass of the SAgA but has a significant effect on hydrophilicity. Negligible degradation of peptide was seen via RP-HPLC. The reaction between aoP79 and HA was a one-step reaction resulting in the final desired peptide valence of SAgAp79 (10 p79) and fSAgAp79 (8:2; p79:FITC) (See Table 1 for more information).
Table 1.
Peptide molar conjugation of hydrolyzable and click conjugates, as determined by RP- HPLCa. Dynamic light scattering (DLS) of SAgAs and components.
| Sample | Approx. MW (kDa)b | Average Molar Ratio per Polymerc | DLS de | ||
|---|---|---|---|---|---|
| P79: HA | DYE: HA | Radius (nm) | %Polydispersity | ||
 |
1.335 | 0 | 0 | 0.82 ± 0.02 | 0.14 |
 |
1.3287 | 0 | 0 | 0.82 ± 0.02 | 0.04 |
 |
1.3287 | 0 | 0 | NA | NA |
 |
24.5 | 0 | 0 | 6.5 ± 0.03 d | 0.25 d |
| 16.0 | 0 | 0 | 7.3 ± 0.03 d | 0.57 d | |
 |
39.7 | 10.7f | 0 | 9.26 ± 1.45e | 0.85e |
 |
33.8 | 7 | 1 | NA | NA |
 |
27.99 | 9.6 | 0 | 9.02 ± 0.28e | 0.64e |
 |
30.1 | 8.2 | 1.8 | NA | NA |
 |
30.1 | 10 | 0 | NA | NA |
Results are an average of triplicate injections from a single batch preparation. In the molecule schematics, dotted lines represent hydrolyzable oxime linker chemistry while solid lines represent nonhydrolyzable ‘click’ linker chemistry.
Calculated from RP-HPLC data. MW, molecular weight.
HA, hyaluronic acid; p79
DLS data were collected in triplicate
Malvern Zetasizer DLS were collected in quadruplicate
The average molar ratio determined using HPLC was used when calculating dose.
NA: not assessed
 represents fluorescent dye.
To better understand the biophysical properties of the SAgAs, a few experiments were performed at physiologically relevant pH (7.4). Circular dichroism (CD) experiments were performed to evaluate the secondary structure of the bioconjugates (Figure 3A,B). CD revealed no significant secondary structure for the non-peptide components found in the SAgAs (data not shown), which include HA, HA-N3, triazole, FTA, and FTUA. The CD spectra of hpP79 and aoP79 both exhibited the presence of random coil, which is consistent with small peptide secondary structure in literature.34 However, the modified peptides secondary structures were different, possibly because of the differences in the hydrophobicity of the modification.
Figure 3:
Far-UV Circular Dichroism of cSAgAp79 (A) and SAgAp79 (B)
Both cSAgAs (Figure 3A) also exhibited a random coil structure but differ slightly from their parent peptide (hpP79). This may be due to the conjugation of peptides to HA resulting in loss of rotational freedom and decreased entropy of peptides in solutions. Both SAgAp79 and aoP79 showed similar secondary structure to the cSAgAs (Figure 3B). The loss of the hydrophobic homopropargyl linker upon conjugation to HA-N3 makes the cSAgAs more hydrophilic, which may explain the similar secondary structure to both aoP79 and SAgAp79. fSAgAp79 did not follow this trend. Experiments studying the intrinsic fluorescence of the SAgA revealed no transition state change, and fcSAgAp79 showed a significant difference in intensity due to the conjugated fluorophore (Figure S2). Finally, DLS data (Table 1) revealed reasonable increases in size of SAgAs compared to starting materials. Interestingly, HA (16 kDa) when compared to HA-N3 (24.5 kDa) was shown to be larger with the radii being 7.3 nm and 6.5 nm respectively. Both SAgAs showed similar size at physiological pH (7.0) and high heterogeneity.
Specificity of T cell Responses to SAgA-derived Epitopes
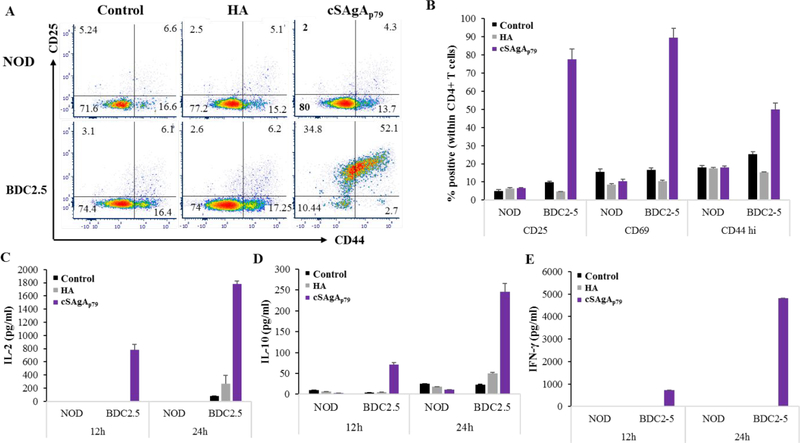
To validate the ability of the p79 epitopes grafted on SAgAs to elicit an antigen-specific T cell response, we cultured splenocytes from NOD and BDC2.5 mice with cSAgAp79 or with the corresponding ‘naked’ HA molecule. The specificity was demonstrated by both the lack of response of BDC2.5 T cells to HA and the lack of response of NOD T cells to cSAgAp79 in terms of activation markers (Figure 4A,B) and cytokine production (Figure 4C–E).
Figure 4:
Antigen-specific CD4+ T cells responses to cSAgAp79 in vitro. Representative plots (A) and summary of triplicates samples (B) showing upregulation of CD25, CD44 and CD69 in CD4+ T cells from BDC2.5 mice as compared NOD mice after 12h of culture. (C-E) Cytokine secretion at 12h and 24h of culture: IL-2 (C), IL-10 (D) and IFN-γ (E). The values are given as mean ± SD (n=3 technical replicates).
Uptake of SAgAs by different Spleen Cell Populations
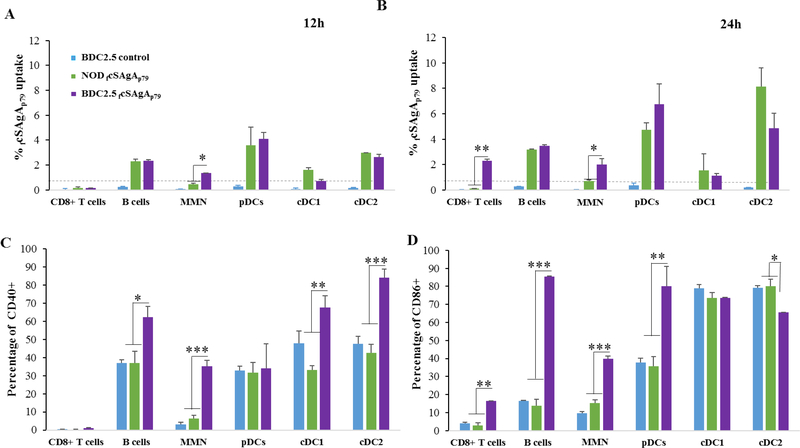
We then used FITC-conjugated SAgAs to compare the ability of different cell populations within the spleen to capture SAgAs (Figure S3). After up to 24h incubation in vitro, splenocytes were analyzed for FITC uptake. As early as 12h, all APC populations (B cells, macrophages/monocytes, pDCs and cDCs) but not T cells from both NOD and BDC 2.5 splenocytes were found to take up SAgAs (Figures 5A and S4A,B). However, enhanced uptake by myeloid non-DCs (macrophages / monocytes / neutrophils) from BDC2.5 splenocytes was observed as early as 12h as compared to myeloid non-DCs from NOD splenocytes. At later time point(by 24h), the uptake of SAgA was further enhanced for other cells including T cells (Figure 5B and S4A,B). Given that T cell activation was evident as early as 12h with BDC2.5 splenocytes (Figure 4), we hypothesized that antigen-specific T cell activation (possibly through cytokine release) stimulated other immune cells, leading to increase endocytosis. Indeed, the increased uptake of SAgA by BDC2.5 splenocytes was associated with increased expression of the maturation molecules CD40 and CD86 at 12–24h (Figures 5C,D and S5) and increased cell size at 24h (Figures S4A vs S4B).
Figure 5:
Uptake efficiency of fcSAgAp79 (1 μM) by different APCs at 12h (A) and 24h (B) time points and upregulation of costimulatory molecules CD40 (C) and CD86 (D) at 24h in splenocytes from BDC2.5 as compared to NOD or untreated control splenocytes. Control cells from NOD mice are not shown (comparable to BDC2.5 control). The values are given as mean ± SD (n=3 technical replicates) and the data are representative of two experiments performed with fcSAgAp79, and experiments performed with FITC-conjugated SAgAp79. MMN: monocytes, macrophages, neutrophils.
Importantly, SAgAs were not directly responsible for APC maturation because they had no effect on NOD splenocytes in terms of CD40/CD86 expression (Figures 5C,D and S5) and cell size (Figure S4A vs S4B). Thus, these SAgAs do not have inherent immunogenic adjuvant properties, a prerequisite for tolerance induction.
Presentation of SAgA-derived Epitopes by Spleen APCs
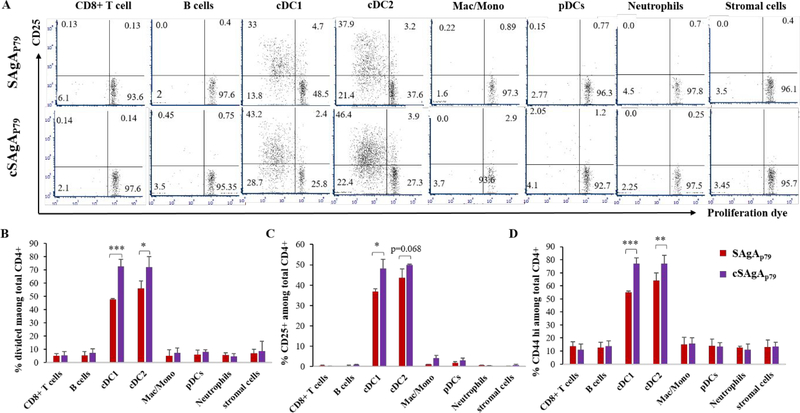
Given that most cell types were able to take up SAgAs provided at high dose (100 nM − 1 μM), we then asked what APC subsets are most effective at processing and presenting SAgA-derived epitopes, using a limiting dose (1 nM) that would be more consistent with in vivo conditions. Following culture of NOD splenocytes with SAgAp79 or cSAgAp79 (no noticeable T cell response), the cells were sorted into 8 populations, as shown on Figure S6, and each purified population was cocultured with purified CD4+ CD25- T cells from BDC2.5 mice. Antigen-specific T cell stimulation was only detected with cDC subsets (Figure 6). Moreover, cSAgAp79 was more stimulatory than SAgAp79 (Figure 6). This was somewhat surprising as epitopes were not expected to be released as easily with the covalent link relative to the hydrolyzable link for processing.
Figure 6:
Conventional DCs (cDC1 and cDC2) most efficiently present epitopes from SAgA to CD4+ T cells as compared to other APCs. Representative dot plots depicting proliferation and CD25 upregulation by antigen-specific BDC2.5 CD4+ T cells (A), and summary bar graphs of BDC2.5 CD4+ proliferation (B) and upregulation of CD25 (C) and CD44 (D). The values are given as mean ± SEM (n=3 culture replicates).
Stimulatory Activity of SAgA Variants and their Corresponding Peptides in vitro
In the light of apparent stimulatory superiority of cSAgAp79 over SAgAp79, we conducted a titration of these two SAgAs along with their respective peptides, which had different modifications prior to grafting to HA. CD4+ T cells (10%; from BDC2.5 mice with IL-10/GFP reporter) were diluted with non-specific T cells (90%; from NOD.CD45.2 mice) serving as internal negative controls for T cells (gating strategy shown on Figure S7A).
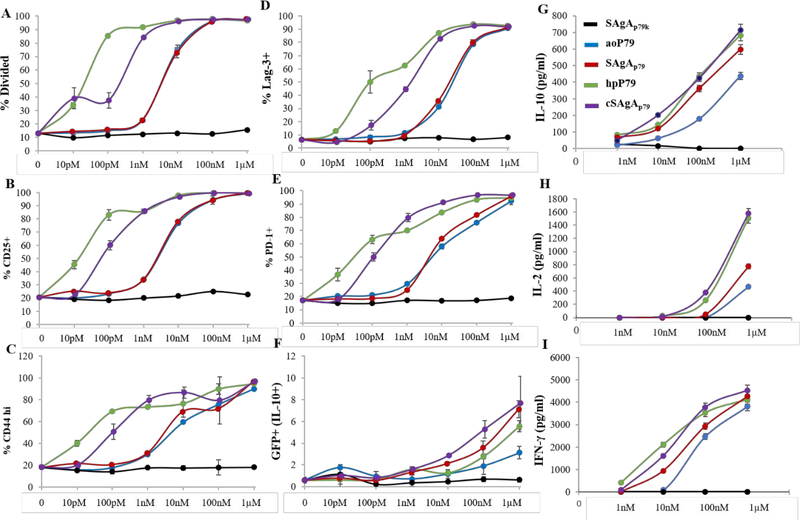
As negative control for antigen, we used SAgAp79k containing an immunologically inactive (“killed”) version of p79 with two amino acids permuted (p79k). Soluble peptides (aoP79 used to make SAgAp79 and hpP79 used to make cSAgAp79) were compared with the non-modified p79 and mixed together with the HA molecule used to make SAgA (HA with p79 and aoP79 and HA-N3 with hpP79). Because each SAgA molecule bears ~10 peptides, we represented all concentrations as peptide-equivalent (e.g. 1 nM SAgA = ~10 nM peptide), and for free peptide / HA mixtures, we used 10-fold less HA than peptide to achieve the same relative amount of peptide as with SAgAs. The controls SAgAp79k and p79k+HA did not induce any T cell response (Figures 7 and S7), again highlighting the highly specific nature of the response. SAgAp79 and peptides p79 and aoP79 induced a similar T cell response (based on proliferation and surface markers) that was most evident at 1–10 nM, while cSAgAp79 and its peptide hpP79 were the most stimulatory, with T cell responses measurable at 10–100 pM (Figures 7A–E and S7).
Figure 7:
Dose-response curves of BDC2.5 CD4+ T cell responses (gated on CD45.1+ cells) induced by SAgAp79 and cSAgAp79 compared to their respective peptide aoP79 and hpP79 after 3 days in vitro culture: proliferation based on VCPD dilution (A), upregulation of CD25 (B), CD44 (C), Lag-3 (D), PD-1 (E), and IL-10/GFP (F), secretion of IL-10 (G), IL-2 (H) and IFN-γ (I). The values are given as mean ± SD (2–3 culture replicates per experiment). Data are representative of 2–3 experiments for each molecule with at least two batches tested for most molecules showing comparable results. In other experiments, the free peptide was consistently more potent than its corresponding SAgA.
We generally found that the free peptide was more stimulatory than its SAgA form at equivalent concentrations (Figure 7). However, at higher doses, SAgAs induced a greater PD-1 and IL-10/GFP upregulation than their respective free peptide (Figure 7E,F and S7). No significant stimulation was observed in bystander T cells (polyclonal T cells from NOD.CD45.2 mice; Figure S7H,I). The cytokine response required higher doses of peptide or SAgA (at least 10 nM for IL-10 and IFN-γ, and 100 nM for IL-2), and in this case, SAgAs were at least as stimulatory if not better than their corresponding free peptide (Figure 7F–I). Overall, the results suggested that cSAgAp79 is more potent than SAgAp79 not because of the difference in release mode but rather because of the N-terminal modification of p79. Furthermore, both SAgAs promoted the upregulation of immune checkpoint receptors like PD-1 and Lag-3 in vitro (Figures 7D,E and S7H), which may help predispose the targeted T cells to tolerance induction by their ligands.
Antigen Biodistribution and their Engagement with Antigen-Specific T Cells in vivo
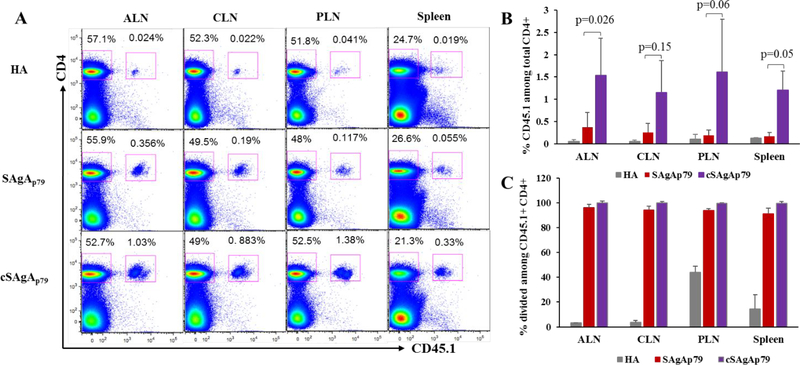
To validate the in vitro specificity and stimulatory capacity of SAgA variants in inducing T cell responses, we studied their biodistribution in various lymphoid tissues in vivo, based on engagement of antigen-specific T cells. To that end, antigen specific CD45.1+ CD4+ CD25- T cells were purified from BDC2.5 TCR transgenic mice and adoptively transferred into recipient CD45.2 mice. Analysis of T cell responses by FCM revealed that both SAgAp79 and cSAgAp79 induced effective antigen-specific T cell responses (expansion and proliferation of donor specific T cells) in all lymphoid tissues investigated after s.c. injection, suggesting drainage and presentation of SAgA-derived peptides to T cells in broad anatomical locations (Figure 8 and S8A,B). In contrast, there was no change in the percentage of recipient CD4+ T cells (CD45.2+ CD4+ T cells) among all the three groups (Figure S8C), highlighting specificity of both SAgA variants. Consistent with the in vitro T cell responses results, in vivo expansion of antigen-specific T cells was higher in mice treated with cSAgAp79 as compared to SAgAp79 or HA treated mice in all lymphoid tissues investigated (Figure 8A,B). Moreover, while both SAgA variants induced proliferation of donor CD4+ T cells, those responding to cSAgAp79 proliferated to a greater extent (Fig.S8A,B).
Figure 8.
In vivo expansion of transferred BDC2.5 CD4+ T cells in response to SAgAp79 and cSAgAp79 as compared to HA control in: axillary lymph nodes (ALN), cervical lymph nodes (CLN), pancreatic lymph nodes (PLN) and spleen, 5 days after s.c. injection (0.5nmol each). (A) Representative dot plots showing expansion of transferred antigen-specific CD4+ T cells. (B) Percentage of donor CD45.1+ cells among total CD4+ T cells. (C) Expansion of donor CD4+ T cells in PLN of HA-treated mice is the default response of these T cells to islet-derived endogenous antigens due to close proximity to islets. Bar graphs show the mean ± SD (n=3 mice). Student’s t-test was used to determine the p values.
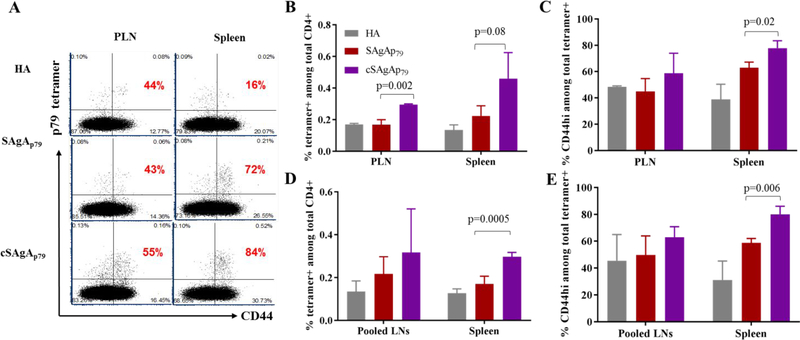
To further confirm the stimulatory activity of each SAgA variant and the location of T cell responses in a more physiological setting in vivo, we analyzed p79-reactive tetramer+ cells in PLN and spleen after s.c. injection. Both variants of SAgA induced antigen-specific T cell responses (upregulation of CD44 among tetramer+ CD4+ T cells) as compared to HA control in both tissues, suggesting effective drainage of SAgAs into PLN and spleen for presentation by APCs to T cells. However, cSAgAp79 induced higher percentage of tetramer+ CD44hi CD4+ T cells as compared to SAgAp79 or HA control (Figure 9A–C). We repeated the treatment for a longer period of time (~1 month with 3 weekly injections), and while both SAgAs induced significant number of tetramer+ CD4+ T cells (with increased CD44 expression) in pooled lymph nodes and spleen, cSAgA again was found to be more stimulatory (Figure 9D,E and S9A). Treatments with SAgAs had no effect on non-specific T cells (Figure S9B–E). Altogether, the data suggest that both variants of SAgA distribute widely through regional and distal lymphoid tissues and elicit antigen-specific T cell responses, which were of greater magnitude in the case of cSAgA.
Figure 9:
In vivo p79-specific T cell responses to SAgAp79 and cSAgAp79 as compared to HA control analyzed with 2.5/p79 MHC tetramer. (A) Representative dot plots showing tetramer+ T cells and their expression of activation marker CD44 (gated on CD4+ T cells) in PLN and spleen, three days after two s.c. injections, three days apart. The percentage of CD44hi cells among tetramer+ CD4+ T cells is indicated in red on each plot. (B,C) Increased frequency of p79-specific endogenous CD4+ T cells (B), and percentage of CD44hi cells among them (C) under the same conditions as (A). (D,E) Increased frequency of p79-specific endogenous CD4+ T cells (D), and percentage of CD44hi cells among them (E) in pooled lymph nodes and spleen, three days after 3 weekly s.c. injections. Bar graphs show the mean ± SD (n=3mice). Student’s t-test was used to determine the p values.
Both hydrolyzable and nonhydrolyzable SAgAs were characterized and evaluated in vitro as therapeutic agents to target diabetogenic BDC2.5 T cells as representative autoreactive T cells in the NOD mouse model of T1D. Biophysical properties of both versions of non-fluorescent SAgA varied slightly. CD spectra for both hydrolyzable SAgAp79 and nonhydrolyzable cSAgAp79 were shown to be similar to the aoP79 modified mimotope. Neither appeared to have any transition state when tested via a temperature fluorescent gradient.
Our in vitro immunoassays demonstrated that SAgA-derived epitopes were efficiently presented to specific T cells. T cell responses were generally greater with soluble peptide because of the high local concentration at which some free peptide may directly bind to MHC-II via spontaneous peptide exchange, whereas SAgAs likely require endocytosis, degradation and processing before loading onto MHC. We initially postulated that the distinct peptide grafting chemistries between SAgAp79 and cSAgAp79 would influence their immunological properties. Indeed, the ability of SAgAs to bring in bundled peptides inside the cells and release them should be affected by the balance of extracellular versus endosomal degradation. Excessive extracellular degradation could reduce the overall peptide uptake while insufficient endosomal degradation could limit peptide loading onto MHC. Hydrolyzable SAgAs are expected to release their peptide cargo under the endosome’s low pH, while the covalent linker is not expected to be broken down by any known enzymes. Both SAgAs and cSAgAs are susceptible to degradation at the level of the HA backbone by extracellular and endolysosomal hyaluronidases. Thus, differences in stimulatory activity may be determined by how much peptide is effectively taken up and loaded on MHC. However, when comparing the stimulatory activity of two modified peptides used to produce these two forms of SAgAs, namely the aminooxy and alkyne versions, we observed that the alkyne form of the peptide was also significantly more stimulatory. While the N-terminal aminooxy residue did not seem to have any effect on T cell stimulation relative to the unmodified p79 peptide, the N-terminal alkyne could possibly alter the interaction with the MHC-II molecule such that the peptide’s orientation is changed and interaction with the BDC2.5 TCR is enhanced. Interestingly, both hpP79 and cSAgAp79 are more stimulatory, suggesting that both the alkyne motif (C≡C) and the C2N3 cycle resulting from reaction with azide would have the same effect on tweaking the overall epitope conformation.
More studies will be required to understand this surprising superior stimulatory effect of both the alkyne-modified peptide and its SAgA and evaluate their therapeutic efficacy in preclinical studies in T1D models. While in vitro stimulation was expected to favor soluble peptides for the reasons provided above, it is expected that SAgAs will be more stimulatory than free peptides in vivo due to reduced diffusional loss, greater peptide uptake and improved lymph node drainage. More stimulatory SAgAs may have utility to achieve good T cell engagement with lower dose. Indeed, most autoreactive T cells have low TCR affinity, and antigen-specific therapies, unlike conventional vaccines, do not contain adjuvants that boost APC-T cell interactions via upregulation of MHC, costimulatory and adhesion molecules. Thus, enhancing epitope recognition may be required to improve engagement of autoreactive T cells, and mimotopes with better affinity than native peptides can achieve better induction of tolerance in vivo.35
CONCLUSION
ASIT may one day offer a means to treat autoimmune diseases by using autoantigens to induce immune tolerance. To date, formulations of autoantigens have been minimally effective in preventing or treating diseases such as T1D. SAgAs offer a new approach wherein multiple copies of epitopes or whole autoantigens can be grafted onto HA to promote the desired immune responses in draining lymphoid organs or in tissues containing autoreactive immune cells, such as T and B cells. In this work, SAgAs displaying multiple copies of the T1D autoantigen mimotope p79 were linked to HA using aminooxy chemistry (i.e. releasable mimotope, SAgAp79) or using copper-catalyzed alkyne-azide cycloaddition chemistry (i.e. non-releasable mimotope, cSAgAp79). Both versions showed high specificity and efficacy in stimulating epitope-specific T cells without directly promoting APC maturation. Conventional dendritic cells were predominantly responsible for antigen presentation within splenocytes derived from NOD mice. The cSAgAp79 was able to stimulate cognate T cells more potently than SAgAp79. The specificity of SAgAs displaying the p79 mimotope provide here the first proof-of-principle that SAgA therapy could be applicable to T1D prevention or therapy.
METHODS
Chemical Synthesis
N-(3-dimethylaminopropyl)-N′-ethylcarbodiimide hydrochloride (EDC), 2-(N-morpholino)ethane-sulfonic acid sodium salt (MES), tris(3-hydroxypropyltriazolylmethyl)amine, sodium ascorbate (NaAsc), and Propargyl-N-hydroxysuccinimidyl ester were purchased from Sigma-Aldrich (St. Louis, MO) and used as received without further purification. Hyaluronic acid sodium salt (MW 16 kDa) was purchased from Lifecore Biomedical (Chaska, MN). 11-azido-3,6,9-trioxaundecan-1-amine (NH2-PEG3-N3), N-hydroxysuccinimide, Copper (II) sulfate pentahydrate (CuSO4 • 5H2O) was purchased from Acros Organics (Geel, Belgium). Alkyne-functionalized peptide bearing an N-terminal 4-pentynoic acid (homopropargyl, hp) modification, hpP79 (hp-AVRPLWVRME-OH), aoP79 (aminooxy-AVRPLWVRME-OH) and an immunologically killed version (with two permuted amino acids) AVPRLWVRME (p79k) were obtained from Biomatik USA, LLC (Wilmington, DE).
Synthesis and Labeling of Soluble Antigen Arrays
Hydrolyzable SAgAp79 and its fluorescein isothiocyanate (FITC)-labeled version (fSAgAp79), nonhydrolyzable cSAgAp79 and its fluorescein thiourea-labeled (fcSAgAp79) were synthesized and characterized as previously reported. Peptide conjugation was determined through gradient reverse-phase analytical high-performance liquid chromatography (RP-HPLC).
Synthesis of Fluorescein Thiourea Alkyne (FTUA)
Synthesis of 2-(6-hydroxy-3-oxo-3H-xanthen-9-yl)-5-(3-(prop-2-yn-1-yl)thioureido) benzoic acid (fluorescein thiourea alkyne; FTUA; Scheme 1A) was adapted from Meng et al.36 Triethylamine (75 μL, 0.514 mmol) was added to a mixture of Fluorescein isothiocyanate (FITC) (200mg, 511.4 μmol) and 1-amino-11-azido-3,6,9-trioxa-undecane (131mg, 119.09 μL, 0.616 mmol) in DMSO (1 mL) and the mixture was stirred for 2 h at room temperature in the dark. The reaction mixture was then frozen at −20°C and lyophilized to afford a red oil. The crude product was dissolved in DMSO and purified by preparative RP-HPLC (Waters XBridge C18, 5 μm, 10×250 mm, linear gradient from 5–95% MeCN (+ 0.05% TFA) in H2O (+ 0.05% TFA) over 20 minutes, detection at 280 nm) to give the final product (176.5 mg, 77%) as an orange-yellow powder; 1H NMR (500 MHz, DMSO-d6) δ 7.82–7.78 (m, 1H), 7.83–7.77 (m, 2H), 7.05–7.00 (m, 1H), 6.42–6.26 (m, 6H), 7.11 (d, J = 2.4 Hz, 1H), 7.08 (d, J = 2.4 Hz, 1H), 7.03 (s, 1H), 7.00 (s, 1H), 6.97 (d, J = 2.4 Hz, 1H), 3.65 (q, J = 7.14, 7.06, 7.06 Hz, 2H), 3.77 (d, J = 2.5 Hz, 2H), 2.70–2.63 (m, 8H), 2.66 (t, J = 2.5, 2.5 Hz, 1H)1.08 (t, J = 6.95, 6.95 Hz, 12H): HRMS expected [M+H]+: 445.0853, found: 445.0858.
Synthesis of Azide Functionalized Hyaluronic Acid (HA-N3)
Synthesis of HA-N3 (Scheme 1A) was adapted from Hu et al and Di Meo et al.36, 37 Sodium hyaluronate (93.9 μmol, 16 kDa average MW) was added to a 250 mL round bottom flask with stir bar, followed by 100 mL of 50 mM MES buffer (pH = 4.0). The mixture was stirred until in solution (~15 minutes) before EDC (23.1 mmol) was added neat, then N-hydroxysuccinimide (18.8 mmol) added neat. The mixture was stirred for 5 minutes before H2N-PEG3-N3 (4.51 mmol) in 20 mL MES buffer was added. The solution was then stirred for 24 hours at room temperature before being dialyzed in 6–8 kDa cutoff dialysis tubing against 4.5 L of 1.0 M NaCl solution for 24 hours, then 4.5 L of deionized water (4 × 12 hours). The volume in the bag was then transferred to vials, frozen, and lyophilized to yield a white powder (1.61 g, 95.0%).
Synthesis of Nonhydrolyzable Soluble Antigen Arrays (cSAgAs p79)
HA-N3 (1.6 μmol) was added as a 30 μM solution in phosphate buffer (pH= 7.0) to a 250 mL round bottom flask with stir bar. Then hpP79 (40 μmol) was then added as a 3.52 mM solution in phosphate buffer (pH= 7.0), followed by a premixed solution of THPTA (70 μmol) and CuSO4 • 5H2O (14.5 μmol) in phosphate buffer (pH= 7.0). The solution was allowed to stir for 1–2 minutes before a 100 μL aliquot was removed for HPLC analysis. NaAsc (295 μmol) was then added to the reaction mixture as a 100 mM solution phosphate buffer (pH= 7.0). The reaction was allowed to 24 hours at room temperature. Additional 100 μL aliquots were removed throughout the course of the reaction to determine the extent of conjugation. Then the reaction solution was quenched by adding 0.5 mL of 50 mM EDTA, then transferred to 6–8 kDa dialysis tubing and dialyzed against 4.5 L of 1.0 M NaCl (3 × 8 hours), then 4.5 L of deionized H2O (6 × 8 hours). The volume in the bag was then transferred to vials, frozen, and lyophilized.
Synthesis of Nonhydrolyzable Fluorescent Soluble Antigen Arrays (fcSAgAs p79)
HA-N3 (2.0 μmol) was added as a 30 μM solution in phosphate buffer (pH= 7.0) to a 250 mL round bottom flask with stir bar. Then hpP79 (40 μmol) was then added as a 3.52 mM solution in phosphate buffer (pH= 7.0), followed by fluorescein thiourea alkyne (4 μmol), and then by a premixed solution of THPTA (70 μmol) and CuSO4 • 5H2O (14.5 μmol) in phosphate buffer (pH= 7.0). The solution was allowed to stir for 1–2 minutes before a 100 μL aliquot was removed for HPLC analysis. NaAsc (295 μmol) was then added to the reaction mixture as a 100 mM solution phosphate buffer (pH= 7.0). The reaction was allowed to 24 hours at room temperature. Additional 100 μL aliquots were removed throughout the course of the reaction to determine the extent of conjugation. Then the reaction solution was quenched by adding 0.5 mL of 50mM EDTA, then transferred to 6–8 kDa dialysis tubing and dialyzed against 4.5 L of 1.0 M NaCl (3 × 8 hours), then 4.5 L of deionized H2O (6 × 8 hours). The volume in the bag was then transferred to vials, frozen, and lyophilized.
Hydrolyzable Soluble Antigen Arrays (SAgAp79)
Single-step grafting of aminooxy peptides to 16 kDa HA was performed as described previously.22 Briefly, HA was dissolved in 20 mM acetate-buffered solution (pH 5.5 ± 0.1) and each aminooxy reactive peptide was added simultaneously. After addition of the peptides, the reaction solution was adjusted to pH 5.5 ± 0.1 and stirred at 500 rpm using a magnetic stir bar for 16 h at room temperature. The samples were then transferred to dialysis bags (MWCO 6000–8000 Da, Spectrum Laboratories, Inc., Rancho Dominguez, CA) and dialyzed against 2 L of deionized water for 24 h, with dialysis water exchanged every 6 h to remove unreacted peptides and residual buffer. After dialysis, the dialysate was frozen at −70°C and lyophilized.
Hydrolyzable Fluorescent Soluble Antigen Arrays (fSAgAp79)
Single-step grafting of aminooxy peptides to 16 kDa HA was performed as described previously.22 Briefly, HA was dissolved in 20 mM acetate-buffered solution (pH 5.5 ± 0.1) and aminooxy reactive peptide and FITC were added simultaneously. After addition of the peptides, the reaction solution was adjusted to pH 5.5 ± 0.1 and stirred at 500 rpm using a magnetic stir bar for 16 h at room temperature. The samples were then transferred to dialysis bags (MWCO 6000–8000 Da, Spectrum Laboratories, Inc., Rancho Dominguez, CA) and dialyzed against 2 L of deionized water for 24 h, with dialysis water exchanged every 6 h to remove unreacted peptides and residual buffer. After dialysis, the dialysate was frozen at −70°C and lyophilized.
Analytical Characterization of Click Soluble Antigen Arrays
NMR spectra were collected on a Bruker Avance AVIII 500 MHz spectrometer equipped with a dual carbon/proton cryoprobe, all samples were dissolved in 600 μL of D2O for examination. MestReNova 11.0 was used for NMR data analysis.
RP-HPLC analysis was done using a Waters Alliance HPLC system equipped with either a dual wavelength UV/Vis detector or diode array detector. For the quantitative determination of peptide conjugation by RP-HPLC, the following equation was used:
| Equation 1 |
where Ncon = number of conjugated peptides per backbone, npep = moles of peptide used in reaction, nHA = moles of HA-N3 used in reaction, Vpre = total reaction volume before NaAsc is added, Vsam = volume of “pre-NaAsc” sample removed from reaction mixture, PAt = measured peak area of peptide at time t, PAstart = measured peak area of free peptide before NaAsc is added to the reaction. General chromatographic conditions employed a Waters XBridge C4, 3.5 μm, 300 Å stationary phase under ion pairing (0.05% TFA in H2O and MeCN) mobile phase conditions, utilizing a linear elution gradient (5–70%) with detection at 214 nm.
Biophysical Characterization
Determination of peptide concentrations was done with ε280 nm (3 mL⋅g−1⋅cm−1) for p79. For derivatized polymers, the concentrations were determined on a total peptide basis (the same absorbance) so that the total concentration of p79 is unchanged. Other polymers and fluorescence concentrations were determined by weight.
Far UV Circular Dichroism (CD)
Far UV Circular Dichroism was performed using an Applied Photophysics Chirascan equipped with a 6-cell holder (Applied Photophysics, Leatherhead, UK).38 Proteins were at concentrations of ~0.1 mg/ml, in phosphate buffer (pH= 7.0), in a 1-mm quartz cell. CD was measured from 195 – 250 nm and using a 1 nm step size with a two second integration time at each step. Finally, corresponding buffers were subtracted for each sample.
Dynamic Light Scattering (DLS)
Dynamic light scattering was performed using a DynaPro Plate Reader (Wyatt Technology, Santa Barbara, CA).39 Incident light was detected in a backscattering configuration and analyzed with an autocorrelator. 20 μL of sample, in phosphate buffer (pH= 7.0), was placed in a clear-bottomed 384 well plate and read at 20°C. Samples were measured 5 times with a 15 second acquisition time. Autocorrelation functions were fit using cumulant analysis and intensity averaged values are reported. Errors are reported as standard deviation of 3 replicates.
Malvern Zetasizer DLS
Dynamic light scattering was performed using a Malvern Zetasizer. Samples (0.2 mg/mL in phosphate buffer pH= 7.0) were placed in custom quartz cuvettes and illuminated with a 632 nm laser, back-scattered light was collected at a 173° degrees. DLS autocorrelation curves were fit using the CONTIN algorithm and sizes are reported as number average diameter.
Intrinsic Fluorescence Spectroscopy
Intrinsic fluorescence was measured as described previously using custom fluorescence plate reader (Fluorescence Innovations, Minneapolis, MN).38 Briefly, a 285 nm laser was used to excite samples and fluorescence was collected at 180° after passing through a 310 nm longpass filter to block excitation light. A prism dispersed light onto a CCD to quantify the fluorescence as a function of wavelength. 10 μL of sample, in phosphate buffer (pH= 7.0), was placed in a 384 well plate and covered with 2 μL of silicon oil to prevent sample evaporation. The fluorescence was measured from 10 to 90°C with a step-size of 1.25°C and an equilibration step of 2 min between each temperature. The total intensity from 300 to 400 nm was averaged for each temperature. Error bars represent the standard deviation of 4 replicates.
Mice
NOD (Jax #001976), BDC2.5 T cell receptor (TCR) transgenic mice (Jax #004460) and NOD.CD45.2 congenic mice (Jax #014149) were purchased from The Jackson Laboratory. NOD. IL-10/GFP (“Tiger”) mice were kindly provided by Pere Santamaria40. BDC2.5.IL-10/GFP mice were produced by crossing NOD.IL-10/GFP mice with BDC2.5 mice. All mice were bred and maintained in the Columbia Center for Translational Immunology’s animal barrier facility. Both male and female mice between 6–12 weeks of age were used as donors for the splenocytes used in all experiments. All mice used in this study were handled according Columbia University Institutional Animal Care and Use Committee recommendations and approved protocols.
T cell Stimulation Assay
Splenocytes from NOD and NOD.BDC2.5 mice were subjected to ACK (Ammonium-chloride-potassium) buffer to lyse red blood cells, filtered through a 70 μm cell strainer and resuspended into complete RPMI medium (containing 10% FBS, 50 IU/ml penicillin, 50 μg/ml streptomycin, 2 mM L-glutamine, 0.1 mM non-essential amino acids, 1 mM sodium pyruvate and 0.05 mM 2-Mercaptoethanol). The splenocytes were counted and labeled with a violet cell proliferation dye eFluor450 (VCPD) (10 μM for 15 min, eBioscience). VCPD-labeled splenocytes were cultured at 2×10⁵ cells/well with or without 100 nM of SAgAp79, cSAgAp79 or HA in U bottom 96-well plates in triplicates. After 3 days of culture in a humidified CO2 incubator at 37°C, the supernatants were collected and kept at −20°C for cytokine analysis. The splenocytes were harvested and stained with antibodies to CD4, CD25, CD44 and CD69 (Biolegend) and CD4+ T cell responses were analyzed by flow cytometry (FCM) on BD Fortessa. From collected supernatants, cytokine concentrations (IL-2, IL-10 and IFN-γ) were measured by ELISA (MAX kits, Biolegend) according to manufacturer guidelines.
Cellular Uptake
Splenocytes were isolated from NOD or BDC2.5 mice as above, and cultured at 2×10⁵ cells per well (U bottom 96-well plates) in complete RPMI medium with or without fcSAgAp79 at 0.1–1μM final concentration in humidified CO2 incubator at 37°C. Cells were harvested at 12 or 24h time points, washed twice to remove unbound fcSAgAp79 and stained with antibodies to CD45, B220, CD11c, CD11b, CD8a, F4/80, CD40 and CD86 (Biolegend). Samples were then analyzed on Fortessa for fcSAgAp79 uptake by various cell types. Moreover, expression of costimulatory molecules CD86 and CD40 was measured to assess activation / maturation of various APCs.
APC Subset-specific Antigen Presentation
Splenocytes from NOD mice were prepared as above and cultured at 2×10⁵ cells/well with/without SAgAp79 or cSAgAp79 at 1 nM concentration (limiting low dose to better identify the most efficient APCs). After 24h, the cells were harvested, washed twice, stained with antibodies against CD8, B220, CD11c, CD11b, CD45 and Gr-1 and sorted into eight populations (BD Influx sorter). Finally, 103 sorted cells from each sorted population were co-cultured with 50,000 purified T cells/well (10% CD4+ CD25- T cells from BDC2.5 mice and 90% CD4+ CD25- and CD8+ T cells from NOD.CD45.2 mice) for 4 days. T cell purification was performed with MoJoSort magnetic cell separation kits (mouse CD4 T cell and CD3 T cell isolation kits, respectively, both supplemented with biotinylated anti-CD25). The analysis of T cell response was performed by FCM as described above.
Peptide and SAgA Titration
Splenocytes from NOD.BDC2.5.IL-10/GFP and NOD.CD45.2 mice were prepared as described above, labeled with VCPD and mixed (10% and 90% respectively). The splenocytes were co-cultured (2×10⁵ total cells/well) in the presence/absence of titrated SAgAp79 or cSAgAp79 or their corresponding free peptide at 10-fold serial dilutions ranging from 10pM to 1μM concentrations. After 3 days of culture, the supernatants were removed for cytokine analysis and kept at −20°C. The splenocytes were collected, stained with antibodies to CD45.1 (to distinguish antigen-specific CD4+ T cells from bystander CD45.2+ T cells), to CD25 and CD44 (activation) and to Lag-3 and PD-1 (immune checkpoint markers) and analyzed by FCM. Secreted cytokines (IL-2, IFN-γ and IL-10) in stored supernatants were quantified by ELISA (as above).
Assessing T Cell Responses in Vivo Using an Adoptive Transfer Model
CD45.1+ CD4+ CD25- T cells were isolated from pooled lymph nodes and spleen of female BDC2.5 donor mice and purified using the MojoSort™ Mouse CD4 T Cell Isolation Kit (Biolegend) supplemented with biotinylated anti-CD25. One million VCPD labeled CD45.1+ CD4+ CD25- T cells/mouse were injected into female recipient CD45.2 NOD mice intravenously. The recipient mice were randomly distributed through each group and were treated with HA (control), SAgAP79 or cSAgAP79 via subcutaneous injection of 0.5 nmol in 200ul on the neck fold. Five days after treatment, CLN, ALN, PLN and spleen were separately collected and single cell suspensions were prepared. The cells were stained with antibodies to CD4, CD45.1 and CD44 and T cell responses were analyzed by FCM on BD Fortessa.
Analysis of T Cell Response in Vivo Using MHC-tetramer
Female NOD mice were randomly distributed for each group and treated with HA (control), SAgAp79 or cSAgAp79 at 2.5 nmol dose via subcutaneous injection on day 1 and day 3 on the neck fold. On the 6th day after treatment, PLN and spleen were collected from all the recipient mice for in vivo endogenous T cell response analysis. Similarly, another cohort of NOD mice was treated with HA, SAgAp79 or cSAgAp79 at 2.5 nmol via s.c. subcutaneous injection with weekly dosing for three weeks. On the 26th day after treatment, all the three lymph nodes (ALN, CLN and PLN) were pooled together and spleen was separately collected from all mice. Lymphoid cells and splenocytes were isolated and stained with p79/2.5 mimotope MHC tetramer and antibodies to CD4, and CD44. Both tetramer+ and tetramer- CD4+ T cells were analyzed by FCM on BD Fortessa.
Statistical and Data Analysis
GraphPad Prism was used to perform statistical analysis including sigmoidal nonlinear regression, ordinary one-way or two-way analysis of variance (ANOVA), and unpaired t-test. ANOVA was followed by Tukey’s or Sidak’s post-hoc test, where appropriate. The threshold for statistical significance was set to p<0.05. FCM data were analyzed with FCS Express 6.
Supplementary Material
ACKNOWLEDGEMENTS
We gratefully acknowledge support from the National Institutes of Health (NIH) Graduate Training Program in Dynamic Aspects of Chemical Biology Grant (T32 GM008545) from the National Institutes of General Medical Sciences (to M.A.L.). The development of SAgAs for ASIT of T1D was supported by grant 2-SRA-2017-312-S-B from the Juvenile Diabetes Research Foundation (to J.O.S.). Additionally, we thank the Macromolecule and Vaccine Stabilization Center, KU NMR Lab, Microscopy and Analytical Imaging Core Lab, and the Kansas Vaccine Institute at the University of Kansas for their collaboration and instrument use. Support for the NMR instrumentation was provided by NIH Shared Instrumentation Grant # S10RR024664 and NSF Major Research Instrumentation Award # 1625923. The Flow Cytometry Core used for these studies was supported in part by the Office of the Director, NIH, under award S10OD020056 and by the Diabetes Research Center grant P30DK063608. We thank the NIH Tetramer Core Facility, supported by contract HHSN272201300006C from the National Institute of Allergy and Infectious Diseases, for the p79/2.5 MHC tetramers provided for these studies.
SUPPORTING INFORMATION
The Supporting Information is available online at ACS Publications website. It contains information with regards to conjugation efficiency via RP-HPLC, 1H NMR, and intrinsic florescence of SAgAs (Figure S1, S1B, 2). As well as, immunological data gating strategies and dot plots (Figure S3–S7).
REFERENCES
- 1.Atkinson MA, Eisenbarth GS, and Michels AW (2014) Type 1 diabetes, Lancet 383, 69–82. [DOI] [PMC free article] [PubMed] [Google Scholar]
- 2.Wållberg M, and Cooke A (2013) Immune mechanisms in type 1 diabetes, Trends Immunol. 34, 583–591. [DOI] [PubMed] [Google Scholar]
- 3.Feldmann M, and Steinman L (2005) Design of effective immunotherapy for human autoimmunity, Nature 435, 612. [DOI] [PubMed] [Google Scholar]
- 4.Miller SD, Turley DM, and Podojil JR (2007) Antigen-specific tolerance strategies for the prevention and treatment of autoimmune disease, Nat. Rev. Immunol 7, 665. [DOI] [PubMed] [Google Scholar]
- 5.Akdis M, and Akdis CA (2007) Mechanisms of allergen-specific immunotherapy, J. Allergy Clin. Immunol 119, 780–789. [DOI] [PubMed] [Google Scholar]
- 6.von Moos S, Kündig TM, and Senti G (2011) Novel administration routes for allergen-specific immunotherapy: a review of intralymphatic and epicutaneous allergen-specific immunotherapy, Immunol Allergy Clin North Am 31, 391–406. [DOI] [PubMed] [Google Scholar]
- 7.Hartwell BL, Pickens CJ, Leon M, and Berkland C (2017) Multivalent Soluble Antigen Arrays Exhibit High Avidity Binding and Modulation of B Cell Receptor-Mediated Signaling to Drive Efficacy against Experimental Autoimmune Encephalomyelitis, Biomacromolecules 18, 1893–1907. [DOI] [PMC free article] [PubMed] [Google Scholar]
- 8.Hartwell BL, Pickens CJ, Leon M, Northrup L, Christopher MA, Griffin JD, Martinez-Becerra F, and Berkland C (2018) Soluble antigen arrays disarm antigen-specific B cells to promote lasting immune tolerance in experimental autoimmune encephalomyelitis, J. Autoimmun. [DOI] [PMC free article] [PubMed] [Google Scholar]
- 9.Jones DS (2005) Multivalent compounds for antigen-specific B cell tolerance and treatment of autoimmune diseases, Curr. Med. Chem 12, 1887–1904. [DOI] [PubMed] [Google Scholar]
- 10.Puffer EB, Pontrello JK, Hollenbeck JJ, Kink JA, and Kiessling LL (2007) Activating B cell signaling with defined multivalent ligands, ACS Chem. Biol 2, 252–262. [DOI] [PubMed] [Google Scholar]
- 11.Cairo CW, Gestwicki JE, Kanai M, and Kiessling LL (2002) Control of multivalent interactions by binding epitope density, J. Am. Chem. Soc 124, 1615–1619. [DOI] [PubMed] [Google Scholar]
- 12.Gestwicki JE, Cairo CW, Strong LE, Oetjen KA, and Kiessling LL (2002) Influencing receptor–ligand binding mechanisms with multivalent ligand architecture, J. Am. Chem. Soc 124, 14922–14933. [DOI] [PubMed] [Google Scholar]
- 13.Kiessling LL, Gestwicki JE, and Strong LE (2000) Synthetic multivalent ligands in the exploration of cell-surface interactions, Curr. Opin. Chem. Biol 4, 696–703. [DOI] [PubMed] [Google Scholar]
- 14.Hartwell BL, Antunez L, Sullivan BP, Thati S, Sestak JO, and Berkland C (2015) Multivalent nanomaterials: learning from vaccines and progressing to antigen-specific immunotherapies, J. Pharm. Sci 104, 346–361. [DOI] [PubMed] [Google Scholar]
- 15.Krishnamurthy VM, Estroff LA, and Whitesides GM (2006) Multivalency in ligand design.
- 16.Dintzis H, Dintzis R, and Vogelstein B (1976) Molecular determinants of immunogenicity: the immunon model of immune response, Proc. Natl. Acad. Sci. U.S.A 73, 3671–3675. [DOI] [PMC free article] [PubMed] [Google Scholar]
- 17.Hartwell BL, Martinez-Becerra FJ, Chen J, Shinogle H, Sarnowski M, Moore DS, and Berkland C (2016) Antigen-Specific Binding of Multivalent Soluble Antigen Arrays Induces Receptor Clustering and Impedes B Cell Receptor Mediated Signaling, Biomacromolecules 17, 710–722. [DOI] [PubMed] [Google Scholar]
- 18.Hartwell BL, Smalter Hall A, Swafford D, Sullivan BP, Garza A, Sestak JO, Northrup L, and Berkland C (2016) Molecular Dynamics of Multivalent Soluble Antigen Arrays Support a Two-Signal Co-delivery Mechanism in the Treatment of Experimental Autoimmune Encephalomyelitis, Mol. Pharm 13, 330–343. [DOI] [PubMed] [Google Scholar]
- 19.Northrup L, Sestak JO, Sullivan BP, Thati S, Hartwell BL, Siahaan TJ, Vines CM, and Berkland C (2014) Co-delivery of autoantigen and b7 pathway modulators suppresses experimental autoimmune encephalomyelitis, AAPS J. 16, 1204–1213. [DOI] [PMC free article] [PubMed] [Google Scholar]
- 20.Sestak J, Mullins M, Northrup L, Thati S, Forrest ML, Siahaan TJ, and Berkland C (2013) Single-step grafting of aminooxy-peptides to hyaluronan: a simple approach to multifunctional therapeutics for experimental autoimmune encephalomyelitis, J. Control. Release 168, 334–340. [DOI] [PMC free article] [PubMed] [Google Scholar]
- 21.Sestak JO, Fakhari A, Badawi AH, Siahaan TJ, and Berkland C (2014) Structure, size, and solubility of antigen arrays determines efficacy in experimental autoimmune encephalomyelitis, AAPS J. 16, 1185–1193. [DOI] [PMC free article] [PubMed] [Google Scholar]
- 22.Sestak JO, Sullivan BP, Thati S, Northrup L, Hartwell B, Antunez L, Forrest ML, Vines CM, Siahaan TJ, and Berkland C (2014) Codelivery of antigen and an immune cell adhesion inhibitor is necessary for efficacy of soluble antigen arrays in experimental autoimmune encephalomyelitis, Mol Ther Methods Clin Dev 1. [DOI] [PMC free article] [PubMed] [Google Scholar]
- 23.Thati S, Kuehl C, Hartwell B, Sestak J, Siahaan T, Forrest ML, and Berkland C (2015) Routes of administration and dose optimization of soluble antigen arrays in mice with experimental autoimmune encephalomyelitis, J. Pharm. Sci. 104, 714–721. [DOI] [PMC free article] [PubMed] [Google Scholar]
- 24.Judkowski V, Pinilla C, Schroder K, Tucker L, Sarvetnick N, and Wilson DB (2001) Identification of MHC class II-restricted peptide ligands, including a glutamic acid decarboxylase 65 sequence, that stimulate diabetogenic T cells from transgenic BDC2. 5 nonobese diabetic mice, J. Immunol. 166, 908–917. [DOI] [PubMed] [Google Scholar]
- 25.Haskins K, Portas M, Bergman B, Lafferty K, and Bradley B (1989) Pancreatic islet-specific T-cell clones from nonobese diabetic mice, Proc. Natl. Acad. Sci. U.S.A 86, 8000–8004. [DOI] [PMC free article] [PubMed] [Google Scholar]
- 26.Delong T, Baker RL, He J, Barbour G, Bradley B, and Haskins K (2012) Diabetogenic T-cell clones recognize an altered peptide of chromogranin A, Diabetes, DB_120112. [DOI] [PMC free article] [PubMed] [Google Scholar]
- 27.Delong T, Wiles TA, Baker RL, Bradley B, Barbour G, Reisdorph R, Armstrong M, Powell RL, Reisdorph N, and Kumar N (2016) Pathogenic CD4 T cells in type 1 diabetes recognize epitopes formed by peptide fusion, Science 351, 711–714. [DOI] [PMC free article] [PubMed] [Google Scholar]
- 28.Fife BT, Guleria I, Bupp MG, Eagar TN, Tang Q, Bour-Jordan H, Yagita H, Azuma M, Sayegh MH, and Bluestone JA (2006) Insulin-induced remission in new-onset NOD mice is maintained by the PD-1–PD-L1 pathway, J. Exp. Med 203, 2737–2747. [DOI] [PMC free article] [PubMed] [Google Scholar]
- 29.Berry G, and Waldner H (2013) Accelerated type 1 diabetes induction in mice by adoptive transfer of diabetogenic CD4+ T cells, J. Vis. Exp. [DOI] [PMC free article] [PubMed] [Google Scholar]
- 30.Masteller EL, Warner MR, Ferlin W, Judkowski V, Wilson D, Glaichenhaus N, and Bluestone JA (2003) Peptide-MHC class II dimers as therapeutics to modulate antigen-specific T cell responses in autoimmune diabetes, J. Immunol 171, 5587–5595. [DOI] [PubMed] [Google Scholar]
- 31.Judkowski V, Rodriguez E, Pinilla C, Masteller E, Bluestone JA, Sarvetnick N, and Wilson DB (2004) Peptide specific amelioration of T cell mediated pathogenesis in murine type 1 diabetes, Clin. Immunol 113, 29–37. [DOI] [PubMed] [Google Scholar]
- 32.Dintzis R, Middleton M, and Dintzis H (1983) Studies on the immunogenicity and tolerogenicity of T-independent antigens, J. Immunol 131, 2196–2203. [PubMed] [Google Scholar]
- 33.Dintzis R, Vogelstein B, and Dintzis H (1982) Specific cellular stimulation in the primary immune response: experimental test of a quantized model, Proc. Natl. Acad. Sci. U.S.A 79, 884–888. [DOI] [PMC free article] [PubMed] [Google Scholar]
- 34.Smith LJ, Fiebig KM, Schwalbe H, and Dobson CM (1996) The concept of a random coil: Residual structure in peptides and denatured proteins, Fold Des. 1, R95–R106. [DOI] [PubMed] [Google Scholar]
- 35.Daniel C, Weigmann B, Bronson R, and von Boehmer H (2011) Prevention of type 1 diabetes in mice by tolerogenic vaccination with a strong agonist insulin mimetope, J Exp Med 208, 1501–1510. [DOI] [PMC free article] [PubMed] [Google Scholar]
- 36.Meng Q, Yu M, Zhang H, Ren J, and Huang D (2007) Synthesis and application of N-hydroxysuccinimidyl rhodamine B ester as an amine-reactive fluorescent probe, Dyes Pigm. 73, 254–260. [Google Scholar]
- 37.Hu X, Li D, Zhou F, and Gao C (2011) Biological hydrogel synthesized from hyaluronic acid, gelatin and chondroitin sulfate by click chemistry, Acta Biomater. 7, 1618–1626. [DOI] [PubMed] [Google Scholar]
- 38.Wei Y, Larson NR, Angalakurthi SK, and Russell Middaugh C (2018) Improved Fluorescence Methods for High-Throughput Protein Formulation Screening, SLAS Technol., 2472630318780620. [DOI] [PubMed] [Google Scholar]
- 39.Wei Y, Wahome N, Kumar P, Whitaker N, Picking WL, and Middaugh CR (2018) Effect of Phosphate Ion on the Structure of Lumazine Synthase, an Antigen Presentation System From Bacillus anthracis, J. Pharm. Sci 107, 814–823. [DOI] [PubMed] [Google Scholar]
- 40.Clemente-Casares X, Blanco J, Ambalavanan P, Yamanouchi J, Singha S, Fandos C, Tsai S, Wang J, Garabatos N, Izquierdo C, Agrawal S, Keough MB, Yong VW, James E, Moore A, Yang Y, Stratmann T, Serra P, and Santamaria P (2016) Expanding antigen-specific regulatory networks to treat autoimmunity, Nature 530, 434–440. [DOI] [PubMed] [Google Scholar]
Associated Data
This section collects any data citations, data availability statements, or supplementary materials included in this article.


