

Summary
Using untargeted metabolomics (n=1,162 subjects), the plasma metabolite (m/z=265.1188) phenylacetylglutamine (PAGln) was discovered, and then shown in an independent cohort (n=4,000 subjects) to be associated with cardiovascular disease (CVD) and incident major adverse cardiovascular events (myocardial infarction, stroke or death). A gut microbiota derived-metabolite, PAGln was shown to enhance platelet activation related phenotypes and thrombosis potential in whole blood, isolated platelets, and animal models of arterial injury. Functional and genetic engineering studies with human commensals, coupled with microbial colonization of germ-free mice, showed the microbial porA gene facilitates dietary phenylalanine conversion into phenylacetic acid, with subsequent host generation of PAGln and phenylacetylglycine (PAGly) fostering platelet responsiveness and thrombosis potential. Both gain- and loss-of-function studies employing genetic and pharmacological tools reveal PAGln mediates cellular events through G-protein coupled receptors, including α2A, α2B and β2-adrenergic receptors. PAGln thus represents a new CVD-promoting gut microbiota-dependent metabolite that signals via adrenergic receptors.
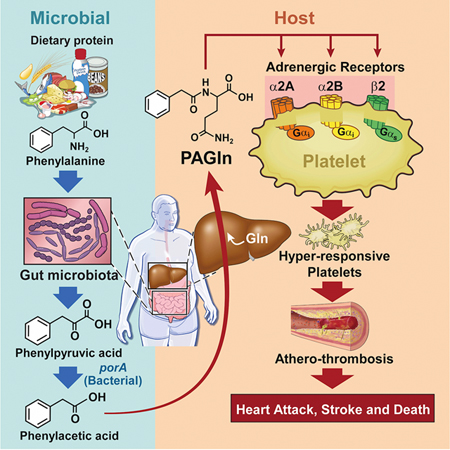
Graphcial Abstract
Introduction
Cardiovascular disease (CVD) remains the leading cause of death and morbidity in Western countries and new therapeutic targets that contribute to CVD development and progression are needed. We hypothesized that studies in subjects with type 2 diabetes (T2DM) would prove fruitful in identifying novel pathways linked to CVD since subjects with T2DM are both at markedly higher risk for development of CVD and its major adverse consequences (MACE, major adverse cardiac events = myocardial infarction (MI), stroke or death) and suffer poorer prognosis and outcomes. Further, traditional CVD risk factors fail to adequately account for the heightened risks observed amongst subjects with T2DM. Interestingly, the degree of blood-glucose control within T2DM is a poor indicator of incident CVD risks, and numerous anti-diabetes medications lower plasma glucose levels without significantly impacting CVD development or MACE risks (Action to Control Cardiovascular Risk in Diabetes Study et al., 2008) (Duckworth et al., 2009; Gerstein et al., 2001; Piarulli et al., 2009). These observations indicate that metabolic derangements distinct from glucose related pathways occur with T2DM that contribute to the heightened CVD risks observed in this disorder.
Untargeted metabolomics is emerging as a powerful platform for discovery of pathways linked to diseases (Koh et al., 2018; Li et al., 2018; Lloyd-Price et al., 2019; Wang et al., 2011). This relatively unbiased approach enables development of a comprehensive list of circulating ionizable analytes associated with a given phenotype and whose chemical structures can be enumerated. However, structural identification of chemical signatures detected is challenging, and a significant portion of the spectral features observed within plasma remains of unknown structures (Blazenovic et al., 2018; da Silva et al., 2015). Herein, we employed untargeted metabolomics analyses of plasma from subjects with T2DM, coupled with mechanistic investigations, to reveal a metabolite formed via a metaorganismal pathway enhanced in subjects with T2DM and associated with heightened CVD risks in both T2DM and non-diabetic subjects alike. The essential amino acid phenylalanine (Phe) serves as nutrient precursor for the gut microbiota-generated metabolite phenylacetylglutamine (PAGln), which is both clinically and mechanistically linked to CVD and is shown to promote CVD relevant phenotypes via host GPCRs, including α2A, α2B, and β2-adrenergic receptors (ADRs).
Results
Untargeted Metabolomics Identifies PAGln is Associated with CVD
In an initial Discovery Cohort (n=1,162; Table S1), untargeted metabolomics was performed on plasma from sequential stable subjects undergoing elective diagnostic cardiac evaluation with longitudinal (3 years) follow-up, as described under Methods. Plasma analytes were prioritized based on three screening inclusion criteria: (i) association with incident (3 year) major adverse cardiac events (MACE = myocardial infarction (MI), stroke or death); (ii) heightened levels in T2DM; and (iii) poor correlation with indices of glycemic control (Table S2). Of the spectral features in plasma monitored, the top MACE-associated predicted analytes were prioritized into two lists: those of known structures vs. those of unknown structures at the time of analysis. The top 5 identified (“known”) compounds included trimethylamine-N-oxide (TMAO) and trimethyllysine (TML), compounds linked to gut microbiota metabolism and incident CVD risks (Koeth et al., 2013; Li et al., 2018; Tang et al., 2013; Wang et al., 2011), along with three diacylglycerophospholipids with tentative structural identification (Table S2). Among “unknown” compounds, the top MACE-associated candidate (high resolution m/z 265.1188) fulfilled all three screening inclusion criteria and showed a hazard ratio (HR) 95% (Confidence interval (CI)) for incident (3 year) MACE risk of 2.69 (1.61–4.52); P<0.0001 (Fig. 1A,1B; Table S2). The m/z 265.1188 plasma analyte was then unambiguously identified as phenylacetylglutamine (PAGln) by multiple approaches, including demonstrating identical high resolution MS/MS spectra and retention time with authentic synthetic standard material on multiple stationary phases and chromatography conditions, both with and without derivatization, both in plasma and following isolation (Fig. 1C, Fig. S1, Table S3).
Fig. 1. Untargeted Metabolomics Studies Discover a Metabolite with m/z of 265.1188 is Associated with Cardiovascular Disease Risk, Subsequently Identified as Phenylacetylglutamine (PAGln).

(A) Relative plasma levels of compound with m/z 265.1188 in sequential stable subjects undergoing elective diagnostic cardiac evaluation. Subjects (n=1,162) were divided into groups based on whether they were diabetic or experienced an incident major adverse cardiac event (MACE: MI, stroke or death) over the 3-year follow-up. In the box-whisker plot, the upper and lower boundaries of the box represent the 25th and 75th %iles, the median is marked by a horizontal line inside the box, whiskers represent 10 and 90% of relative measured values.
(B) Kaplan-Meier estimates and the risk of MACE ranked by quartile of candidate analyte m/z 265.1188.
(C) Comparison of high resolution CID mass spectra of the metabolite m/z 265.1188 in plasma (red) and synthetic PAGln standard (blue).
(D) In the Validation Cohort (n=4,000) and indicated sub-cohorts Kaplan-Meier estimates and the risk of MACE according to PAGln quartile levels as measure by stable isotope dilution LC-MS/MS.
(E) Risk of MACE by 3 years among all test subjects (n=4,000; left panel), diabetics (n=1,261; mid panel) and non-diabetics (n=2,739, right panel) according to PAGln quartile levels using a multivariable Cox proportional hazard model. Unadjusted hazard ratio (black) and adjusted model (age, gender, smoking, HDL, LDL, triglyceride level, systolic blood pressure and C-reactive protein level; red). The 5–95% confidence intervals (CI) are indicated by the line length. See also Figure S1. and Tables S1–S5.
Untargeted metabolomics analyses are only semi-quantitative, and require both verification and more quantitative analyses of candidates to corroborate observed associations. We therefore developed a stable isotope dilution LC/MS/MS assay to quantify PAGln in an independent (non-overlapping) Validation Cohort (n=4,000) of stable subjects undergoing elective diagnostic cardiac evaluation (Table S4). Within the entire cohort, higher plasma PAGln levels were observed amongst subjects with T2DM (P=0.0002 vs. non-diabetics), as well as amongst subjects with MACE (P<0.0001 vs. nonMACE). Kaplan-Meier survival analyses revealed subjects with high PAGln levels have greater incident (3 years) MACE risks (Fig. 1D; P<0.0001 log rank for all groups examined). Specifically, subjects with PAGln levels in the fourth quartile (Q4) vs. those in the first (Q1) demonstrated a significant increased risk of incident (3 year) MACE risks among both diabetics and non-diabetics alike (all subjects (HR, 2.80; 95% CI, 2.17–3.61); T2DM (HR, 2.73; 95% CI, 1.84–4.05) and non-diabetics (HR, 2.18; 95% CI, 1.59–3.00); Fig. 1E). Moreover, higher PAGln levels remained an independent predictor of incident MACE risks following adjustments for traditional cardiac risk factors (Fig. 1E).
Gut Microbiota Participate in Production of PAGln and Phenylacetylglycine (PAGly) in vivo
A gut microbial contribution to PAGln generation in humans was established by demonstrating marked suppression (P<0.0001) of systemic PAGln levels in subjects (n=15) in studies analyzing plasma at baseline (Pre-Abx), then following a 7 day course of oral poorly absorbed broad spectrum antibiotics cocktail (Abx) previously shown to suppress gut microbiota (Tang et al., 2013), and finally following a washout period (≥3 weeks) to permit repopulation of conventional human gut commensals (Post-Abx; Fig. 2A). Previous studies with either liver extracts or isolated enzymes have reported PAGln can be formed by phenylacetic acid (PAA) conjugation to the amino acid glutamine (Gln) by both human and rhesus monkey liver enzymes (Webster et al., 1976), while other studies have shown PAA can be produced by bacterial fermentation of the essential amino acid Phe in culture (Dodd et al., 2017). In addition to PAGln, PAA conjugation to the amino acid glycine (Gly) generating PAGly has also been noted (Gonzalez-Guardia et al., 2015; Wang et al., 2013). We therefore evaluated the physiological distribution of Gly vs. Gln derivatives of PAA in apparently healthy subjects (n=25), as well as in mice, where mechanistic studies would be performed. In humans, circulating levels of PAGln were found to be over an order of magnitude higher than PAGly. In contrast, PAGly levels in mice were an order of magnitude higher than PAGln (Fig. 2B), and PAA administered via intraperitoneal (i.p.) injection was shown to be predominantly metabolized into PAGly (Fig. 2C). Comparisons of serum levels of PAGly in conventionally reared vs. germ free (GF) mice, or before vs. after oral cocktail of Abx exposure, showed that gut microbiota are a critical participant in PAGly formation from PAA (Fig. 2B,D). Thus, in both humans and mice, PAGln and PAGly are produced in vivo via a metaorganismal pathway wherein dietary Phe is converted into PAA acid by gut microbiota, at which point host conjugation reactions occur with either Gln (preferred in humans) or Gly (preferred in rodents), producing PAGln and PAGly, respectively (Fig. 2E).
Figure 2. PAGln Production In Vivo is a Microbiota-Dependent Process in Humans and Mice.

Fasting plasma levels of PAGln in subjects (n=15) (i) before oral treatment with a cocktail of poorly absorbable, broad spectrum antibiotics (Pre-Abx), (ii) after seven days of antibiotics regiment (Abx), and (iii) three weeks after discontinuation of antibiotics (Post-Abx). Kruskal-Wallis was used for the statistical analysis.
(B) Fasting plasma levels of PAGln and PAGly (mean ± SD) in indicated numbers of healthy human subjects (n=25; left), conventionally raised mice (n=26; mid) and germ free (GF) mice (n=20; right).
(C) Serial plasma levels of PAGln and PAGly after i.p. injection of phenylacetic acid (50 mg/kg; n=5) in mice.
(D) Levels of PAGln in (n=11) male and (n=15) female mouse plasmas (i) before use of oral broad spectrum antibiotic cocktail (Pre-Abx), (ii) after five days of antibiotics treatment (Abx), and (iii) one week post antibiotics discontinuation (Post-Abx). Kruskal-Wallis test was used for the statistical analysis. (E) Schematic outlining metaorganismal production of PAGln and PAGly in humans and mice.
PAGln Enhances Platelet Stimulus-Induced Calcium Release and Responsiveness to Multiple Agonists
The observed positive association between PAGln levels and incident thrombotic events in humans (Fig. 1) suggested a potential effect of PAGln on platelet function and interactions with vascular matrix. We thus investigated whether PAGln impacted platelet adhesion to collagen surfaces in whole blood under physiological shear forces, using methods as previously described (Zhu et al., 2016). Studies were performed using PAGln levels observed in subjects within our clinical Validation Cohort, which is comprised of subjects with relatively preserved renal function (Tables S4,S5). Exposure (30 min) of whole blood recovered from healthy volunteers (all confirmed to have low (< 4th quartile PAGln levels) to physiologically relevant levels of PAGln (both 10 μM and 100 μM; see Table S5 for distribution of PAGln levels in subjects within the Validation Cohort) substantially accelerated the rate of collagen-dependent platelet adhesion and spreading observed under physiological shear flow (Fig. 3A–C). Further, within whole blood, PAGln (10 μM (P<0.0001) and 100 μM (P<0.0001)) also induced enhancement in the adhesion of P-selectin positive platelets on collagen matrix under physiological shear flow (Fig. S2A). Brief (30 min) pretreatment of human platelet-rich plasma (PRP) with PAGln (100μM) vs. saline (vehicle) revealed PAGln significantly enhanced stimulus-dependent platelet aggregation to sub-maximal concentrations of three different known platelet agonists: ADP, thrombin receptor-activated peptide (TRAP6) and collagen (P<0.001 for ADP (Fig. 3D left panel); P=0.003 for TRAP6 (Fig. S2C, left panel) and P=0.02 for collagen (Fig. S2C, right panel)). When a fixed sub-maximal level of each of the platelet agonists (ADP, TRAP6, or collagen) was used, PAGln was observed to dose-dependently enhance the extent of platelet aggregation in PRP across the physiological range of concentrations of PAGln found in our clinical cohort (P=0.016 for ADP (Fig. 3D right panel; Fig. S2B); P=0.002 for TRAP6 (Fig. S2D, left panel) and P=0.018 for collagen (Fig. S2D, right panel)). In studies with washed human platelets, PAGln also dose-dependently enhance sub-maximal ADP-stimulated P-selectin surface expression (Fig. 3E) and glycoprotein α2β3 (GP IIb/IIIa) activation (Fig. 3F), with significant increases in platelet activation phenotypes noted with PAGln levels of 10 μM or greater.
Figure 3. PAGln Enhances Platelet Responsiveness.

(A) Human platelet adhesion in whole blood to a microfluidic chip surface (± collagen coating) under physiological shear conditions ± PAGln. Representative images of platelet (green) adhesion at the indicated times; (scale bar, 50 μm).
(B) Adherent platelet integrated optical density (IOD, area x intensity) from whole blood recorded from the indicated number of subjects.
(C) Adherent platelet IOD at end point (i.e. after 3 min), in 5 high power fields (per treatment/per subject) along the length of the channel (n=9–11 as indicated).
(D) ADP-stimulated platelet aggregometry responses (n=10) with fixed concentration of PAGln (100 μM, red) vs. normal saline (vehicle, blue) (left) or varying concentrations of PAGln (n=5) [fixed sub-maximal level of ADP (2 μM), right].
(E) ADP (vs. vehicle) induced changes in P-selectin surface expression in washed human platelets pre-incubated with the indicated concentrations of PAGln (n=6).
(F) ADP (vs. vehicle) induced activation of platelet GP IIb/IIIa as assessed by PAC-1 antibody staining on washed human platelets pre-incubated with PAGln (n=6).
(G) (Left) Representative fluorescent signal showing thrombin induced changes in intracellular calcium concentration [Ca2+] in Fura 2 filled washed human platelets incubated with PAGln. (Right) Fold-change (relative to PAGln=0 μM) in peak Fura 2 fluorescence following sub-maximal (0.02 U) thrombin stimulation at the indicated concentrations of PAGln in washed human platelets (n=8–9 as indicated). Data points represent the mean ± SEM (n=biological replicates). Significance was measured with non-parametric one- or two-way ANOVA with multiple comparisons (*P<0.05; **P<0.01; ***P<0.001; ****P<0.0001). See also Figure S2.
The above results collectively suggested PAGln might directly interact with platelets, enhancing stimulus-dependent rise in intracellular cytosolic Ca2+ concentrations ([Ca2+]i). To directly test this, isolated human platelets were recovered from healthy donors, loaded with the calcium-selective dye Fura 2-AM, and the effect of PAGln on [Ca2+]i was monitored in real time before vs. following thrombin-induced activation. Pre-incubation of platelets with PAGln alone had no effect on baseline [Ca2+]i levels (Fig. 3G, left panel). However, exposure to physiological levels of PAGln dose-dependently enhanced sub-maximal (0.02 U) thrombin-evoked augmentation of [Ca2+]i (Fig. 3G). Similar results were observed with PAGly (Fig. S2E–G). The above data demonstrate that the gut microbiota-dependent metabolites PAGln and PAGly significantly impact platelet function, enhancing platelet adhesion to collagen matrices and both platelet stimulus-dependent rise in [Ca2+]i and aggregation in response to agonists.
PAGln Accelerates Platelet Clot Formation and Enhances Thrombosis Potential in vivo
The impact of PAGln and PAGly on clot formation in vivo was examined using the FeCl3-induced carotid artery injury model, a commonly used experimental approach to induce thrombosis. PAGln or PAGly were individually acutely raised by i.p. injections in mice (Fig. S3A), and both the rate of platelet clotting following carotid artery injury and the time to cessation of flow within the carotid artery were quantified. Notably, both PAGln and PAGly each induced heightened platelet thrombus formation within the injured carotid artery (Fig. 4A), and correspondingly reduced the time to cessation of blood flow following injury (i.e., the occlusion time) when compared to mice treated with the nutrient precursor Phe or normal saline (vehicle) (Fig. 4B).
Figure 4. PAGln and PAGly Enhance In Vivo Thrombosis Potential.

(A) Representative pictographs of carotid artery thrombus formation at the indicated time points following FeCl3-induced carotid artery injury (scale bar, 200 μm).
(B) Time to cessation of blood flow in mice from indicated groups (mean ± SEM; nonparametric Mann Whitney test for non-pairwise and Kruskal-Wallis test (K.W.) for multiple comparisons).
(C) Synthesis of phenylacetic acid (PAA) and phenylpropionic acid (PPA) by C. sporogenes ΔcutC mutant with a disrupted gene for reductive metabolism of Phe (ΔfldH) were compared to (ΔcutC)C. sporogenes mutant with a disrupted gene for oxidative metabolism of Phe (ΔporA). C. sporogenes mutants were incubated with synthetic [13C9,15N]-Phe and production of [13C8]-PAA (red) and [13C9]-PPA (blue) were measured in the indicated number of replicates (n=6–9 as indicated) and results of each normalized by optical density (OD).
(D) Time to cessation of blood flow in GF mice mono-colonized with (ΔcutC)C. sporogenes (n=19) or (ΔcutC,ΔfldH)C. sporogenes (n=18) mutants. Shown are (top) representative pictographs of carotid artery thrombus formation at the indicated time points following arterial injury (scale bar, 200 μm), and (bottom) time to cessation of blood flow in mice from the indicated groups. Bar and whiskers represent mean ± SEM time to cessation of blood flow within the indicated group. See also Figure S3.
Gut Microbial Genes porA and fldH Modulate Host Thrombosis Potential In Vivo
We next tested whether the commensals and genes that contribute to PAGln/PAGly generation within hosts can modulate platelet function and thrombosis potential in vivo. Based on a combination of prior studies (Dickert et al., 2002; Dodd et al., 2017; Elsden et al., 1976), we illustrate in Fig. S3B a schematic of proposed metaorganismal metabolic pathways for initial anaerobic conversion of dietary Phe into either PAA (oxidative pathway) or phenylpropionic acid (PPA, reductive pathway), followed by host catalyzed Gln or Gly condensation with PAA forming PAGln or PAGly, respectively. Recent studies reported a role for the microbial porA gene in oxidative metabolism of Phe to PAA by the human commensal Clostridium sporogenes (Dodd et al., 2017). In addition, Elsden and colleagues previously reported PPA was a major product of Phe metabolism by clostridia (Elsden et al., 1976), and Dodd and colleagues also characterized a 15kb gene cluster in C. sporogenes that harbors a phenyllactate dehydratase (fldABC) (Dickert et al., 2002), along with adjacent genes (e.g. fldH), that were shown to be critical to catalytic reductive metabolism of aromatic amino acids including Phe (Dodd et al., 2017). The scheme (Fig. S3B) is also based on PAA metabolism in humans and other mammals previously studied due to its use as an acute emergency treatment for hyperammonemia in patients with urea-cycle disorders, facilitating nitrogen removal as PAGln via urinary excretion (Brusilow et al., 1980; Webster et al., 1976). We therefore generated C. sporogenes mutants lacking either a functional porA or fldH gene, as described under Methods. Because of the ability of C. sporogenes to generate trimethylamine, an alternative gut microbiota-derived metabolite that is precursor of the pro-thrombotic metabolite TMAO (Skye et al., 2018; Zhu et al., 2016), both porA or fldH mutants were generated in a ΔcutC background. To functionally characterize the mutants, they were cultured under anaerobic conditions in the presence of [13C9,15N1]- Phe and generation of [13C8]-PAA vs. [13C9]- PPA were determined by LC/MS/MS. As shown in Fig. 4C, while (ΔcutC)C. sporogenes harboring both functional porA and fldH genes only generated isotope labeled PPA and not PAA, the ΔcutC,ΔfldH mutant (still possesses functional porA) no longer generated PPA but did generate PAA (Fig. 4C). In contrast, the (ΔcutC,ΔporA)C. sporogenes mutant (still possessing functional fldH) no longer generated PAA and only formed PPA. We then directly tested the impact of gut microbial PAA generation on host in vivo thrombosis potential by colonizing GF mice with either (ΔcutC)C. sporogenes or the (ΔcutC,ΔfldH)C. sporogenes mutants. Following microbial colonization, plasma levels of PAGly were determined from samples recovered at time of in vivo thrombosis assessment using the FeCl3 induced carotid artery injury model (Methods). Colonization of C. sporogenes strains post inoculation was confirmed by PCR of DNA extracted from cecal contents at the time of sacrifice. As predicted by the in vitro culture data (Fig. 4C), colonization of the GF mice with (ΔcutC,ΔfldH)C. sporogenes resulted in significantly higher levels of PAGly (P<0.001) than that observed in (ΔcutC)C. sporogenes colonized mice (Fig. 4D). Following arterial injury, both the rate of thrombus generation and the time to cessation of blood flow within the injured vessel were significantly reduced in the mice colonized with the (ΔcutC,ΔfldH)C. sporogenes mutant, producing higher levels of PAA and consequently, PAGly (Fig. 4D).
PAGln Shows Saturable and Specific Binding to Cells, Suggesting Specific Receptor-Ligand Binding Interaction
Since, PAGln directly fosters cellular effects at physiological levels, we next sought to decipher underlying molecular participants that might contribute to PAGln elicited cellular events. To test whether PAGln shows evidence of binding to a cellular receptor(s), we used dynamic mass redistribution (DMR), a label-free technology based on refractive index changes that enables real-time detection of ligand-dependent integrated cellular responses in live cells (Schroder et al., 2010; Schroder et al., 2011). Addition of PAGln to the human bone marrow-derived megakaryoblasts (MEG01), a culturable precursor cell of platelets, resulted in a positive DMR response similar to known receptor binding ligands like norepinephrine (Norepi) and collagen, which bind to ADRs and the glycoprotein VI (GPVI) receptor (Leitinger, 2011; Small et al., 2003), respectively., and acted as positive controls. In contrast, the PAGln precursor (and structural analogue) Phe, which does not bind to a legitimate cell receptor, displayed no DMR response (similar to vehicle control), and was used as negative control (Fig. S4A). Examination of increasing concentrations of potential binding ligands (PAGln vs Norepi vs Phe ) with MEG01 cells demonstrated saturable and specific DMR dose-response curves, typical for a ligand-receptor interaction process, with PAGln and Norepi, but not Phe (Fig. 5A). In parallel studies, saturable and specific DMR dose-response signal was also observed following PAGln binding to the human bone marrow derived erythroleukemia cells (HEL92.1.7; Fig. S4B).
Fig. 5. PAGln Mediates Cellular Response Through G-Protein Coupled Receptor(s) and via ADRs.

(A) DMR dose response of PAGln, Norepi and Phe in MEG01 cells (n=4; max DMR responses after ligand addition).
(B) DMR response of PAGln (100 μM; left), Norepi (10 μM; middle) and collagen (10 μg/mL; right) in MEG01 cells pre-treated with the G-protein modulators pertussis toxin (PTX; 100 ng/mL), cholera toxin (CTX; 1 μg/mL), YM-254890 (0.5 μM) or SCH-202676 (1 μM) (n=5–10 as indicated).
(C-D) cAMP levels in (C) MEG01 cells and (D) washed human platelets pretreated with PAGln (100 μM; 5 min), in presence of PTX (100 ng/mL), CTX (1 μg/mL), YM-254890 (1 μM) or SCH-202676 (1 μM). cAMP levels were normalized to 100% immediately before addition of PAGln (n=4–9 as indicated).
(E) Structure similarity between PAGln and catecholamines (ISO, Epinephrine and Norepi).
(F) DMR response in MEG01 cells transfected with control scrambled siRNAs, and siRNAs against the α2A, α2B and β2 ADRs and analyzed under indicated conditions (n=6–9 as indicated). Maximum DMR response to PAGln was normalized to 100%.
(G) PAGln (100 μM) DMR response quantified in MEG01 cells treated with 10 μM selective β2 antagonist ICI118,551, nonselective β-blocker propranolol or nonselective α2 antagonist RX821002 for 30 min (n=3–8 as indicated). The maximum DMR response to PAGln was normalized to 100%.
(H) cAMP levels in MEG01 cells after PAGln (100 μM; 5 min) treatment in the presence of 10 μM ICI118,551, propranolol or RX821002 (n=6–10 as indicated). cAMP levels were normalized to 100% in all treatments immediately prior to addition of PAGln.
Nonparametric-Mann Whitney test was used for non-pairwise comparisons and Kruskal-Wallis (K.W.) test for multiple comparisons. Data points represent the mean ± SEM (n=biological replicates). See also Figure S4–6.
PAGln Mediates Cellular Events via G Protein-Coupled Receptors (GPCRs)
Since PAGln demonstrates receptor-ligand interaction properties with cells, we next tested whether PAGln-induced DMR cellular responses were impacted by known GPCR signaling pathway modulators like pertussis toxin (PTX), cholera toxin (CTX) and YM-254890, which mask activation of Gαi/o, Gαs and Gαq subunit-mediated signaling pathways, respectively (Campbell and Smrcka, 2018; Milligan and Kostenis, 2006). Additionally, we examined PAGln-induced DMR cellular responses in the absence or presence of SCH-202676, a global GPCR inhibitor that blocks both agonist and antagonist binding to structurally diverse GPCRs that couple to Gαi/o, Gαs and Gαq proteins (Fawzi et al., 2001; Lewandowicz et al., 2006). As positive control, we used Norepi as a GPCR binding ligand, while collagen (a non-GPCR binding ligand) was used as negative control. The PAGln-induced DMR response in MEG01 cells was significantly reduced by pretreating the cells with either a combination of all three modulators (PTX, CTX, and YM-254890) or byuse of the global GPCR inhibitor SCH-202676, strongly implicating GPCR involvement in PAGln responses by the cells (Fig. 5B, left panel and Fig. S4C–D left). Further, pretreatment of cells with either PTX or CTX, but not YM-254890, significantly suppressed the PAGln-induced DMR response, suggesting Gαi/o and Gαs involvement (Fig. 5B, left panel and Fig. S4C). Moreover, examination of DMR responses to Norepi, which is known to signal through all three of the aforementioned G-protein subunits to variable degree (Hein, 2006), showed significant reduction in DMR signal upon incubations with each of the known GPCR modulator agents (Fig. 5B, middle panel). In contrast, the DMR signal with collagen (negative control), remained unaffected by pretreatment of cells to each of the known GPCR modulator agents (Fig. 5B, right panel). GPCR involvement in PAGln-induced DMR responses were also indicated in HEL.92.1.7 cells, where a similar effect of these G-protein modulators was observed, though unlike in MEG01, the Gαq modulator YM-254890 also displayed a significant reduction in PAGln induced DMR response (Fig. S4E).
The above data suggest PAGln-induced DMR responses in MEG01 and HEL92.1.7 cells appear to be mediated via saturable and specific responses to one or more GPCRs. We therefore examined whether PAGln elicited detectable changes in either intracellular cAMP or [Ca2]i+. As we previously noted with platelets (Fig. 3G), in the absence of other agonists, PAGln alone had no direct effect on [Ca2+]i in either MEG01 (Fig. S5A) or HEL92.1.7 cells (Fig. S5B). But PAGln did elicit a modest (approx. 20–30%) yet significant (P=0.0002 for each) transient (within 5 min) increase in cAMP in both MEG01 cells (Fig. 5C; Fig. S5C), and washed human platelets (Fig. 5D; Fig. S5D). Moreover, pretreatment of each with known GPCR modulators showed CTX or the global GPCR inhibitor SCH-202676 inhibited PAGln-evoked cAMP production, suggesting PAGln exposure triggered Gαs-mediated activation of adenylyl cyclase (Fig. 5C,D; Fig. S5E,F and Fig. S4D right). Isoproterenol (ISO), which predominantly binds to β2-ADRs that primarily couple to the Gαs subunit in both MEG01 cells (Fig. S5G) and in platelets (Fig. S5H) (Koryakina et al., 2012) was used as a positive control. Collectively, these data indicate PAGln mediates cellular responses through GPCR(s) in multiple cells, including isolated human platelets.
The Gut Microbiota-Dependent Metabolite PAGln Acts via ADRs
Given that PAGln mediates cellular responses via GPCR(s), we next sought to determine their identity. While more than 800 distinct GPCRs exist within the human genome, we noted that PAGln has a somewhat similar structure to catecholamines known to bind to the large multi-gene family of ADRs (Fig. 5E). Because ADRs possess a flexible agonist pocket (Masureel et al., 2018), we hypothesized that PAGln may induce cellular signaling through ADRs, focusing on family members present on human platelets (α2A, α2B and β2 ADRs) (Anfossi and Trovati, 1996; Barnett et al., 1985; Colman, 1990). We initially performed loss of function studies in MEG01 cells using both genetic and pharmacological approaches. PAGln-induced DMR responses were monitored following transfection with either control scrambled siRNAs or siRNA targeting either α2A, α2B or β2 ADRs. Importantly, we confirmed > 50% reduction in MEG01 cell mRNA levels of either ADR2A, ADR2B or ADRB2 following siRNA targeting of either α2A, α2B or β2 ADRs, respectively, but no reduction following scrambled siRNAs (Fig. S6A). Notably, each of the siRNAs against the three ADRs demonstrated a significant reduction in PAGln-induced DMR response in MEG01 cells while control siRNA had no effect (Fig. 5F). Positive control (DMR response of epinephrine, which binds to all the aforementioned platelet ADRs to various extent (Hein, 2006)) showed significant reduction in DMR signal with siRNA knockdown of α2A, α2B or β2 ADRs, but not with the control scrambled siRNA (Fig. S6B). Further, the same ADR targeting siRNAs showed no effect on MEG01 DMR responses following exposure to a non-ADR binding ligand, ATP (Fig. S6C).
In complementary studies, we used pharmacological inhibitors against the known ADRs in human platelets (α2A, α2B or β2 ADRs): the selective β2 antagonist ICI118,551, the nonselective β-blocker propranolol, and the nonselective α2 antagonist RX821002 (Atwood et al., 2011; Bilski et al., 1983; O’Rourke et al., 1994). The DMR response induced by PAGln incubation with MEG01 cells was substantially reduced by each of the aforementioned inhibitors, while the inhibitors alone did not affect the DMR response (Fig. 5G). As positive control, the DMR response of the β2 agonist ISO was diminished in presence of either ICI118,551 or propranolol; and the DMR response of the α2 agonist B-HT933 was inhibited with RX821002 (Fig. S6D). The DMR response to the non-ADR binding ligand ATP remained unchanged in the presence of ADR inhibitors (Fig. S6E). Finally, ICI118,551 and propranolol, but not RX821002, inhibited PAGln (5 min exposure) induced cAMP production in both MEG01 cells (Fig. 5H) and platelets (Fig. S6F). Similarly, intracellular cAMP production after ISO treatment in MEG01 (Fig. S6G left) and washed human platelets (Fig. S6G right) was reduced with ICI118,551 or propranolol, but not with RX821002. Thus, both genetic and pharmacological loss of function studies confirm PAGln can induce cellular responses via α2A, α2B and β2 ADRs.
Gain of Function Studies Confirm PAGln Can Signal via α2A, α2B and β2 ADRs
To further confirm the capacity of PAGln to function through ADRs, we carried out gain of function studies by individually over-expressing α2A, α2B and β2 ADRs in human embryonic kidney cells (HEK293), which were selected because of their relatively low endogenous level of ADR density (~34 fmol/mg protein as assessed by [125I]-cyanopindalol binding; Methods). While incubation of either parental or empty vector (EV)-transfected HEK293 cells with PAGln elicited nominal DMR responses, enhanced PAGln-evoked DMR responses were observed with HEK293 cells transfected either transiently with the ADRA2A gene (α2A-HEK293), or stably with either the ADRA2B gene (α2B-HEK293) or ADRB2 gene (β2-HEK293) (Fig. 6A). Moreover, use of the above mentioned selective ADR pharmacological inhibitors reversed the PAGln-induced DMR responses in the corresponding ADR expressing cells (i.e. the PAGln-induced DMR responses in α2A-HEK293 and α2B-HEK293 cells were reversed with RX821002, and the PAGln-induced DMR responses in β2-HEK293 cells were attenuated by either ICI118,551 or propranolol (Fig. 6A)). As additional control studies, we performed similar experiments using the α2 agonist B-HT933 for α2A-HEK293 and α2B-HEK293 cells, and observed an elevated B-HT933-elicited DMR response as compared to parental HEK-293 cells, while responses were attenuated by RX821002 (Fig. S7A). Likewise, the β2 agonist ISO displayed enhanced DMR response in β2-HEK293 cells, which was inhibited with either ICI118,551 or propranolol (Fig. S7A). As an additional (negative) control, ATP-elicited DMR responses remained unaffected in all ADR transfected cells (α2A-HEK293, α2B-HEK293 and β2-HEK293) in the presence of the respective ADR inhibitors (Fig. S7B). In complementary gain of function studies, we analyzed PAGln effects on cAMP levels. Notably, parental HEK293 cells showed no PAGln-evoked change in intracellular cAMP levels (green line), whereas β2-HEK293 cells showed significant PAGln induced increases in cytosolic cAMP levels (blue line) (Fig. 6B). In addition, PAGln dose-dependently increased cAMP production in ADRB2 gene transfected Cricetulus griseus, hamster ovary (CHO-K1) cells, which also possess very low endogenous levels of β2 ADR (~29 fmol/mg receptor density; Methods), similar to positive control ISO. Both PAGln- and ISO-induced cAMP production in the β2 ADR transfected CHO-K1 cells was inhibited by addition of ICI118,551 (Fig. S7C). Furthermore, [Ca2+]i remained unaffected by PAGln exposure in all cells examined (Fig. S8A–E). Thus, both loss of function and gain of function studies, employing either genetic or pharmacological approaches in multiple cell types, confirm that PAGln can induce cellular responses via α2A, α2B and β2 ADRs.
Fig. 6. PAGln Modulates Platelet Function and In Vivo Thrombosis Potential via ADRs.

(A) PAGln (100 μM) DMR response in parental HEK293, empty vector transfected HEK293, ADRA2A transfected HEK293 (left panel), α2B-HEK293 stably expressing (middle panel) and in β2-HEK293 stably expressing cells (right panel) after treating the cells with 10 μM ICI118,551, propranolol or RX821002 for 30 min (n=5–15 as indicated).
(B) cAMP levels in parental HEK293 and in β2-HEK293 stably expressing cells after PAGln treatment for 10 min (n=4–6 as indicated).
(C) ADP-stimulated platelet aggregometry responses in human PRPs (n=5) pre-incubated with the 10 μM propranolol, or RX821002 for 15 min prior to PAGln (100 μM) treatment for 30 min.
(D) Representative pictographs of carotid artery thrombus formation at the indicated time points following FeCl3–induced carotid artery injury in mice i.p. injected with PAGln (or saline) and fed diet ± β-blocker carvedilol (1.5 g/kg; scale bar, 200 μm).
(E) Quantification of occlusive thrombosis for the indicated numbers of mice in each group. Plasma PAGln levels are noted at the bottom. Nonparametric-Mann Whitney (M.W.) test was used for non-pairwise comparisons and Kruskal-Wallis (K.W.) test for multiple comparison. Data points represent the mean ± SEM (n=10–11 as indicated). See also Figure S7–8.
Platelet Hyperresponsiveness and Accelerated In Vivo Rate of Thrombus Generation Evoked by PAGln are Attenuated with Select ADR Inhibitors
The above studies suggest that some of the potential benefits of ADR blocking agents in CVD may arise from antagonism of PAGln induced effects. Consistent with this, we observed exposure of PRP recovered from healthy volunteers with low PAGln levels to pathophysiologically relevant levels of PAGln augmented submaximal ADP-stimulated platelet aggregation responses. Concomitantly, PAGln exposure in the presence of either propranolol, ICI118,551, or RX821002 attenuated PAGln induced platelet hyperresponsiveness (Fig. 6C and Fig. S8F). Moreover, neither ADR inhibitor showed a direct effect on submaximal ADP-stimulated platelet aggregation response (but abolished the PAGln heightened platelet aggregation response; Fig. 6C). Thus, addition of each of the ADR inhibitors reversed PAGln-elicited platelet hyper-responsiveness.
In a final series of studies, we examined the effect of a widely used β-blocker in clinical practice, carvedilol (Gupta et al., 2004), on PAGln induced enhancement in thrombus formation in vivo. Studies were performed as before (Fig. 4) examining the impact of PAGln (acutely elevated via i.p. injection) on FeCl3 induced arterial injury provoked rate of the platelet thrombus formation, and the time to vessel occlusion; however, this time using mice in the absence vs. presence of carvedilol (1.5 g/kg for one week). Notably, in the absence of β-blocker therapy, PAGln again both significantly accelerated the rate of platelet thrombus generation (Fig. 6D) and shortened the time to cessation of blood flow (Fig. 6E). While treatment of mice with carvedilol alone had no effect on in vivo thrombus generation rate or time to cessation of blood flow following arterial injury (P=0.92; Fig. 6E), the pro-thrombotic effect of PAGln was reversed with carvedilol (Fig. 6D,E).
Discussion
Based on prior successes (Koeth et al., 2013; Koh et al., 2018; Li et al., 2018; Wang et al., 2011; Zhang et al., 2018), we hypothesized that using untargeted metabolomics as a discovery platform, coupled with functional studies, could serve as a relatively unbiased approach for revealing new metabolic pathways in humans that potentially contribute to the development of CVD and its adverse complications. To both enrich our potential pool of candidate metabolic derangements associated with incident CVD event risks and enhance the likelihood of uncovering a novel pathway, we elected to initially focus our studies on a vulnerable patient population at known heightened CVD risks but via unclear mechanisms - diabetics, (i.e. the heightened CVD risks in T2DM are recognized to be, in part, via mechanisms distinct from traditional CVD risk factors and the degree of glucose control (Action to Control Cardiovascular Risk in Diabetes Study et al., 2008; Duckworth et al., 2009; Gerstein et al., 2001; Piarulli et al., 2009)). We thus sought to identify circulating metabolites that were increased in T2DM, associated with development of CVD, and poorly correlated with indices of glycemic control (i.e. fasting glucose, HgbA1C, glucose/insulin ratio). Remarkably, many of the top candidates identified that met these criteria proved to be mechanistically linked to gut microbiota (e.g. PAGln, TMAO and TML; Table S1,S2; (Koeth et al., 2013; Tang et al., 2013; Wang et al., 2011; Zhu et al., 2016). Moreover, PAGln (like TMAO and TML), was observed to be associated with incident CVD risks in both T2DM subjects and non-diabetic subjects alike. Thus, use of untargeted metabolomics, coupled with functional studies, has proven to be a valuable approach for discovery of new pathways clinically and mechanistically linked to CVD. Moreover, a remarkable proportion of metabolic candidates/pathways identified are linked to gut microbiome – the filter of our largest environmental exposure – what we eat (Aron-Wisnewsky and Clement, 2016; Brown and Hazen, 2018; Jonsson and Backhed, 2017; Koeth et al., 2019; Koh et al., 2018; Koopen et al., 2016).
A scheme summarizing the metaorganismal origins of PAGln, its recognition by ADRs, and its overall relationship with CVD as revealed through the studies presented, is illustrated in Figure 7. Following ingestion of Phe, the majority of the essential amino acid is absorbed in the small intestines, but unabsorbed Phe that reaches the large intestines can be metabolized by gut microbiota to form phenylpyruvic acid (the initial microbiota generated deamination product) and subsequently PAA. Following absorption into the portal system, PAA is readily metabolized in the liver to produce PAGln (major product in humans) and PAGly (major product in mice). PAGln has long been recognized as a synthetic product of PAA and Gln by liver and renal tissues of humans (Moldave and Meister, 1957), as well as a non-invasive probe of citric acid cycle intermediates in humans and primates (Yang et al., 1996). The present studies confirm a major role for gut microbiota in PAGln (and PAGly) generation in both humans and mice, as shown in studies with antibiotic cocktail to suppress gut microbiota, and corroborative studies using GF vs. conventionally reared mice. Notably, a limited number of recent studies have suggested an association between PAGln and some cardiometabolic phenotypes using semi-quantitative analyses. For example, PAGln levels were noted to be substantially increased in subjects with end-stage renal disease (to more than 500 μM in some subjects (Meyer et al., 2016)) and associated with mortality in one study (Shafi et al., 2015). However, no association between PAGln and mortality was observed in another study of end-stage renal disease subjects, though significant elevation with renal disease was reported (Shafi et al., 2017). Elevated urinary levels of PAGln have also recently been associated with obesity (Elliott et al., 2015), early renal function decline (Barrios et al., 2015; Poesen et al., 2016) and diabetes (Loo et al., 2018; Urpi-Sarda et al., 2019). Despite these reports, a mechanistic link between PAGln and CVD pathogenesis has not yet been reported.
Figure 7. Gut-Microbial Metabolite PAGln Involvement in Enhancement of Platelet Thrombotic Potential via ADRs.

The present studies suggest several mechanisms through which the clinical association between heightened PAGln and incident CVD risks may occur. First, PAGln was shown to impact thrombosis potential through multiple complementary approaches. Ex vivo cellular studies using whole blood, PRPs, and isolated platelets all indicate PAGln (and PAGly) enhance platelet function (enhanced stimulus dependent responsiveness to multiple agonists and intracellular calcium release). Furthermore, numerous in vivo studies reveal pathophysiologically relevant levels of PAGln or PAGly each facilitate both enhanced rate of thrombus formation and thrombosis potential in arterial injury models, including studies ranging from direct administration of either PAGln or PAGly, to microbial transplantation studies that modulate production of PAA, the precursor of PAGln (and PAGly). Notably, microbial engineering and transplantation studies into gnotobiotic mice reveal that the relative activity of the gut microbial fldH gene cluster vs. the porA gene can regulate gut microbial production of PAA vs. PPA, impacting PAGly production within the host. Critically, the balance between gut microbial activities of either the FldH vs. PorA protein ultimately impacted the in vivo thrombosis potential in the colonized mice under gnotobiotic conditions, as monitored by both rate of thrombus formation and vessel occlusion time following arterial injury.
Another mechanism through which PAGln may impact CVD relevant phenotypes is via its demonstrated interactions with GPCRs, including ADRs. Direct biophysical studies indicate saturable and specific binding of PAGln to cells, indicative of a cell receptor – ligand interaction, and studies with multiple complementary known GPCR inhibitors modulate PAGln mediated cellular responses and down-stream signaling. A systematic series of genetic loss-of-function studies, and gain-of-function studies, as well as multiple corroborative pharmacological inhibitor and agonist studies, unambiguously show PAGln can signal via α2A, α2B and β2 ADRs - ADRs known to be expressed on platelets. Moreover, PAGln elicited pro-thrombotic effects in a murine model of arterial injury were reversed by treatment of mice with a widely used β-blocker in clinical practice. In addition, studies with either specific ADR siRNA knockdown or ADR antagonists were both shown to block PAGln induced pro-thrombotic phenotypes, further indicating PAGln can promote cellular signals via ADRs. β-Blocker therapy is known to foster numerous clinical benefits in some subjects with CVD (e.g. reduced risks of heart attack, stroke, heart failure and death (Black et al., 2010; Burnett et al., 2017; Witte et al., 2018)). The present results suggest some of the clinical benefits observed with β-blocker therapy may in part be mediated via attenuation in PAGln-triggered ADR signaling events in vivo. It is notable that carvedilol has been shown to promote inhibition of platelet function in several trials (Petrikova et al., 2005; Ilardi et al., 2018), and the present studies suggest a potential mechanism through which this may occur. ADRs are widely expressed on virtually every cell type, and known to play important roles in myocardial and vascular function, as well as regulation of body homeostasis in both health and pathologic states (Amrani and Bradding, 2017; Hein and Kobilka, 1997; Lefkowitz et al., 2000; Rockman et al., 2002). Activation of the adrenergic system also has profound effect on metabolism and prolonged activation can lead to insulin resistance, alterations in glucose and fatty acid metabolism and mitochondrial dysfunction (Ciccarelli et al., 2013; Fu et al., 2017). Although the present studies currently focused only on three ADRs that are expressed in human platelets, one can speculate that PAGln has potential to modulate other ADRs, and accordingly, may potentially affect multiple ADRs – linked physiological processes in vivo.
STAR Methods text
LEAD CONTACT AND MATERIALS AVAILABILITY
Further information and requests for resources and reagents should be directed to and will be fulfilled by the Lead Contact, Stanley L. Hazen (hazens@ccf.org). All unique/stable reagents generated in this study are available from the Lead Contact with a completed Materials Transfer Agreement. Plasmids generated in this study have been deposited to Addgene pcDNA3.1(+)-ADRA2A-N-DYK, pcDNA3.1(+)-ADRA2B-N-DYK and pcDNA3.1(+)-ADRB2-N-DYK (Cat# 139514, 139515 and 139516, respectively).
EXPERIMENTAL MODEL AND SUBJECT DETAILS
Human Subjects
All subjects gave written informed consent and the Institutional Review Board of the Cleveland Clinic approved all study protocols. The Discovery Cohort (n=1,157) employed for untargeted metabolomics investigations, and the independent non-overlapping Validation Cohort (n=4,000), were obtained from sequential consenting subjects enrolled in the study GeneBank at the Cleveland Clinic. GeneBank is a large (n>10,000) and well-characterized single center cohort with associated tissue repository and longitudinal follow-up clinical database. GeneBank included sequential stable subjects undergoing elective diagnostic coronary evaluations. All subjects underwent elective diagnostic coronary angiography (cardiac catheterization or coronary computed tomography) for evaluation of CAD (Tang et al., 2013; Wang et al., 2011; Wang et al., 2007). All subjects had extensive clinical and longitudinal outcome data monitored, including adjudicated outcomes over the ensuing 3 to 5 years after enrollment. MACE (Major Adverse Cardiovascular Event) was defined as death, nonfatal myocardial infarction, or nonfatal cerebrovascular accident (stroke) following enrollment. High-sensitivity C-reactive protein, and lipid profiles were measured on the Roche Cobas platform (Roche Diagnostics).
Normal range levels of PAGln and PAGly were determined from plasma recovered from a random subset (n=25) of consenting non-fasting subjects undergoing community health screens. Subjects had no medical history of cardiovascular or metabolic diseases, normal vital signs and screening laboratory results (lipid profile, basic chemistry panel), and no history of taking any medications. Human blood for preparing platelet rich plasma and washed platelet isolation was obtained from healthy consenting donors. In additional studies, healthy volunteers (n=15) were consented and subjected to a cocktail of oral antibiotics for 7 days (either ciprofloxacin, metronidazole and vancomycin; or ciprofloxacin, metronidazole, vancomycin and neomycin), as previously described (Tang et al., 2013). Volunteers were not pregnant nor had a chronic illness (including a known history of heart failure, renal failure, pulmonary disease, gastrointestinal disorders, or hematologic diseases). Blood was collected after overnight fasting at 3 different time points: at base line (before antibiotics treatment (pre-Abx); right after the 7 day antibiotics regiment (Abx), and after an antibiotics washout period (minimum three weeks) to permit repopulation of normal gut microorganisms (Post-Abx).
Mice
C57BL/6J mice, 8–10 weeks old, were purchased from The Jackson Laboratory and maintained in our facilities. In addition to germ free mice raised in the Cleveland Clinic Lerner Research Institute Gnotobiotic Facility, some of the studies employed germ-free C57BL/6 male mice (8–10 weeks old) that were raised at the University of Wisconsin-Madison or University of Nebraska-Lincoln gnotobiotic animal facilities and shipped germ free to the Cleveland Clinic Lerner Research Institute Gnotobiotic Facility. All gnotobiotic mice were housed in controlled environments in plastic flexible film gnotobiotic isolators with HEPA filters under a strict 14 h light/10 h dark cycle, and with access to sterilized water and food ad libitum. Animal care and experimentation were consistent with NIH guidelines and all animal model studies were approved by the Institutional Animal Care and Use Committee at the Cleveland Clinic.
Microorganisms
Clostridium sporogenes (ATCC, 15579) was routinely cultured in TYG (3% w/v tryptone, 2% w/v yeast extract, 0.1% w/v sodium thioglycolate) broth at 37 °C in an anaerobic chamber from Coy Laboratories in an atmosphere of 5% H2, 10% CO2 and 85% N2. The cells were stored as anaerobically prepared 25% v/v glycerol stocks sealed in 12 × 32 mm glass crimp top vials to ensure anoxic conditions during long-term storage. All manipulations with C. sporogenes were performed in the anaerobic chamber and with medium and reagents pre-reduced for at least 48 h. The Escherichia coli CA434 (HB101/pRK24) conjugation host was routinely cultured at 30 °C in LB broth supplemented with tetracycline (12 μg/mL) to ensure maintenance of the pRK24 plasmid. E. coli TG1 was used for routine cloning. Chloramphenicol (25 μg/mL) was used for selection of pMTL007C-E2 plasmids in E. coli. HMP reference strains were obtained from the BEI Resources and were cultured in reinforced clostridial medium (RCM) modified to exclude agar and prevent interference with downstream assays. Mutant lacking the cutC gene (Guo et al., 2019) was used for the second gene (fldH or porA disruption). The second gene was disrupted using the ClosTron mutagenesis system, as previously described (Dodd et al., 2017). E. coli CA434 (HB101/pRK24) harboring the pMTL007C-E2 with the specific sites retargeting fldH (CLOSPO_00316) or porA (CLOSPO_00147) were kindly provided from Justin Sonnenburg Lab. To introduce plasmid DNA into C. sporogenes, we performed bi-parental mating using a custom filter-mating-based approach. First 1 ml of overnight culture (24–30 h) of these E. coli transformants were harvested and washed with sterile phosphate-buffered saline (PBS) to remove residual antibiotics. The cell pellet was re-suspended with 200 μL of an overnight culture in TYG broth (~18 h) of C. sporogenes cutC mutant and was incubated anaerobically at 37 °C on TYG agar plates without antibiotics. After 2 days, the cells was collected by scraper and re-suspended with 300 μl of PBS. The cell suspension was plated on TYG agar plates supplemented with D-cylcoserine (250 μg/mL) and thiamphenicol (15 μg/mL) and incubated anaerobically at 37 °C for a few days. Antibiotic resistant colonies were picked and re-streaked on agar plates containing the same antibiotics. Individual well-isolated colonies were then picked and inoculated into TYG broth containing the same antibiotics and glycerol stocks were prepared. Colonies verified by PCR to contain the plasmid of interest were cultured anaerobically in TYG with D-cylcoserine and thiamphenicol, then 100 μL of undiluted, 10-fold diluted or 100-fold diluted cultures were spread onto TYG agar plates supplemented with erythromycin (5 μg/mL). The antibiotic resistant colonies were picked, re-streaked onto TYG agar plates supplemented with erythromycin and well-isolated colonies were inoculated into TYG broth supplemented with erythromycin. Genomic DNA was isolated from candidate clones using the DNeasy Blood and Tissue Kit from Qiagen and this DNA was used as a template in a PCR using the gene-specific primers. Primer sets were designed to produce a ~600-bp product for the wild-type and ~2,800-bp product for the mutant containing the intron. When verified mutants were streaked onto TYG plates containing thiamphenicol, no growth was observed, indicating that the loss of the pMTL007C-E2 plasmid had occurred. Germ-free, C57BL/6 (male, 8–10-weeks-old), mice were mono-colonized by oral gavage with C. sporogenes mutants as described below in METHOD DETAILS.
Cell Lines
Bone marrow derived cell lines, MEG-01 (ATCC, CRL-2021) and HEL92.1.7 (ATCC, TIB-180) were grown in RPMI 1640 media and kept at 37 °C in 5% carbon dioxide (CO2) incubator. Chinese hamster ovary (CHO)-K1 cells (ATCC, CCL-61) and human embryonic kidney (HEK293) cells (ATCC, CRL-1573) were cultured in DMEM media and kept in a 5% CO2 incubator at 37 °C. ADRA2B-HEK293 cells were stably transfected with pcDNA3.1(+)-ADRA2B-N-DYK and G418-resistant cell pool expanded after being selected with G418 (1.5 mg/ml). Unless otherwise stated, all culture media were supplemented with fetal bovine serum (FBS; 10%), penicillin (100 U/mL) and streptomycin (100 μg/mL). β2-HEK293 were cultured as previously described (Watson et al., 2016). Before use, all cell lines used were tested to confirm negative status for mycoplasma (CC cell culture facility).
Plasmids
Mammalian expression plasmids for transfection were made from the human ADRA2A, ADRA2B, and ADRB2 cDNA sequences which were synthesized by Genscript (Piscataway, NJ) to lack their initiating methionine (ATG) but to include an amino terminal encoded GGS linker and these ORFs were cloned in-frame behind the DYK (FLAG®) epitope in pcDNA3.1(+)-N-DYK to create pcDNA3.1(+)-ADRA2A-N-DYK, pcDNA3.1(+)-ADRA2B-N-DYK and pcDNA3.1(+)-ADRB2-N-DYK respectively. The vector pcDNA3.1(+)-N-DYK was from Genscript (Piscataway, NJ).
Platelet Rich Plasma and Washed Platelet Isolation from Consenting Human Donors
Platelet rich plasma (PRP) was prepared as previously described (Zhu et al., 2016). Whole blood was collected from consenting healthy donors using sodium citrate (0.109 M) as anticoagulant. PRP was isolated by centrifuging at 100 x g for 10 min at 22°C. Platelet poor plasma (PPP) was prepared by further centrifugation of remaining blood at 11,000 x g for 2 min. Platelets were counted using a hemocytometer and for aggregometry assays, concentrations were adjusted to 2×10⁸/mL with PPP. To prepare washed platelets for intracellular Ca2+ measurements, 100 nM prostaglandin E1 (PGE-1) was added to PRP and the PRP was then centrifuged at 500 x g for 20 min at 22 °C. The platelet pellet was gently washed with a modified phosphate buffer saline (NaCl (137 mM), KCl (2.7 mM), Na2HPO4 (12 mM), MgCl2 (1 mM), and glucose (5.5 mM), pH 7.4) with PGE-1 (100 nM), and centrifuged again at 500 x g for 20 min. Platelet pellet was then re-suspended in modified Hank’s buffered salt solution (HBSS-BSA-glucose; NaCl (0.137 M), KCl (5.4 mM), Na2HPO4 (0.25 mM KH2PO4 (0.44 mM), CaCl2 (1.3 mM), MgSO4 (1.0 mM), NaHCO3 (4.2 mM), glucose (5 mM ) and BSA (0.1%)) with 100 nM PGE-1. For ratiometric fluorescence measurements, washed platelets were incubated with Fura 2-AM (1 μM) at 22 °C for 30 min. Excess Fura 2-AM was removed by centrifugation at 500 x g for 30 min. Platelet pellet was then re-suspended in modified Hank’s buffered salt solution.
METHOD DETAILS
Untargeted LC–MS/MS Analysis of Human Plasma Samples
Untargeted analysis of plasma samples was similar to that described previously (Tsugawa et al., 2015) but with minor modifications. Polar metabolites were extracted from a plasma sample (30 μL) following protein precipitation using an acetonitrile/isopropanol/water (3:3:2, v/v/v) mixture (1 mL). Aliquots (300 μL) were evaporated, resuspended using an acetonitrile/water (4:1, v/v) mixture (60 μL) containing a series of deuterated internal standards, vortexed, centrifuged, and 50 μL supernatant was transferred to a glass vial with a microinsert. Hydrophilic interaction chromatography (HILIC) analysis was performed on a system including an Agilent 1290 Infinity LC system (Agilent Technologies) with a pump (G4220A), a column oven (G1316C), an autosampler (G4226A), and a TripleTOF 5600+ (SCIEX). Extracts were separated on an Acquity UPLC BEH Amide column (150 × 2.1 mm; 1.7 μm, Waters) coupled to a Waters Acquity UPLC BEH Amide VanGuard precolumn (5 × 2.1 mm; 1.7 μm). The column was maintained at 45°C at a flow rate of 0.4 mL/min. The mobile phases consisted of (A) water with ammonium formate (10 mM) and formic acid (0.125%) and (B) 95:5 (v/v) acetonitrile/water with ammonium formate (10 mM) and formic acid (0.125%). The separation was conducted using the following gradient: 0 min 100% B; 0–2 min 100% B; 2–7.7 min 70% B; 7.7–9.5 min 40% B; 9.5–10.25 min 30% B; 10.25–12.75 min 100% B; 12.75–17.75 min 100% B. A sample volume of 1 μl was used for the injection. Sample temperature was maintained at 4°C. The QTOF-MS instrument was operated with electrospray ionization in positive ion mode with the following parameters: curtain gas, 35 psi; ion source gas 1, 50 psi; ion source gas 2, 50 psi; temperature, 300°C; ion spray voltage floating, 4.5 kV; declustering potential, 100 V; acquisition speed, 2 spectra/s. For data processing MZmine 2 (Pluskal et al., 2010) and MultiQuant (SCIEX) software programs were used.
Compound Identification
To chemically define the structures of the plasma analyte with m/z 265.1188 as PAGln, several approaches were used. PAGln in plasma was identified by HPLC/high-resolution mass spectrometry by demonstrating the same retention time, and high-resolution mass spectrum as authentic standard. Plasma supernatant after protein precipitation with methanol (1:4; v/v) was analyzed by injection onto a C18 column or HILIC column using a 2 LC-20AD Shimadazu pump system with SIL-HTC autosampler interfaced (Shimadzu Scientific Instruments, Inc., Columbia, MD, USA) in tandem with a TripleTOF 5600 mass spectrometer (AB SCIEX). Separation was performed by employing the following gradients: For reverse phase chromatographic Kinetex C18 column (50 mm × 2.1 mm; 2.6 μm) (Cat # 00B-4462-AN, Phenomenex, Torrance, CA) was used. Solvent A (0.1% acetic acid in water) and B (0.1% acetic acid in acetonitrile) were run under the following gradient: 0.0 min (0% B); 0.0–2.0 min (0% B); 2.0–5.0 min (0%B→20%B); 5.0–6.0 min (20%B→60%B); 6.0–7.5 min (60%B→70%B); 7.5–8.0 min (70%B→100%B); 8.0–9.5 min (100%); 9.5–10 min (100%B→0%B); 10.0–15.0 min (0% B) with flow rate of 0.4 mL/min and the injection volume of 1 μL. For separation on HILIC column BEH amide column (Bridge column; BEH amide 2.1 × 150 mm x 2.5 μm column) (Cat# 186006724, Waters, Ireland) was used. Solvent A (10 mM ammonium acetate + 0.125% acetic acid in water) and B (10 mM ammonium acetate + 0.125% acetic acid in 95% acetonitrile and 5% water) were run under the following gradient: 0.0 min (100%); 0.0–0.5 min (100% B→70% B); 0.5–1.0 min (70% B→60% B); 1.0–2.0 min (60% B); 2.0–7.0 min (60% B→50% B); 7.0–8.0 min (50% B); 8.0–9.0 min (50% B → 100% B); 9.0–14.0 min (100%). The flow rate was 0.2 mL/min from 0.0–9.0 min and 0.4 mL/min 9.5–14 min. To further confirm the compound’s structure, the analyte with m/z 265.1188 was first purified from human plasma using the following procedures. Proteins from human plasma (500 mL) were precipitated with ice-cold methanol (1:4; v/v), and supernatant was dried under reduced pressure. The dry residue was dissolved in water with 0.1% acetic acid (50 mL) and subjected to sold phase extraction on C18 cartridges (Strata C18_E (55 μm, 70 A; 20 g/60 mL Giga Tubes, Phenomenex, Cat# 8B-S001-VFF). Eluted fractions were analyzed by LC-MS/MS and peak fractions containing the compound (with m/z 265.1188 and the appropriate retention time) were pooled and dried under reduced pressure. The dried residue was further purified on a semi-preparative C18 column (ODS, 10×250 mm; 5 μm) (Beckman Coulter) by HPLC. The mobile phases consisted of solvents A (0.2% acetic acid in water) and B (0.2% acetic acid in 90% methanol in water) under the following gradient: 0–23 min (0% B→80% B); 23–37 min (80% B → 100% B); 27–32 min (100% B). Fractions were collected every 0.5 min. Fractions containing the compound with m/z 265.1188 were dried under reduced pressure and the residue was dissolved in a water solution of NaOH (5.0 mL, 5 mM). In parallel, authentic PAGln standard was similarly resuspended in NaOH (5 mM) and both the semi-purified plasma analyte with m/z 265.1188 and the authentic PAGln standard were derivatized separately and analyzed as follows. An aliquot (300 μL) of the purified plasma sample or PAGln NaOH solution was transferred to a glass tube and mixture of propanol/pyridine (3:2, v/v, 300 μL) and propyl chloroformate (50 μL) was added to the samples, and the tubes were capped, vortexed (1 min), and sonicated (2 min). Hexane (300 μL) was added, and liquid/liquid extraction was performed by vortexing the samples for 5 min. The samples were centrifuged (20 min, 5000 x g), and the organic layer was transferred to another glass tube and dried under stream of nitrogen. Dry residue was dissolved in 50% methanol in water and subjected to LC-MS analysis on C18 column as described above.
Targeted LC-MS/MS Analysis of Human Plasma Samples
Stable-isotope-dilution LC-MS/MS was used for quantification of PAGln in human (20 μL) plasma. Ice cold methanol containing internal standard (D5-phenylacetylglutamine) was added to plasma samples (80 μL), followed by vortexing and centrifuging (21,000 x g; 4 °C for 15 min). The clear supernatant was transferred to glass vials with microinserts and LC-MS/MS analysis was performed on a chromatographic system consisting of two Shimadzu LC-30 AD pumps (Nexera X2), a CTO 20AC oven operating at 30 °C, and a SIL-30 AC-MP autosampler in tandem with 8050 triple quadruple mass spectrometer (Shimadzu Scientific Instruments, Inc., Columbia, MD, USA). For chromatographic separation, a Kinetex C18 column (50 mm × 2.1 mm; 2.6 μm) (Cat # 00B-4462-AN, Phenomenex, Torrance, CA) was used. Solvent A (0.1% acetic acid in water) and B (0.1% acetic acid in acetonitrile) were run using the following gradient: 0.0 min (0% B); 0.0–2.0 min (0% B); 2.0–5.0 min (0%B→20%B); 5.0–6.0 min (20%B→60%B); 6.0–7.5 min (60%B→70%B); 7.5–8.0 min (70%B→100%B); 8.0–9.5 min (100%); 9.5–10 min (100%B→0%B); 10.0–15.0 min (0% B) with a flow rate of 0.4 mL/min and a 1 μL injection volume. Electrospray ionization in positive mode with multiple reaction monitoring (MRM) was used with the following transitions: m/z 265.2→130.15 for PAGln and D5-PAGln m/z 270.1→130.15. The following ion source parameters were applied: nebulizing gas flow, 3 L/min; heating gas flow, 10 L/min; interface temperature, 300 °C; desolvation line temperature, 250 °C; heat block temperature, 400°C; and drying gas flow, 10 L/min. The limit of detection (LOD; 3:1 signal to noise cutoff) and limit of quantification (LOQ; 10:1 signal to noise cutoff) were 0.010 and 0.033 μM, respectively. Quality control samples were run with each batch of samples and inter-batch variations expressed as coefficient of variation (CV) were less than 10%. For data analysis software Lab Solution (Shimadzu) was used.
In Vitro Screening of Phenylacetic Acid and Phenylpropionic Acid Production from Phenylalanine by C. sporogenes Mutants
C. sporogenes mutants were grown on tryptic soy blood agar plates (TSBA; Anaerobe Systems, Cat# AS-542) anaerobically for 48 to 72 h at 37 °C. Single colonies were then inoculated into Mega Medium (3 mL) and grown anaerobically overnight at 37 °C. Overnight culture (100 μL) was added to fresh Mega Medium (1 mL) containing [13C9,15N]-Phe (100 μM) and cultured an additional 24 h. Cultured media was centrifuged and the supernatant was pass through 3K centrifugal filters (Amicon Ultra-0.5 mL Centrifuge filters, Ultracel-3K, Merck Millipore Ltd.). Filtrate (20 μL) was subjected to stable-isotope-dilution LC-MS/MS analysis for quantification of [13C8]-phenylacetic acid and [13C9]-phenylpropionic acid. Ice cold methanol containing internal standard ([13C2]- phenylacetic acid; 80 μL) was added to the supernatant, followed by vortexing and centrifuging (21,000 x g; 4 °C for 15 min). The clear supernatant was transferred to glass vials with microinserts. LC-MS/MS analysis was performed on a chromatographic system composed of two Shimadzu LC-30 AD pumps (Nexera X2), a CTO 20AC oven operating at 30 °C, and a SIL-30 AC-MP autosampler in tandem with 8050 triple quadruple mass spectrometer (Shimadzu Scientific Instruments, Inc., Columbia, MD, USA). For chromatographic separation, a Kinetex C18 column (50 mm × 2.1 mm; 2.6 μm) (Cat # 00B-4462-AN, Phenomenex, Torrance, CA) was used. Solvent A (0.1% acetic acid in water) and B (0.1% acetic acid in acetonitrile) were run using the following gradient: 0.0 min(0% B); 0.0–2.0 min (0% B); 2.0–5.0 min (0%B→20%B); 5.0–6.0 min (20%B→60%B); 6.0–7.5 min (60%B→70%B); 7.5–8.0 min (70%B→100%B); 8.0–9.5 min (100%); 9.5–10 min (100%B→0%B); 10.0–15.0 min (0% B) with flow rate of 0.4 mL/min and the injection volume of 1 μL. Electrospray ionization in the negative ion mode was used with multiple reaction monitoring (MRM) using the following transitions: m/z 135.0→91.0 for phenylacetic acid; m/z 143.0→ 98.0 for [13C8]- phenylacetic acid; m/z 149.50→105 and m/z 158→113.0 for phenylpropionic and [13C9]-phenylpropionic acid, respectively and m/z 137.0→92.0 for [13C2]- phenylacetic acid (internal standard).
Murine Antibiotic Challenge
C57BL/6J males (n=11) and females (n=15) 8–10 weeks old were treated with an antibiotic cocktail to suppress gut-microbial growth, as previously described (Devlin et al., 2016). Whole blood was collected via saphenous vein (survival collection) into heparin treated capillary tubes for base line measurements from mice on regular chow diet. After the baseline collection, mice were given an antibiotic cocktail in their drinking water consisting of kanamycin (0.4 mg/mL), gentamycin (0.035 mg/mL), colistin (0.057 mg/mL), metronidazole (0.215 mg/mL), vancomycin (0.045 mg/mL), and erythromycin (0.01 mg/mL). The antibiotic cocktail was administered for a total of 5 days, and then second blood collection was performed. After that mice were put back on regular water without antibiotics. To facilitate microbial recolonization, fecal pellets from conventionally reared littermates, never treated with antibiotics, were added to the cage bedding. Third blood collection was performed 7 days after the antibiotics withdrawal.
Whole Blood In Vitro Thrombosis Assay
Microfluidic shear flow experiments were performed using the Cellix Microfluidics System (Cellix Ltd., Dublin, Ireland). Where indicated, each micro channel of a Vena8 Fluoro+ biochip was coated with type 1 collagen (15 μL; 150 μg/mL) and placed in a humidified box overnight at 4 °C. Before use each channel of the Vena8Fluoro+ biochip was washed with 1X PBS using the Mirus Nanopump. Images were collected using an HC Plan Apo 20X/0.7NA lens on a Leica DMI6000 inverted microscope equipped with an environmental chamber and a Hamamatsu ImagEM cooled CCD camera. Whole blood collected from consented healthy volunteers was fluorescently tagged with Calcein AM and was pretreated with PAGln (10 μM or 100 μM, pH 7.4) or normal saline (control) for 30 min at 22°C. After the incubation, blood was then perfused over chips coated with or without immobilized type 1 collagen (150 μg/mL) at a physiological shear rate (67.5 dynes/cm2) using a multi-channel microfluidic device for 3 minutes. Images of fluorescent platelets adhering to the collagen coating were captured every 5 seconds during that time. In experiments with P-selectin staining, whole blood pretreated with PAGln or saline was stained with phycoerythrin (PE) conjugated anti-P-selectin (CD62P) antibody for 10 min before perfusion over the collagen coated chip at physiological shear rates. At the end of the experiment, the tube containing the whole blood was removed and the 1X PBS in the biochip reservoir was drawn through the channel at 20 dynes/cm2. Ten images were captured along the length of the channel during that time. Platelet activation and adherence to the collagen surface was then quantified with computer assisted tomographic analyses as previously described (Gupta et al., 2015; Srikanthan et al., 2014). Briefly, images of P-selectin and calcein AM stained thrombi were quantified using Image Pro plus software (Media Cybernetics, Inc., Rockville, Maryland, USA). Intensity threshold was chosen to select for specific staining and quantified for integrated optical density (IOD, Area X Intensity).
Aggregometry Assay in Human Platelets Rich Plasma
Aggregometry assays were performed as previously described (Zhu et al., 2016). Whole blood was collected from consenting healthy donors using sodium citrate (0.109 M) as anticoagulant and PRPs were prepared as described above. Platelets were counted using a hemocytometer and concentration was adjusted to 2×10⁸/mL with platelet poor plasma. PRPs were then pre-incubated with PAGln or PAGly (100 μM or at indicated concentrations) or vehicle for 30 minutes at 22 °C. After 30 minutes of pre-incubation PRPs were maintained in suspension with constant stirring (600 rpm) at 37 °C and platelet aggregation was initiated using ADP (up to 4 μM) or TRAP6 (up to 10 μM) or collagen (up to 1.0 μg/mL).
Intracellular Ca2+ Measurements
Washed platelets from whole blood were prepared and loaded with the ratiometeric calcium sensing dye, Fura-2, as described above. Platelet pellet, after Fura-2 loading, was re-suspended in modified Hank’s buffered salt solution and was pre-incubated with PAGln or PAGly (100 μM or at the indicated concentrations) or vehicle for 30 minutes at 22 °C. After the 30 minute pre-incubation, intracellular calcium release from washed platelets was induced by suboptimal concentration of thrombin (0.02U) and changes in [Ca2+]i was monitored by measuring Fura 2-AM fluorescence using 340/380 nm dual-wavelength excitation and an emission of 510 nm. Studies were performed at 37 °C with constant stirring in a temperature controlled spectrofluorometer (Zhu et al., 2016).
Platelet Flow Cytometry Assay
Washed platelets and antibody staining for flow cytometry was performed as described previously with slight modification (Cameron et al., 2018; Schmidt et al., 2018). Whole blood was collected from consenting healthy donors using sodium citrate (0.109 M) as anticoagulant. PRPs were separated by centrifuging at 100 x g for 10 min at 22 °C. PRPs were then re-suspended in modified Hank’s buffered salt solution (HBSS-BSA-glucose; NaCl (0.137 M), KCl (5.4 mM), Na2HPO4 (0.25 mM), KH2PO4 (0.44 mM) CaCl2 (1.3 mM), MgSO4 (1.0 mM), NaHCO3 (4.2 mM), glucose (5 mM) and BSA (0.1%)) with PGE-1 (100 nM). Washed platelets were separated by centrifugation at 500 x g for 10 min and re-suspended in modified Hank’s buffered salt solution without PGE1. Final platelet suspensions (100 μL; 2×10⁸ platelets/mL) were then pre-incubated with PAGln (100 μM or at indicated concentration) for 30 minutes at 22 °C before stimulation with 2 μM ADP for 10 min. PE conjugated anti-P-selectin (CD62P-PE; 1 μL) or Fluorescein isothiocyanate (FITC) conjugated PAC1 (binds only to active conformation of GP IIb/IIIa) or isotype control antibody was added to each tube and incubated in the dark for 20 minutes (to avoid photo bleaching). The platelet suspensions were then fixed with 100 μL of 2% paraformaldehyde. Data was acquired on a flow cytometer (FACS LSRFortessa, BD Biosciences). The instrument was set up and standardized using BD Cytometer Setup and Tracking (CS&T) procedures according to manufacturer specifications. Twenty thousand (20,000) events were acquired. The data was analyzed using FlowJo v10 software. The washed platelets were gated to exclude doublets and the raw mean fluorescent intensity (MFI) of either P-selectin (CD62P) or PAC-1 was generated.
Gnotobiotic Mouse Colonization
C. sporogenes mutants were grown on tryptic soy blood agar plates (TSBA; Anaerobe Systems, Cat# AS-542) anaerobically for 48 to 72 h at 37 °C. Single colonies were picked and used to inoculate Mega Medium (3 mL) in prepared Hungate Tubes. Cultures were grown anaerobically for 18–24 h at 37 °C. At that time an aliquot of culture (500 μL) was removed and the remaining bacterial culture was diluted 1:1 with glycerol (40%) in water (v:v) and stored at −80 °C. The aliquot was centrifuged and supernatant screened on the LC/MS for metabolite profile while DNA was isolated from the pellet for both 16s rRNA gene sequencing (described below) and PCR confirmation of presence/absence of porA or fldH. Germ-free, C57BL/6, male, 8–10-week-old mice were mono-colonized by oral gavage with ~0.2 mL of bacterial culture inside the biological safety cabinet, using indicated the C. sporogenes mutants. Mice were maintained on a sterilized diet and 24 h prior to in vivo thrombosis were injected with filtered sterilized folic acid (250 mg/kg). At the time of sacrifice (2–7 days post colonization), mice were subjected to carotid artery FeCl3 injury thrombosis assay and tissues were collected immediately after the assay, frozen, and stored at −80 °C. Following colonization, the investigator was not blinded from treatment groups to avoid cross contamination.
To confirm colonization DNA was isolated from flash frozen cecal contents of colonized mice with the NucleoSpin Tissue kit (Macherey-Nagel) according to manufacturer’s instructions for bacterial DNA isolation. Isolated DNA was used in a PCR reaction with GoTaq Green Master Mix and the 8F and 1492R 16S rRNA universal primers. PCR reactions were carried out in a 96 well plate with 20 μl final reaction volumes as follows: 95 °C for 2 minutes; 95 °C for 30 seconds, 51 °C for 30 seconds, 72°C for 1 minute and 20 seconds (x30); 72 °C for 5 minutes. Completed reactions were sent to Eurofins Genomics for PCR cleanup and 16S rRNA gene sequencing using their standard house primers (16F). Sequence identity was confirmed using NCBI BLAST.
Carotid Artery FeCl3 Injury Thrombosis Assay
Monocolonized or i.p. injected mice (vehicle (normal saline); PAGln (50 mg/kg); PAGly (50 mg/kg)) were anesthetized with ketamine and xylazine and subjected to a common carotid artery injury as previously described (Zhu et al., 2016). Rhodamine 6G (100 μL; 0.5 mg/mL) was injected directly into the right jugular vein to label platelets. The left carotid artery was exposed and injured by placing 1.5 × 1.5 mm2 Whatman filter paper soaked in 10% FeCl3 solution to the surface of the vessel for 1 minute. After removing the paper, the vessel was covered with saline. Thrombus formation was observed in real time using intravital fluorescence microscopy equipped with video recording. Time to cessation of blood flow through clot formation for all studies was determined by visual inspection by two independent investigators.
Dynamic Mass Redistribution (DMR) Studies on MEG01 and HEL Cells
MEG01 and HEL92.1.7 cells were grown in RPMI 1640 media supplemented with fetal bovine serum (FBS; 10%), penicillin (100 U/mL) and streptomycin (100 μg/mL) in a humidified atmosphere at 37 °C in 5% CO2. Prior to a DMR experiment, cells were incubated in a reduced serum media (Opti-MEM) overnight. The following morning, Opti-MEM was removed and cells were washed with 1X HBSS buffer with HEPES (20 mM; pH 7.4), and seeded into a 96-well fibronectin coated epic corning DMR plate (Corning) at a density of 80,000–100,000 cells per well suspended in the same buffer (100 μL). The DMR plate was briefly centrifuged (100 x g for 10–15 s at r.t.) to allow the cells to settle at the bottom of the plate and then kept at room temperature for 1 h at room temperature prior to the DMR measurements. In a typical DMR experiment, basal DMR responses were first collected for 15 min to confirm flat baseline DMR responses and this was defined as the zero point. For the DMR dose response experiments, increasing concentrations, as indicated of the compound of interest (25 μL; 5X concentration) (PAGln, Norepi or Phe) or vehicle (25 μL) were added and the DMR signal was read for 60–90 minutes in a Corning Epic BT system (Corning Epic). DMR studies using G-protein modulators were performed by preincubation the cells with pertussis toxin (PTX; 100 ng/mL) for 30 min, cholera toxin (CTX; 1 μg/mL) for 45 min, YM-254890 (0.5 μM) for 30 min or SCH-202676 (1 μM) for 30 min, as indicated before the addition of the compound of interest (PAGln (100 μM), Norepi (10 μM) or collagen (10 μg/mL)). Loss of function DMR studies with siRNAs on MEG01 cells were carried out by transfecting the cells with the indicated ADRA2A, ADRA2B, ADRB2 and negative control scrambled Silencer Select siRNAs (combination of 3 siRNAs for each gene; Silencer select human GPCR siRNA (Thermo Fisher, Ambion)) at a concentration of 1 pmol of each of the three siRNAs per well in 96-well DMR plates using the RNAi transfection protocol suggested by the manufacturer (Silencer Select human GPCR siRNA library V4 protocol 2013 –Ambion- Lipofactamine RNAiMAX-Invitrogen). The siRNA transfected cells were analyzed by DMR 40 h post transfection in the presence of the compound of interest (e.g. PAGln (100 μM), epinephrine (10 μM) or ATP (50 μM)). Pharmacological loss of function studies: DMR studies with adrenergic receptor (ADR) inhibitors on MEG01 cells were performed by treating the cells with either vehicle, ICI118,551 (10 μM), propranolol (10 μM) or RX821002 (10 μM) for 30 min as indicated before addition of the compound of interest (e.g. PAGln (100 μM), ISO (10 μM), B-HT933 (50 μM) or ATP (50 μM)). In all cases, DMR response signals were recorded for 60–90 minutes post compound of interest addition. The maximum DMR response of a test compound alone (eg. PAGln, Norepi, Epi, ISO, Collagen or ATP) was normalized to 100 % in all the DMR experiments performed on suspension cells.
Cell Plasma Membrane Preparations for Binding Experiments
Membranes were prepared as previously described (Naga Prasad et al., 2001). Cell monolayers of CHO-K1 and HEK293 cells were scraped in osmotic buffer (0.6 mL; 25 mM Tris-HCl; pH 7.5; 5 mM EDTA, 2 μg/mL leupeptin and 2 μg/mL aprotinin) and disrupted further by using a Dounce homogenizer. Intact cells and nuclei were removed by centrifugation at 1,000 × g for 5 min at 4 °C. The collected supernatant was further subject to a centrifugation at 38,000 × g for 25 min at 4 °C. The pellet was re-suspended in binding buffer (75 mM Tris-HCl (pH 7.5), 10 mM MgCl2, 5 mM EDTA) and used as the plasma membrane fraction. Isolated washed platelets also underwent similar procedures to obtain plasma membrane fraction.
Determination of β2-ADR Density by [125Iodo]-(−)-Cyanopindolol ([125I]-CYP) Binding
β2-ADR density was determined using membrane fractions of the cells/platelets by radioligand binding as previously described (Naga Prasad et al., 2001). Total binding was determined in the presence of 42.75 fmol of [125I]-CYP alone, and nonspecific binding was determined using 42.75 fmol [125I]-CYP plus 10 μM propranolol. The assay was performed in binding buffer at 37 °C for 1 h. The membranes were harvested on glass fiber (Brandel, Inc, Gaithersburg MD) using a membrane harvester (Brandel, Inc, Gaithersburg, MD). The unbound radioisotopes were removed by washing the filter with wash buffer (10 mM Tris-HCl (pH 7.5), 5 mM EDTA) under vacuum. The glass fiber discs were then dried and the radioactivity was measured using a gamma counter (ICN Biomedicals, Inc, Costa Mesa, CA). Receptor density was calculated by subtracting the nonspecific binding of [125I]-CYP in the presence of propranolol from specific receptor binding of [125I]-CYP in the absence of propranolol, taking specific activity of the radioisotope into consideration. The receptor numbers were expressed as fmol of receptor per mg of membrane protein.
Dynamic Mass Redistribution (DMR) Studies on Adherent Cells
DMR experiments in the adherent HEK293 cells were carried out on parental HEK293, α2B-HEK293 (stably transfected) and β2-HEK293 (stably transfected) cells by seeding them into EPIC-Corning fibronectin coated 96-well DMR microplates (Corning) at a density of 50,000 cells per well. Cells were grown in DMEM (100 μL) media supplemented with FBS (10%), penicillin (100 U/mL) and streptomycin (100 μg/mL) in a humidified atmosphere at 37 °C in 5% CO2 for 1 day before proceeding with the DMR experiments. For gain of function studies with the α2A ADR, parental HEK293 cells were transfected with either pcDNA3.1(+)-N-DYK empty vector or with pcDNA3.1(+)-ADRA2A-N-DYK clone using Lipofactamine 3000 Transfection kit (Invitrogen). Equivalent transfection efficiency for each well was monitored using a GFP reporter (pmaxGFP, Lonza, CH) and was ~80%. DMR studies were performed on transiently transfected cells 2 days post transfection. Prior to performing the DMR measurements, cells were washed with 1X HBSS buffer with HEPES (20 mM, pH 7.4) and allowed to temperature equilibrate for 1 h at room temperature in the same buffer (100 μL). Basal DMR responses were captured for 15 min to obtain a baseline reading that was defined as zero level, and also ensured signal stability. The DMR signal was monitored after adding the compound of interest (final concentrations, e.g. PAGln (100 μM), ISO (10 μM), B-HT933 (50 μM) or ATP (50 μM) as indicated) for 60–90 min. For inhibitor studies, either ICI118,551 (10 μM), propranolol (10 μM) or RX821002 (10 μM) as indicated, were incubated with cells for 30 min before addition of the compound(s) of interest. In all DMR experiments performed on adherent cells, the DMR response (pm shift) to a test compound alone (eg. PAGln, ISO and BHT933) or in combination with inhibitor/modulator was normalized to the ATP DMR response (a non-ADR GPCR (i.e. P2Y) agonist that is expressed on nearly all cells).
Real-time (RT) PCR of ADR Gene Expression in MEG01 Cells
Total RNA was isolated from MEG01 cells using a TRIZOL RNA isolation protocol 40 h post siRNA transfection. Reverse Transcription was performed using a High-Capacity RNA to cDNA kit (Applied Biosystem) per the manufacturer’s recommended protocol. Real time (RT) PCR was carried out following the TaqMan Gene Expression Assays protocol using RT primers and probes of ADRA2A (Hs01099503_s1), ADRA2B (Hs00265081_s1) and ADRB2 (Id Hs00240532_s1) from ThermoFisher Scientific.
cAMP Assay in MEG01, Platelets and HEK293 Cells
Intracellular cAMP levels were measured using CatchPoint Cyclic-AMP Fluorescent Assay Kit (Molecular Devices). Briefly, MEG01 cells were washed with 1X HBSS buffer with HEPES (20 mM; pH 7.4) and re-suspended in stimulation buffer (1X HBSS, HEPES (20 mM); pH 7.4, IBMX (0.5 mM), Rolipram (0.1 mM) and BSA (0.1%)). The cells were further seeded into 96 well cell culture plates at a density of 100,000 cells per well (100 μL). Similarly, washed human platelets were re-suspended gently in stimulation buffer and seeded into a 96-well cell culture plates at 4–6 million platelets per well (100 μL). Both the MEG01 cells and platelets were kept thereafter in a 37 °C incubator for 10 min before addition of the inhibitors or test compounds as indicated. Where indicated 10 μL (10X concentration) of modulators/inhibitors (when necessary) were added and kept for 15 min at 37 °C. After that, 10 μL (10X concentration) of the test compounds (PAGln (100 μM) or ISO (10 μM)) were added and incubated for different time periods at 37 °C. The test compounds and the inhibitors/modulators were made in buffer T (1X HBSS, HEPES (20 mM); pH 7.4, IBMX (0.5 mM) and Rolipram (0.1 mM)). The reaction was stopped by adding 50 μL of lysis buffer (provided in the kit, CatchPoint Cyclic-AMP Fluorescent Assay Kit (Molecular Devices)), supplemented with IBMX (0.5 mM) and Rolipram (0.1 mM)) and agitated for 10 min in a plate shaker to facilitate cell lysis. Lysed cells were immediately assayed for cAMP. For the quantification of cAMP, the lysed sample (40 μL), buffer control and cAMP calibrators were added to the appropriate wells of the provided 96-well clear bottom, black walled cAMP assay plates. Next, reconstituted rabbit anti-cAMP antibody (40 μL) was added to all the wells and mixed for 5 min on a plate shaker to ensure mixing. In the next step, reconstituted HRP-cAMP conjugate (40 μL) was added to every well, mixed properly and kept at room temperature for 2 h. The plate contents were aspirated thereafter and washed with wash buffer (300 μL (provided in the kit)) 4 times. After removal of the 4th wash buffer, spotlight red substrate (provided in the kit) was added to each well. The plate was covered with aluminum foil and left at room temperature for at least 10 min before reading fluorescence intensity in a FlexStation 3 Multi-Mode Microplate Reader (Molecular Devices). For cAMP assay with G-protein modulator, pertussis toxin (PTX; 100 ng/mL) was incubated for 45 min, cholera toxin (CTX; 1 μg/mL) was incubated for 60 min, YM-254890 (0.5 μM) was incubated for 45 min or SCH-202676 (1 μM) was incubated for 45 min by adding 10 μL (10X concentration) of each modulators per well prior to addition of the test compound. Notably, in contrast to the action of PTX, CTX lead to permanent activation of adenylyl cyclase resulting in constitutive cAMP production. Since Gαs protein has no selective inhibitor known to date, CTX was used for investigating signaling through Gαs pathway. In the context of our current experimental design and analysis, CTX addition results in stimulation of adenylyl cyclase and a sustained increase in cAMP, which was considered as the normalized baseline. Addition of any agonist over this baseline value now does not lead to detectable increase in the Gαs subunit driven cAMP production, thereby resulting in masking of the signaling process. Moreover, CTX incubation was performed for at least 60 minutes before treating with PAGln. A primary reason for longer CTX exposure is to saturate the response through Gαs.
The cAMP assay with ADR inhibitors in MEG01 cells was performed by treating the cells with ICI118,551 (10 μM), propranolol (10 μM) and RX821002 (10 μM) by adding 10 μL (10X concentration) of the respective inhibitors per well for 15 min before addition of the compound of interest. For cAMP assay in adherent cells, parental HEK293, and β2-HEK293 (stable) cells were seeded into 96-well cell culture microplates with approximately 50,000 cells per well in DMEM (100 μL) media supplemented with FBS (10%), penicillin (100 U/mL) and streptomycin (100 μg/mL) in a humidified atmosphere at 37 °C in 5% CO2. Cells were grown for 24 h before proceeding with cAMP quantification following the same methodology as described for MEG01 cells. For cAMP assays in CHO-K1 cells, parental, empty vector and ADRB2 transfected cells were prepared as described above for HEK293 cells. Transfected cells were cultured 48 h post transfection before proceeding with quantification of cAMP for cells treated with the indicated compounds using the same procedure to measure cAMP in CHO-K1 cells as described for MEG01 cells. Equivalent transfection efficiency for each well was monitored using a GFP reporter (pmaxGFP, Lonza, CH) and was ~80%.
Intracellular Ca2+ Measurement
Intracellular Ca2+ in MEG01, HEL92.1.7, parental HEK293, ADRB2 stably transfected HEK293 (β2-HEK293) cells, empty vector (EV) transfected HEK293 cells, ADRA2A (α2A-HEK293) and in ADRA2B stably transfected HEK293 (α2B-HEK293) cells was measured using the FLIPR Calcium 5 Assay Kit- Molecular devices (Cat. R8186). Briefly, 100,000 cells per well for suspension cells or 50,000 cells per well for adherent cells were seeded into 96 well clear bottom, black walled cell culture plates (Falcon) in assay buffer (100 μL; 1X HBSS, 20 mM HEPES, pH 7.4). Adherent cells were grown for 1 day prior to the experiment. Calcium assay reagent component A (provided in the kit) was re-suspended in Component B (10 mL; provided in the kit) and mixed by vortexing for 1 to 2 min to prepare the loading buffer. Probenecid (100 μL of a 250 mM stock) was added in the loading buffer before proceeding with the assay. Loading buffer (100 μL) was added to each well of the 96 well plate. The plates were incubated for 1 h at 37 °C and thereafter kept at room temperature until used for the assay. A test compound 96-well microplate was prepared adding 5X concentration of the compound of interest (final concentrations: PAGln (100 μM), ADP (10 μM) or TFLLR-NH2 (10 μM) in appropriate wells. To start the assay, 50 μL of the 5X test compounds were added to the assay plates in the respective wells in a FlexStation 3 Multi-Mode Microplate Reader (Molecular Devices). The [Ca2+] level was monitored in real time post compound addition as relative fluorescent unit (RFU). The maximum RFU peak minus minimum base line RFU was used as the net measurement of [Ca2+] level.
QUANTIFICATION AND STATISTICAL ANALYSIS
To examine the differences between groups, we used Student’s t test (2 tailed) or Wilcoxon’s rank-sum test for continuous variables, and χ2 test for categorical variables. Rank-based nonparametric Kruskal-Wallis test was used for non-normally distributed data. In the box-whisker plot, the upper and lower boundaries of the box represent the 25th and 75th%iles, the median is marked by a horizontal line inside the box, and whiskers represent 10%ile and 90%ile of measured values. Categorical data are presented as n (%). Hazard ratio (HR) for MACE at 3-year follow-up and corresponding 95% confidence intervals (CI) were estimated using both univariable (unadjusted) and multivariable (adjusted) Cox models. Kaplan–Meier analysis with Cox proportional hazards regression was used for time-to-event analysis to determine HR and 95% CI for MACE. Adjustments were made for individual traditional cardiac risk factors including age, sex, HDL, LDL, triglycerides, smoking, diabetes mellitus, systolic blood pressure, and high-sensitivity C-reactive protein level. All data are presented as mean ± SD or SEM, as indicated. Statistical tests used to compare conditions are indicated in figure legends. GraphPad PRISM version 8.0 and R 3.4.2 (Vienna, Austria, 2017) were used for generation of graphs and statistics.
DATA AND CODE AVAILABILITY
There are restrictions to the availability of clinical data generated in this study as we do not have permission in our informed consent from research subjects to share data outside of our institution without their authorizations.
ADDITIONAL RESOURCES
Patient samples and clinical data used for the Discovery Cohort, and the independent Validation Cohort, were obtained from the study entitled GeneBank at the Cleveland Clinic: Molecular Determinants of Coronary Artery Disease (GATC), which was performed under an approved protocol registered under ClinicalTrials.gov Identifier: NCT00590200. Antibiotic suppression of gut microbial metabolite levels in humans were performed under an approved protocol registered under ClinicalTrials.gov Identifier: NCT01564797.
Supplementary Material
(A) Demonstration of co-chromatography of analyte m/z 265.1188 within a plasma sample, and from synthetic PAGln and D5-PAGln run on UHPLC in tandem with a high resolution mass spectrometer on two different columns (reverse phase (C18) column (left panel) and normal phase (HILIC) column (right panel)).
(B) Demonstration of co-chromatography following derivatization of candidate plasma analyte m/z 265.1188, which shifted to m/z 307.1652, similar to behavior of authentic synthetic PAGln and the isotopologue D5-PAGln. The purified analyte in plasma with m/z 265.1188 (right panel) and synthetic PAGln and D5-PAGln were esterified with propyl chloroformate in propanol.
(C) Comparison of the high resolution CID mass spectra in positive ion mode of the propyl chloroformate/propanol derivative of the metabolite in plasma (m/z 265.1188), which now demonstrates MH+= m/z 307.1652 (red) and synthetic phenylacetylglutamine propyl ester (PAGln propyl ester; blue).
(D) Chromatograms generated by multiple reaction monitoring transitions (MRM) for the plasma analyte (m/z 265.2) and synthetic isotopically labeled phenylacetylglutamine internal standard (D5-PAGln; m/z 270.1). Both compounds were monitored at 3 different characteristic parent/daughter transitions.
(A) P-Selectin positive, human platelet (stained with PE-conjugated anti-P-selectin antibody) adhesion in whole blood to a microfluidic chip surface coated with collagen under physiological shear conditions ± the indicated concentrations of added PAGln (n=5 replicates per donor). Results from (n=4) donors are shown.
(B) ADP (2 μM) induced changes in aggregation in platelet rich plasma (PRP) pre-incubated with either PAGln 0 μM or PAGln 10 μM at 20 °C for 30 min (n=5 donors).
(C) The impact of PAGln (100 μM) on stimuli dependent platelet aggregation responses (TRAP6 (n=10), or collagen (n=5) at the indicated concentrations).
(D) The impact of increasing concentrations of PAGln on platelet responsiveness (monitored by platelet aggregometry) to submaximal stimulation by TRAP6 (n=5) or collagen (n=6) are shown.
(E) PRPs, isolated from healthy volunteers (n=9), were preincubated with PAGly (100 μM final, red) vs. normal saline (vehicle, blue) at 20 °C for 30 min, and then platelet aggregometry was used to assess platelet responsiveness to varying dose of ADP for each subject.
(F) At a fixed submaximal level of ADP, the effect of varied levels of PAGly on platelet responsiveness was monitored (n=6).
(G) Thrombin induced changes in intracellular calcium concentration [Ca2+] in Fura 2 filled washed human platelets (n=6) incubated with vehicle or PAGly (100 μM).
Significance was measured with non-parametric one- (Kruskal-Walis (K.W.)) or two-way ANOVA and Wilcoxon paired test. Data points represent the mean ± SEM (n=biological replicates).
(A) Levels of phenylalcetylglycine (PAGly; n=5; left panel) and phenylacetylglutamine (PAGln; n=5; right panel) in mouse plasma after i.p. injection (50 mg/kg) over time.
(B) Proposed metaorganismal pathway for production of phenylacetylglycine and phenylacetylglutamine.
(A) In MEG01 cells, a representative DMR response graph over time with the addition of collagen (10 μg/mL), Norepi (10 μM), PAGln (100 μM) or Phe (100 μM) is shown. The maximum response (in Δpm) to a given treatment is used to quantify the DMR response.
(B) DMR dose response of PAGln (n=6), Norepi (n=4) and Phe (n=4) in HEL 92.1.7 cells. Curves were generated quantifying the maximum DMR response after the indicated ligand addition.
(C) DMR response to 100 μM PAGln in MEG01 cells before and after the treatment with G-protein modulators, pertussis toxin (PTX; 100 ng/ml), cholera toxin (CTX; 1 μg/ml), YM-254890 (0.5 μM) or SCH-202676 (1 μM) (n=5-10 as indicated), which masks signaling through Gαi-subunit, Gαs-subunit, Gαq-subunit, or almost all G-protein coupled receptors, respectively. Values are normalized to maximum DMR response of PAGln, alone.
(D) Schematic describing the timeline of addition of different compounds and incubation periods in DMR experiments with inhibitors, modulators and siRNAs (left panel) and schematic describing the timeline of addition of different compounds and incubation period in cAMP measurement experiments with modulators and antagonists (right panel). Since different biological samples display variable DMR signal magnitude, the maximum DMR response of a test compound was normalized to 100% in all the subjects. cAMP levels were normalized to 100% in all the inhibitor treated or untreated samples before addition of PAGln or ISO.
(E) DMR response of PAGln (100 μM; left), Norepi (10 μM; middle) and collagen (10 μg/mL; right) in HEL92.1.7 cells after treatment with G-protein modulators, PTX (100 ng/mL), CTX (1 μg/mL), YM-254890 (1 μM) or SCH-202676 (1 μM) (n=4-9 as indicated). The maximum DMR response of a test compound (PAGln, Norepi or collagen) normalized to 100 % for each experimental group. Significance was determined by nonparametric-Mann Whitney (M.W.) test for pairwise comparison and Kruskal-Wallis (K.W.) test for multiple comparison. Data points represent the mean ± SEM (n=biological replicates).
(A-B) Intra cellular Ca2+ levels were measured after treating MEG01 cells (n=4) (A) and HEL92.1.7 cells (n=5-6 as indicated) (B) with the indicated concentrations of PAGln. ADP (10 μM) and TFLLR-NH2 (10 μM) were used as positive controls. ISO (10 μM) was used as negative control. Relative fluorescence unit (RFU) was quantified using the maximum peak fluorescence after ligand addition.
(C-D) cAMP levels in MEG01 cells (n=5-12 as indicated) (C) and in washed human platelets (n=3-8 as indicated) (D) were determined at indicated times after treatment with PAGln (100 μM) or with ISO (10 μM) as a positive control. Significance was determined by nonparametric-Mann Whitney (M.W.) test for pairwise comparison and Kruskal-Wallis (K.W.) test for multiple comparisons.
(E-F) cAMP levels in MEG01 cells (n=4-10 as indicated) (E) and in washed human platelets (n=5-10 as indicated) (F) after PAGln (100 μM) treatment for 5 min, in the presence of PTX (100 ng/mL), CTX (1 μg/mL), YM-254890 (1 μM) or SCH-202676 (1 μM) as indicated.
(G-H) cAMP levels in MEG01 cells (n=5-9 as indicated) washed human platelets (n=4-8 as indicated) after ISO (10 μM for 5 min) treatment in presence of either PTX (100 ng/mL), CTX (1 μg/mL), YM-254890 (1 μM) or SCH-202676 (1 μM) as indicated. Significance was determined by nonparametric-Mann Whitney (M.W.) test for pairwise comparison and Kruskal-Wallis (K.W.) test for multiple comparison. Data points represent the mean ± SEM.
(A) Levels of ADR2A, ADR2B and ADRB2 mRNAs were determined in MEG01 cell lines by quantitative real-time PCR after transfecting the cells with either control scrambled siRNAs or siRNAs against α2A, α2B and β2 adrenergic receptors as indicated (n=4).
(B-C) DMR response to epinephrine (Epi; 10 μM; n=6-11 as indicated) (B) and ATP (50 μM; n=5-9 as indicated) (C) was measured after transfecting the MEG01 cells with control scrambled siRNAs or siRNAs against α2A, α2B or β2 adrenergic receptors. Maximum response to Epi and ATP were normalized to 100%.
(D) DMR response to ISO (10 μM) (in the presence of selective β2 antagonist ICI118,551 (10 μM) and nonselective beta-blocker propranolol (10 μM)) and B-HT933 (50 μM) (with nonselective α2 antagonist RX821002 (10 μM)) was quantified after treating MEG01 cells with the indicated respective inhibitors for 30 min prior to ISO addition (n=4-6 as indicated). Maximum response of ISO and B-HT933 were normalized to 100%.
(E) DMR response to ATP (50 μM) in MEG01 cells after 30 min treatment with selective β2 antagonist ICI118,551 (10 μM), nonselective β-blocker propranolol (10 μM) or nonselective α2 antagonist RX821002 (10 μM) (n=4-9 as indicated).
(F) cAMP levels were measured in washed human platelets (n=5-7 as indicated) after treating the cells with PAGln (100 μM) for 5 min, in the presence of ICI118,551 (10 μM), propranolol (10 μM) or RX821002 (10 μM). cAMP levels were normalized to 100% in all the inhibitor treated or untreated subjects before addition of PAGln (n=number of biological replicates).
(G) Measurement of cAMP levels in MEG01 (left; n=6-10 as indicated) and in washed human platelets isolated from healthy volunteer donors (right; n=6-7 as indicated) after treating them with ISO (10 μM) for 5 min, in the presence of ICI118,551 (10 μM), propranolol (10 μM) or RX821002 (10 μM) as indicated. cAMP levels were normalized to 100% in all the inhibitor treated or untreated subjects before addition of ISO (n=number of biological replicates). Significance was determined by nonparametric-Mann Whitney (M.W.) test for pairwise comparison and Kruskal-Wallis (K.W.) test for multiple comparison. Data points represent the mean ± SEM.
(A) B-HT933 (50 μM; left and middle panel; n=5-12 as indicated) and ISO (10 μM; right panel; n=6-11 as indicated) DMR response was analyzed in parental HEK293, empty vector (EV) transfected HEK293, ADRA2A transfected HEK293 (left panel), α2B-HEK293 stably expressing cells (middle panel) and in β2-HEK293 stably expressing cells (right panel) after pretreating the cells with selective β2 antagonist ICI118,551 (10 μM), nonselective beta-blocker propranolol (10 μM), or nonselective α2 antagonist RX821002 (10 μM) for 30 min. (B-HT933 and ISO response was calculated with respect to relative ATP response in all the samples).
(B) ATP (50 μM) DMR response was analyzed as a negative control in ADRA2A transfected HEK293 (left panel), α2B-HEK293 stably expressing cells (middle panel) and in β2-HEK293 stable cells (right panel) after treating the cells with selective β2 antagonist ICI118,551 (10 μM), nonselective β-blocker propranolol (10 μM) or nonselective α2 antagonist RX821002 (10 μM) for 30 min as indicated (n=5-14 as indicated). (Maximum response to ATP was normalized to 100%).
(C) cAMP level was analyzed in parental CHO-K1 cells (black line), empty vector (EV) transfected CHO-K1 cells (blue line), ADRB2 transfected CHO-K1 cells (green line) and ADRB2 transfected CHO-K1 cells along with β2-antagonist ICI118,551 (10 μM; red line), after treating the cells with increasing concentration of either PAGln (left panel) or ISO (right panel) for 10 min (n=6).
(A-E) Intracellular Ca2+ levels were measured in parental HEK293 cells (A; n=5), β2-HEK293 stably expressing cells (B; n=5), EV transfected HEK293 cells (C; n=5), ADRA2A transfected HEK293 cells (D; n=4) and α2B-HEK293 stably expressing cells (E; n=4) treated with the indicated concentrations of PAGln. ADP (10 μM) and TFLLR-NH2 (10 μM) were used as positive controls for all cells. ISO (10 μM) was used as a negative control. Relative fluorescence units (RFU) were quantified using the maximum fluorescence peak after ligand addition.
(F) Platelet aggregation was measured in human platelet rich plasma (PRP; n=6) preincubated with selective β2-blocker ICI118,551 (10 μM) for 15 min followed by PAGln (100 μM) for 30 min before stimulation with a submaximal concentration of ADP (2μM). Data points represent aggregation as the percentage of maximum amplitude in PRP recovered from each human subjects. Significance was determined by nonparametric-Mann Whitney (M.W.) test for pairwise comparison and Kruskal-Wallis (K.W.) test for multiple comparisons. Data points represent the mean ± SEM; (n=number of biological replicates).
Highlights.
Gut microbe formed phenylacetyl glutamine (PAGln) contributes to cardiac disease.
Microbial porA and fldH impact host PAGln levels, platelet function, and thrombosis.
PAGln transmits cellular responses via the α2A, α2B and β2 adrenergic receptors.
β blocker therapy attenuates PAGln induced heightened thrombosis risk
A microbially-generated metabolite, PAGIn, is associated with cardiovascular disease and death in humans. Studies in animal models provide insights into PAGIn metabolism as well as its effects in driving platelet invasiveness and thrombosis through adrenergic receptors.
ACKNOWLEDGMENTS
This work is supported by grants from the NIH and Office of Dietary Supplements (P01HL147823, R01HL103866, R01HL126827) and the Foundation Leducq. K.A.R. was supported in part by NIH/NHLBI training grant HL134622. Mass spectrometry studies were performed on instrumentation housed in a facility supported in part through a Shimadzu Center of Excellence award and NIH shared instrumentation grant 1S10OD016346. Microfluidic shear flow experiments were done with the help from the Lerner Research Institute Imaging Core.
Footnotes
DECLARATION OF INTERESTS
S.L.H. reports being named as co-inventor on pending and issued patents held by the Cleveland Clinic relating to cardiovascular diagnostics and therapeutics, being a paid consultant for P&G, having received research funds from P&G, and Roche Diagnostics, and being eligible to receive royalty payments for inventions or discoveries related to cardiovascular diagnostics or therapeutics from Cleveland HeartLab, Quest Diagnostics and P&G. The other authors have reported that they have no relationships relevant to the contents of this paper to disclose.
References
- Action to Control Cardiovascular Risk in Diabetes Study, G., Gerstein HC, Miller ME, Byington RP, Goff DC Jr., Bigger JT, Buse JB, Cushman WC, Genuth S, Ismail-Beigi F, et al. (2008). Effects of intensive glucose lowering in type 2 diabetes. N Engl J Med 358, 2545–2559. [DOI] [PMC free article] [PubMed] [Google Scholar]
- Amrani Y, and Bradding P (2017). beta2-Adrenoceptor Function in Asthma. Adv Immunol 136, 1–28. [DOI] [PubMed] [Google Scholar]
- Anfossi G, and Trovati M (1996). Role of catecholamines in platelet function: pathophysiological and clinical significance. Eur J Clin Invest 26, 353–370. [DOI] [PubMed] [Google Scholar]
- Aron-Wisnewsky J, and Clement K (2016). The gut microbiome, diet, and links to cardiometabolic and chronic disorders. Nat Rev Nephrol 12, 169–181. [DOI] [PubMed] [Google Scholar]
- Atwood BK, Lopez J, Wager-Miller J, Mackie K, and Straiker A (2011). Expression of G protein-coupled receptors and related proteins in HEK293, AtT20, BV2, and N18 cell lines as revealed by microarray analysis. BMC Genomics 12, 14. [DOI] [PMC free article] [PubMed] [Google Scholar]
- Barnett DB, Swart SS, Nahorski SR, and Cook N (1985). Characterisation of human platelet adrenoceptors. Adv Exp Med Biol 192, 97–108. [DOI] [PubMed] [Google Scholar]
- Barrios C, Beaumont M, Pallister T, Villar J, Goodrich JK, Clark A, Pascual J, Ley RE, Spector TD, Bell JT, et al. (2015). Gut-Microbiota-Metabolite Axis in Early Renal Function Decline. PLoS One 10, e0134311. [DOI] [PMC free article] [PubMed] [Google Scholar]
- Bilski AJ, Halliday SE, Fitzgerald JD, and Wale JL (1983). The pharmacology of a beta 2-selective adrenoceptor antagonist (ICI 118,551). J Cardiovasc Pharmacol 5, 430–437. [DOI] [PubMed] [Google Scholar]
- Black HR, Greenberg BH, and Weber MA (2010). The foundation role of beta blockers across the cardiovascular disease spectrum: a year 2009 update. Am J Med 123, S2. [DOI] [PubMed] [Google Scholar]
- Blazenovic I, Kind T, Ji J, and Fiehn O (2018). Software Tools and Approaches for Compound Identification of LC-MS/MS Data in Metabolomics. Metabolites 8. [DOI] [PMC free article] [PubMed] [Google Scholar]
- Brown JM, and Hazen SL (2018). Microbial modulation of cardiovascular disease. Nat Rev Microbiol 16, 171–181. [DOI] [PMC free article] [PubMed] [Google Scholar]
- Brusilow S, Tinker J, and Batshaw ML (1980). Amino acid acylation: a mechanism of nitrogen excretion in inborn errors of urea synthesis. Science 207, 659–661. [DOI] [PubMed] [Google Scholar]
- Burnett H, Earley A, Voors AA, Senni M, McMurray JJ, Deschaseaux C, and Cope S (2017). Thirty Years of Evidence on the Efficacy of Drug Treatments for Chronic Heart Failure With Reduced Ejection Fraction: A Network Meta-Analysis. Circ Heart Fail 10. [DOI] [PMC free article] [PubMed] [Google Scholar]
- Cameron SJ, Mix DS, Ture SK, Schmidt RA, Mohan A, Pariser D, Stoner MC, Shah P, Chen L, Zhang H, et al. (2018). Hypoxia and Ischemia Promote a Maladaptive Platelet Phenotype. Arterioscler Thromb Vasc Biol 38, 1594–1606. [DOI] [PMC free article] [PubMed] [Google Scholar]
- Campbell AP, and Smrcka AV (2018). Targeting G protein-coupled receptor signalling by blocking G proteins. Nat Rev Drug Discov 17, 789–803. [DOI] [PMC free article] [PubMed] [Google Scholar]
- Ciccarelli M, Santulli G, Pascale V, Trimarco B, and Iaccarino G (2013). Adrenergic receptors and metabolism: role in development of cardiovascular disease. Front Physiol 4, 265. [DOI] [PMC free article] [PubMed] [Google Scholar]
- Colman RW (1990). Platelet receptors. Hematol Oncol Clin North Am 4, 27–42. [PubMed] [Google Scholar]
- da Silva RR, Dorrestein PC, and Quinn RA (2015). Illuminating the dark matter in metabolomics. Proc Natl Acad Sci U S A 112, 12549–12550. [DOI] [PMC free article] [PubMed] [Google Scholar]
- Devlin AS, Marcobal A, Dodd D, Nayfach S, Plummer N, Meyer T, Pollard KS, Sonnenburg JL, and Fischbach MA (2016). Modulation of a Circulating Uremic Solute via Rational Genetic Manipulation of the Gut Microbiota. Cell Host Microbe 20, 709–715. [DOI] [PMC free article] [PubMed] [Google Scholar]
- Dickert S, Pierik AJ, and Buckel W (2002). Molecular characterization of phenyllactate dehydratase and its initiator from Clostridium sporogenes. Mol Microbiol 44, 49–60. [DOI] [PubMed] [Google Scholar]
- Dodd D, Spitzer MH, Van Treuren W, Merrill BD, Hryckowian AJ, Higginbottom SK, Le A, Cowan TM, Nolan GP, Fischbach MA, et al. (2017). A gut bacterial pathway metabolizes aromatic amino acids into nine circulating metabolites. Nature 551, 648–652. [DOI] [PMC free article] [PubMed] [Google Scholar]
- Duckworth W, Abraira C, Moritz T, Reda D, Emanuele N, Reaven PD, Zieve FJ, Marks J, Davis SN, Hayward R, et al. (2009). Glucose control and vascular complications in veterans with type 2 diabetes. N Engl J Med 360, 129–139. [DOI] [PubMed] [Google Scholar]
- Elliott P, Posma JM, Chan Q, Garcia-Perez I, Wijeyesekera A, Bictash M, Ebbels TM, Ueshima H, Zhao L, van Horn L, et al. (2015). Urinary metabolic signatures of human adiposity. Sci Transl Med 7, 285ra262. [DOI] [PMC free article] [PubMed] [Google Scholar]
- Elsden SR, Hilton MG, and Waller JM (1976). The end products of the metabolism of aromatic amino acids by Clostridia. Arch Microbiol 107, 283–288. [DOI] [PubMed] [Google Scholar]
- Fawzi AB, Macdonald D, Benbow LL, Smith-Torhan A, Zhang H, Weig BC, Ho G, Tulshian D, Linder ME, and Graziano MP (2001). SCH-202676: An allosteric modulator of both agonist and antagonist binding to G protein-coupled receptors. Mol Pharmacol 59, 30–37. [DOI] [PubMed] [Google Scholar]
- Fu Q, Wang Q, and Xiang YK (2017). Insulin and beta Adrenergic Receptor Signaling: Crosstalk in Heart. Trends Endocrinol Metab 28, 416–427. [DOI] [PMC free article] [PubMed] [Google Scholar]
- Gerstein HC, Mann JF, Yi Q, Zinman B, Dinneen SF, Hoogwerf B, Halle JP, Young J, Rashkow A, Joyce C, et al. (2001). Albuminuria and risk of cardiovascular events, death, and heart failure in diabetic and nondiabetic individuals. JAMA 286, 421–426. [DOI] [PubMed] [Google Scholar]
- Gonzalez-Guardia L, Yubero-Serrano EM, Delgado-Lista J, Perez-Martinez P, Garcia-Rios A, Marin C, Camargo A, Delgado-Casado N, Roche HM, Perez-Jimenez F, et al. (2015). Effects of the Mediterranean diet supplemented with coenzyme q10 on metabolomic profiles in elderly men and women. J Gerontol A Biol Sci Med Sci 70, 78–84. [DOI] [PubMed] [Google Scholar]
- Guo CJ, Allen BM, Hiam KJ, Dodd D, Van Treuren W, Higginbottom S, Nagashima K, Fischer CR, Sonnenburg JL, Spitzer MH, et al. (2019). Depletion of microbiome-derived molecules in the host using Clostridium genetics. Science 366. [DOI] [PMC free article] [PubMed] [Google Scholar]
- Gupta N, Li W, and McIntyre TM (2015). Deubiquitinases Modulate Platelet Proteome Ubiquitination, Aggregation, and Thrombosis. Arterioscler Thromb Vasc Biol 35, 2657–2666. [DOI] [PMC free article] [PubMed] [Google Scholar]
- Gupta R, Tang WH, and Young JB (2004). Patterns of beta-blocker utilization in patients with chronic heart failure: experience from a specialized outpatient heart failure clinic. Am Heart J 147, 79–83. [DOI] [PubMed] [Google Scholar]
- Hein L (2006). Adrenoceptors and signal transduction in neurons. Cell Tissue Res 326, 541–551. [DOI] [PubMed] [Google Scholar]
- Hein L, and Kobilka BK (1997). Adrenergic Receptors From Molecular Structure to in vivo function. Trends Cardiovasc Med 7, 137–145. [DOI] [PubMed] [Google Scholar]
- Jonsson AL, and Backhed F (2017). Role of gut microbiota in atherosclerosis. Nat Rev Cardiol 14, 79–87. [DOI] [PubMed] [Google Scholar]
- Koeth RA, Lam-Galvez BR, Kirsop J, Wang Z, Levison BS, Gu X, Copeland MF, Bartlett D, Cody DB, Dai HJ, et al. (2019). l-Carnitine in omnivorous diets induces an atherogenic gut microbial pathway in humans. J Clin Invest 129, 373–387. [DOI] [PMC free article] [PubMed] [Google Scholar]
- Koeth RA, Wang Z, Levison BS, Buffa JA, Org E, Sheehy BT, Britt EB, Fu X, Wu Y, Li L, et al. (2013). Intestinal microbiota metabolism of L-carnitine, a nutrient in red meat, promotes atherosclerosis. Nat Med 19, 576–585. [DOI] [PMC free article] [PubMed] [Google Scholar]
- Koh A, Molinaro A, Stahlman M, Khan MT, Schmidt C, Manneras-Holm L, Wu H, Carreras A, Jeong H, Olofsson LE, et al. (2018). Microbially Produced Imidazole Propionate Impairs Insulin Signaling through mTORC1. Cell 175, 947–961 e917. [DOI] [PubMed] [Google Scholar]
- Koopen AM, Groen AK, and Nieuwdorp M (2016). Human microbiome as therapeutic intervention target to reduce cardiovascular disease risk. Curr Opin Lipidol 27, 615–622. [DOI] [PubMed] [Google Scholar]
- Koryakina Y, Jones SM, Cornett LE, Seely K, Brents L, Prather PL, Kofman A, and Kurten RC (2012). Effects of the beta-agonist, isoprenaline, on the down-regulation, functional responsiveness and trafficking of beta2-adrenergic receptors with N-terminal polymorphisms. Cell Biol Int 36, 1171–1183. [DOI] [PMC free article] [PubMed] [Google Scholar]
- Lefkowitz RJ, Rockman HA, and Koch WJ (2000). Catecholamines, cardiac beta-adrenergic receptors, and heart failure. Circulation 101, 1634–1637. [DOI] [PubMed] [Google Scholar]
- Leitinger B (2011). Transmembrane collagen receptors. Annu Rev Cell Dev Biol 27, 265–290. [DOI] [PubMed] [Google Scholar]
- Lewandowicz AM, Vepsalainen J, and Laitinen JT (2006). The ‘allosteric modulator’ SCH-202676 disrupts G protein-coupled receptor function via sulphydryl-sensitive mechanisms. Br J Pharmacol 147, 422–429. [DOI] [PMC free article] [PubMed] [Google Scholar]
- Li XS, Wang Z, Cajka T, Buffa JA, Nemet I, Hurd AG, Gu X, Skye SM, Roberts AB, Wu Y, et al. (2018). Untargeted metabolomics identifies trimethyllysine, a TMAO-producing nutrient precursor, as a predictor of incident cardiovascular disease risk. JCI Insight 3. [DOI] [PMC free article] [PubMed] [Google Scholar]
- Lloyd-Price J, Arze C, Ananthakrishnan AN, Schirmer M, Avila-Pacheco J, Poon TW, Andrews E, Ajami NJ, Bonham KS, Brislawn CJ, et al. (2019). Multi-omics of the gut microbial ecosystem in inflammatory bowel diseases. Nature 569, 655–662. [DOI] [PMC free article] [PubMed] [Google Scholar]
- Loo RL, Zou X, Appel LJ, Nicholson JK, and Holmes E (2018). Characterization of metabolic responses to healthy diets and association with blood pressure: application to the Optimal Macronutrient Intake Trial for Heart Health (OmniHeart), a randomized controlled study. Am J Clin Nutr 107, 323–334. [DOI] [PubMed] [Google Scholar]
- Masureel M, Zou Y, Picard LP, van der Westhuizen E, Mahoney JP, Rodrigues J, Mildorf TJ, Dror RO, Shaw DE, Bouvier M, et al. (2018). Structural insights into binding specificity, efficacy and bias of a beta2AR partial agonist. Nat Chem Biol 14, 1059–1066. [DOI] [PMC free article] [PubMed] [Google Scholar]
- Meyer TW, Sirich TL, Fong KD, Plummer NS, Shafi T, Hwang S, Banerjee T, Zhu Y, Powe NR, Hai X, et al. (2016). Kt/Vurea and Nonurea Small Solute Levels in the Hemodialysis Study. J Am Soc Nephrol 27, 3469–3478. [DOI] [PMC free article] [PubMed] [Google Scholar]
- Milligan G, and Kostenis E (2006). Heterotrimeric G-proteins: a short history. Br J Pharmacol 147 Suppl 1, S46–55. [DOI] [PMC free article] [PubMed] [Google Scholar]
- Moldave K, and Meister A (1957). Synthesis of phenylacetylglutamine by human tissue. J Biol Chem 229, 463–476. [PubMed] [Google Scholar]
- Naga Prasad SV, Barak LS, Rapacciuolo A, Caron MG, and Rockman HA (2001). Agonist-dependent recruitment of phosphoinositide 3-kinase to the membrane by beta-adrenergic receptor kinase 1. A role in receptor sequestration. J Biol Chem 276, 18953–18959. [DOI] [PubMed] [Google Scholar]
- O’Rourke MF, Blaxall HS, Iversen LJ, and Bylund DB (1994). Characterization of [3H]RX821002 binding to alpha-2 adrenergic receptor subtypes. J Pharmacol Exp Ther 268, 1362–1367. [PubMed] [Google Scholar]
- Piarulli F, Sartore G, Ceriello A, Ragazzi E, Reitano R, Nollino L, Cosma C, Fedele D, and Lapolla A (2009). Relationship between glyco-oxidation, antioxidant status and microalbuminuria in type 2 diabetic patients. Diabetologia 52, 1419–1425. [DOI] [PubMed] [Google Scholar]
- Pluskal T, Castillo S, Villar-Briones A, and Oresic M (2010). MZmine 2: modular framework for processing, visualizing, and analyzing mass spectrometry-based molecular profile data. BMC Bioinformatics 11, 395. [DOI] [PMC free article] [PubMed] [Google Scholar]
- Poesen R, Claes K, Evenepoel P, de Loor H, Augustijns P, Kuypers D, and Meijers B (2016). Microbiota-Derived Phenylacetylglutamine Associates with Overall Mortality and Cardiovascular Disease in Patients with CKD. J Am Soc Nephrol 27, 3479–3487. [DOI] [PMC free article] [PubMed] [Google Scholar]
- Rockman HA, Koch WJ, and Lefkowitz RJ (2002). Seven-transmembrane-spanning receptors and heart function. Nature 415, 206–212. [DOI] [PubMed] [Google Scholar]
- Schmidt RA, Morrell CN, Ling FS, Simlote P, Fernandez G, Rich DQ, Adler D, Gervase J, and Cameron SJ (2018). The platelet phenotype in patients with ST-segment elevation myocardial infarction is different from non-ST-segment elevation myocardial infarction. Transl Res 195, 1–12. [DOI] [PMC free article] [PubMed] [Google Scholar]
- Schroder R, Janssen N, Schmidt J, Kebig A, Merten N, Hennen S, Muller A, Blattermann S, Mohr-Andra M, Zahn S, et al. (2010). Deconvolution of complex G protein-coupled receptor signaling in live cells using dynamic mass redistribution measurements. Nat Biotechnol 28, 943–949. [DOI] [PubMed] [Google Scholar]
- Schroder R, Schmidt J, Blattermann S, Peters L, Janssen N, Grundmann M, Seemann W, Kaufel D, Merten N, Drewke C, et al. (2011). Applying label-free dynamic mass redistribution technology to frame signaling of G protein-coupled receptors noninvasively in living cells. Nat Protoc 6, 1748–1760. [DOI] [PubMed] [Google Scholar]
- Shafi T, Meyer TW, Hostetter TH, Melamed ML, Parekh RS, Hwang S, Banerjee T, Coresh J, and Powe NR (2015). Free Levels of Selected Organic Solutes and Cardiovascular Morbidity and Mortality in Hemodialysis Patients: Results from the Retained Organic Solutes and Clinical Outcomes (ROSCO) Investigators. PLoS One 10, e0126048. [DOI] [PMC free article] [PubMed] [Google Scholar]
- Shafi T, Sirich TL, Meyer TW, Hostetter TH, Plummer NS, Hwang S, Melamed ML, Banerjee T, Coresh J, and Powe NR (2017). Results of the HEMO Study suggest that p-cresol sulfate and indoxyl sulfate are not associated with cardiovascular outcomes. Kidney Int 92, 1484–1492. [DOI] [PMC free article] [PubMed] [Google Scholar]
- Skye SM, Zhu W, Romano KA, Guo CJ, Wang Z, Jia X, Kirsop J, Haag B, Lang JM, DiDonato JA, et al. (2018). Microbial Transplantation With Human Gut Commensals Containing CutC Is Sufficient to Transmit Enhanced Platelet Reactivity and Thrombosis Potential. Circ Res 123, 1164–1176. [DOI] [PMC free article] [PubMed] [Google Scholar]
- Small KM, McGraw DW, and Liggett SB (2003). Pharmacology and physiology of human adrenergic receptor polymorphisms. Annu Rev Pharmacol Toxicol 43, 381–411. [DOI] [PubMed] [Google Scholar]
- Srikanthan S, Li W, Silverstein RL, and McIntyre TM (2014). Exosome poly-ubiquitin inhibits platelet activation, downregulates CD36 and inhibits pro-atherothombotic cellular functions. J Thromb Haemost 12, 1906–1917. [DOI] [PMC free article] [PubMed] [Google Scholar]
- Tang WH, Wang Z, Levison BS, Koeth RA, Britt EB, Fu X, Wu Y, and Hazen SL (2013). Intestinal microbial metabolism of phosphatidylcholine and cardiovascular risk. N Engl J Med 368, 1575–1584. [DOI] [PMC free article] [PubMed] [Google Scholar]
- Tsugawa H, Cajka T, Kind T, Ma Y, Higgins B, Ikeda K, Kanazawa M, VanderGheynst J, Fiehn O, and Arita M (2015). MS-DIAL: data-independent MS/MS deconvolution for comprehensive metabolome analysis. Nat Methods 12, 523–526. [DOI] [PMC free article] [PubMed] [Google Scholar]
- Urpi-Sarda M, Almanza-Aguilera E, Llorach R, Vazquez-Fresno R, Estruch R, Corella D, Sorli JV, Carmona F, Sanchez-Pla A, Salas-Salvado J, et al. (2019). Non-targeted metabolomic biomarkers and metabotypes of type 2 diabetes: A cross-sectional study of PREDIMED trial participants. Diabetes Metab 45, 167–174. [DOI] [PubMed] [Google Scholar]
- Wang L, Tang Y, Liu S, Mao S, Ling Y, Liu D, He X, and Wang X (2013). Metabonomic profiling of serum and urine by (1)H NMR-based spectroscopy discriminates patients with chronic obstructive pulmonary disease and healthy individuals. PLoS One 8, e65675. [DOI] [PMC free article] [PubMed] [Google Scholar]
- Wang Z, Klipfell E, Bennett BJ, Koeth R, Levison BS, Dugar B, Feldstein AE, Britt EB, Fu X, Chung YM, et al. (2011). Gut flora metabolism of phosphatidylcholine promotes cardiovascular disease. Nature 472, 57–63. [DOI] [PMC free article] [PubMed] [Google Scholar]
- Wang Z, Nicholls SJ, Rodriguez ER, Kummu O, Horkko S, Barnard J, Reynolds WF, Topol EJ, DiDonato JA, and Hazen SL (2007). Protein carbamylation links inflammation, smoking, uremia and atherogenesis. Nat Med 13, 1176–1184. [DOI] [PubMed] [Google Scholar]
- Watson LJ, Alexander KM, Mohan ML, Bowman AL, Mangmool S, Xiao K, Naga Prasad SV, and Rockman HA (2016). Phosphorylation of Src by phosphoinositide 3-kinase regulates beta-adrenergic receptor-mediated EGFR transactivation. Cell Signal 28, 1580–1592. [DOI] [PMC free article] [PubMed] [Google Scholar]
- Webster LT, Siddiqui UA, Lucas SV, Strong JM, and Mieyal JJ (1976). Identification of separate acyl- CoA:glycine and acyl-CoA:L-glutamine N-acyltransferase activities in mitochondrial fractions from liver of rhesus monkey and man. J Biol Chem 251, 3352–3358. [PubMed] [Google Scholar]
- Witte KK, Drozd M, Walker AMN, Patel PA, Kearney JC, Chapman S, Sapsford RJ, Gierula J, Paton MF, Lowry J, et al. (2018). Mortality Reduction Associated With beta-Adrenoceptor Inhibition in Chronic Heart Failure Is Greater in Patients With Diabetes. Diabetes Care 41, 136–142. [DOI] [PubMed] [Google Scholar]
- Yang D, Previs SF, Fernandez CA, Dugelay S, Soloviev MV, Hazey JW, Agarwal KC, Levine WC, David F, Rinaldo P, et al. (1996). Noninvasive probing of citric acid cycle intermediates in primate liver with phenylacetylglutamine. Am J Physiol 270, E882–889. [DOI] [PubMed] [Google Scholar]
- Zhang L, Wei TT, Li Y, Li J, Fan Y, Huang FQ, Cai YY, Ma G, Liu JF, Chen QQ, et al. (2018). Functional Metabolomics Characterizes a Key Role for N-Acetylneuraminic Acid in Coronary Artery Diseases. Circulation 137, 1374–1390. [DOI] [PubMed] [Google Scholar]
- Zhu W, Gregory JC, Org E, Buffa JA, Gupta N, Wang Z, Li L, Fu X, Wu Y, Mehrabian M, et al. (2016). Gut Microbial Metabolite TMAO Enhances Platelet Hyperreactivity and Thrombosis Risk. Cell 165, 111–124. [DOI] [PMC free article] [PubMed] [Google Scholar]
Associated Data
This section collects any data citations, data availability statements, or supplementary materials included in this article.
Supplementary Materials
(A) Demonstration of co-chromatography of analyte m/z 265.1188 within a plasma sample, and from synthetic PAGln and D5-PAGln run on UHPLC in tandem with a high resolution mass spectrometer on two different columns (reverse phase (C18) column (left panel) and normal phase (HILIC) column (right panel)).
(B) Demonstration of co-chromatography following derivatization of candidate plasma analyte m/z 265.1188, which shifted to m/z 307.1652, similar to behavior of authentic synthetic PAGln and the isotopologue D5-PAGln. The purified analyte in plasma with m/z 265.1188 (right panel) and synthetic PAGln and D5-PAGln were esterified with propyl chloroformate in propanol.
(C) Comparison of the high resolution CID mass spectra in positive ion mode of the propyl chloroformate/propanol derivative of the metabolite in plasma (m/z 265.1188), which now demonstrates MH+= m/z 307.1652 (red) and synthetic phenylacetylglutamine propyl ester (PAGln propyl ester; blue).
(D) Chromatograms generated by multiple reaction monitoring transitions (MRM) for the plasma analyte (m/z 265.2) and synthetic isotopically labeled phenylacetylglutamine internal standard (D5-PAGln; m/z 270.1). Both compounds were monitored at 3 different characteristic parent/daughter transitions.
(A) P-Selectin positive, human platelet (stained with PE-conjugated anti-P-selectin antibody) adhesion in whole blood to a microfluidic chip surface coated with collagen under physiological shear conditions ± the indicated concentrations of added PAGln (n=5 replicates per donor). Results from (n=4) donors are shown.
(B) ADP (2 μM) induced changes in aggregation in platelet rich plasma (PRP) pre-incubated with either PAGln 0 μM or PAGln 10 μM at 20 °C for 30 min (n=5 donors).
(C) The impact of PAGln (100 μM) on stimuli dependent platelet aggregation responses (TRAP6 (n=10), or collagen (n=5) at the indicated concentrations).
(D) The impact of increasing concentrations of PAGln on platelet responsiveness (monitored by platelet aggregometry) to submaximal stimulation by TRAP6 (n=5) or collagen (n=6) are shown.
(E) PRPs, isolated from healthy volunteers (n=9), were preincubated with PAGly (100 μM final, red) vs. normal saline (vehicle, blue) at 20 °C for 30 min, and then platelet aggregometry was used to assess platelet responsiveness to varying dose of ADP for each subject.
(F) At a fixed submaximal level of ADP, the effect of varied levels of PAGly on platelet responsiveness was monitored (n=6).
(G) Thrombin induced changes in intracellular calcium concentration [Ca2+] in Fura 2 filled washed human platelets (n=6) incubated with vehicle or PAGly (100 μM).
Significance was measured with non-parametric one- (Kruskal-Walis (K.W.)) or two-way ANOVA and Wilcoxon paired test. Data points represent the mean ± SEM (n=biological replicates).
(A) Levels of phenylalcetylglycine (PAGly; n=5; left panel) and phenylacetylglutamine (PAGln; n=5; right panel) in mouse plasma after i.p. injection (50 mg/kg) over time.
(B) Proposed metaorganismal pathway for production of phenylacetylglycine and phenylacetylglutamine.
(A) In MEG01 cells, a representative DMR response graph over time with the addition of collagen (10 μg/mL), Norepi (10 μM), PAGln (100 μM) or Phe (100 μM) is shown. The maximum response (in Δpm) to a given treatment is used to quantify the DMR response.
(B) DMR dose response of PAGln (n=6), Norepi (n=4) and Phe (n=4) in HEL 92.1.7 cells. Curves were generated quantifying the maximum DMR response after the indicated ligand addition.
(C) DMR response to 100 μM PAGln in MEG01 cells before and after the treatment with G-protein modulators, pertussis toxin (PTX; 100 ng/ml), cholera toxin (CTX; 1 μg/ml), YM-254890 (0.5 μM) or SCH-202676 (1 μM) (n=5-10 as indicated), which masks signaling through Gαi-subunit, Gαs-subunit, Gαq-subunit, or almost all G-protein coupled receptors, respectively. Values are normalized to maximum DMR response of PAGln, alone.
(D) Schematic describing the timeline of addition of different compounds and incubation periods in DMR experiments with inhibitors, modulators and siRNAs (left panel) and schematic describing the timeline of addition of different compounds and incubation period in cAMP measurement experiments with modulators and antagonists (right panel). Since different biological samples display variable DMR signal magnitude, the maximum DMR response of a test compound was normalized to 100% in all the subjects. cAMP levels were normalized to 100% in all the inhibitor treated or untreated samples before addition of PAGln or ISO.
(E) DMR response of PAGln (100 μM; left), Norepi (10 μM; middle) and collagen (10 μg/mL; right) in HEL92.1.7 cells after treatment with G-protein modulators, PTX (100 ng/mL), CTX (1 μg/mL), YM-254890 (1 μM) or SCH-202676 (1 μM) (n=4-9 as indicated). The maximum DMR response of a test compound (PAGln, Norepi or collagen) normalized to 100 % for each experimental group. Significance was determined by nonparametric-Mann Whitney (M.W.) test for pairwise comparison and Kruskal-Wallis (K.W.) test for multiple comparison. Data points represent the mean ± SEM (n=biological replicates).
(A-B) Intra cellular Ca2+ levels were measured after treating MEG01 cells (n=4) (A) and HEL92.1.7 cells (n=5-6 as indicated) (B) with the indicated concentrations of PAGln. ADP (10 μM) and TFLLR-NH2 (10 μM) were used as positive controls. ISO (10 μM) was used as negative control. Relative fluorescence unit (RFU) was quantified using the maximum peak fluorescence after ligand addition.
(C-D) cAMP levels in MEG01 cells (n=5-12 as indicated) (C) and in washed human platelets (n=3-8 as indicated) (D) were determined at indicated times after treatment with PAGln (100 μM) or with ISO (10 μM) as a positive control. Significance was determined by nonparametric-Mann Whitney (M.W.) test for pairwise comparison and Kruskal-Wallis (K.W.) test for multiple comparisons.
(E-F) cAMP levels in MEG01 cells (n=4-10 as indicated) (E) and in washed human platelets (n=5-10 as indicated) (F) after PAGln (100 μM) treatment for 5 min, in the presence of PTX (100 ng/mL), CTX (1 μg/mL), YM-254890 (1 μM) or SCH-202676 (1 μM) as indicated.
(G-H) cAMP levels in MEG01 cells (n=5-9 as indicated) washed human platelets (n=4-8 as indicated) after ISO (10 μM for 5 min) treatment in presence of either PTX (100 ng/mL), CTX (1 μg/mL), YM-254890 (1 μM) or SCH-202676 (1 μM) as indicated. Significance was determined by nonparametric-Mann Whitney (M.W.) test for pairwise comparison and Kruskal-Wallis (K.W.) test for multiple comparison. Data points represent the mean ± SEM.
(A) Levels of ADR2A, ADR2B and ADRB2 mRNAs were determined in MEG01 cell lines by quantitative real-time PCR after transfecting the cells with either control scrambled siRNAs or siRNAs against α2A, α2B and β2 adrenergic receptors as indicated (n=4).
(B-C) DMR response to epinephrine (Epi; 10 μM; n=6-11 as indicated) (B) and ATP (50 μM; n=5-9 as indicated) (C) was measured after transfecting the MEG01 cells with control scrambled siRNAs or siRNAs against α2A, α2B or β2 adrenergic receptors. Maximum response to Epi and ATP were normalized to 100%.
(D) DMR response to ISO (10 μM) (in the presence of selective β2 antagonist ICI118,551 (10 μM) and nonselective beta-blocker propranolol (10 μM)) and B-HT933 (50 μM) (with nonselective α2 antagonist RX821002 (10 μM)) was quantified after treating MEG01 cells with the indicated respective inhibitors for 30 min prior to ISO addition (n=4-6 as indicated). Maximum response of ISO and B-HT933 were normalized to 100%.
(E) DMR response to ATP (50 μM) in MEG01 cells after 30 min treatment with selective β2 antagonist ICI118,551 (10 μM), nonselective β-blocker propranolol (10 μM) or nonselective α2 antagonist RX821002 (10 μM) (n=4-9 as indicated).
(F) cAMP levels were measured in washed human platelets (n=5-7 as indicated) after treating the cells with PAGln (100 μM) for 5 min, in the presence of ICI118,551 (10 μM), propranolol (10 μM) or RX821002 (10 μM). cAMP levels were normalized to 100% in all the inhibitor treated or untreated subjects before addition of PAGln (n=number of biological replicates).
(G) Measurement of cAMP levels in MEG01 (left; n=6-10 as indicated) and in washed human platelets isolated from healthy volunteer donors (right; n=6-7 as indicated) after treating them with ISO (10 μM) for 5 min, in the presence of ICI118,551 (10 μM), propranolol (10 μM) or RX821002 (10 μM) as indicated. cAMP levels were normalized to 100% in all the inhibitor treated or untreated subjects before addition of ISO (n=number of biological replicates). Significance was determined by nonparametric-Mann Whitney (M.W.) test for pairwise comparison and Kruskal-Wallis (K.W.) test for multiple comparison. Data points represent the mean ± SEM.
(A) B-HT933 (50 μM; left and middle panel; n=5-12 as indicated) and ISO (10 μM; right panel; n=6-11 as indicated) DMR response was analyzed in parental HEK293, empty vector (EV) transfected HEK293, ADRA2A transfected HEK293 (left panel), α2B-HEK293 stably expressing cells (middle panel) and in β2-HEK293 stably expressing cells (right panel) after pretreating the cells with selective β2 antagonist ICI118,551 (10 μM), nonselective beta-blocker propranolol (10 μM), or nonselective α2 antagonist RX821002 (10 μM) for 30 min. (B-HT933 and ISO response was calculated with respect to relative ATP response in all the samples).
(B) ATP (50 μM) DMR response was analyzed as a negative control in ADRA2A transfected HEK293 (left panel), α2B-HEK293 stably expressing cells (middle panel) and in β2-HEK293 stable cells (right panel) after treating the cells with selective β2 antagonist ICI118,551 (10 μM), nonselective β-blocker propranolol (10 μM) or nonselective α2 antagonist RX821002 (10 μM) for 30 min as indicated (n=5-14 as indicated). (Maximum response to ATP was normalized to 100%).
(C) cAMP level was analyzed in parental CHO-K1 cells (black line), empty vector (EV) transfected CHO-K1 cells (blue line), ADRB2 transfected CHO-K1 cells (green line) and ADRB2 transfected CHO-K1 cells along with β2-antagonist ICI118,551 (10 μM; red line), after treating the cells with increasing concentration of either PAGln (left panel) or ISO (right panel) for 10 min (n=6).
(A-E) Intracellular Ca2+ levels were measured in parental HEK293 cells (A; n=5), β2-HEK293 stably expressing cells (B; n=5), EV transfected HEK293 cells (C; n=5), ADRA2A transfected HEK293 cells (D; n=4) and α2B-HEK293 stably expressing cells (E; n=4) treated with the indicated concentrations of PAGln. ADP (10 μM) and TFLLR-NH2 (10 μM) were used as positive controls for all cells. ISO (10 μM) was used as a negative control. Relative fluorescence units (RFU) were quantified using the maximum fluorescence peak after ligand addition.
(F) Platelet aggregation was measured in human platelet rich plasma (PRP; n=6) preincubated with selective β2-blocker ICI118,551 (10 μM) for 15 min followed by PAGln (100 μM) for 30 min before stimulation with a submaximal concentration of ADP (2μM). Data points represent aggregation as the percentage of maximum amplitude in PRP recovered from each human subjects. Significance was determined by nonparametric-Mann Whitney (M.W.) test for pairwise comparison and Kruskal-Wallis (K.W.) test for multiple comparisons. Data points represent the mean ± SEM; (n=number of biological replicates).
Data Availability Statement
There are restrictions to the availability of clinical data generated in this study as we do not have permission in our informed consent from research subjects to share data outside of our institution without their authorizations.