Abstract
Anatomically terminal parts of the urinary, reproductive, and digestive systems of birds all connect to the cloaca. As the feces drain through the cloaca in chickens, the cloacal bacteria were previously believed to represent those of the digestive system. To investigate similarities between the cloacal microbiota and the microbiota of the digestive and reproductive systems, microbiota inhabiting the colon, cloaca, and magnum, which is a portion of the chicken oviduct of 34-week-old, specific-pathogen-free hens were analyzed using a 16S rRNA metagenomic approach using the Ion torrent sequencer and the Qiime2 bioinformatics platform. Beta diversity via unweighted and weighted unifrac analyses revealed that the cloacal microbiota was significantly different from those in the colon and the magnum. Unweighted unifrac revealed that the cloacal microbiota was distal from the microbiota in the colon than from the microbiota in the magnum, whereas weighted unifrac revealed that the cloacal microbiota was located further away from the microbiota in the magnum than from the microbiota inhabiting the colon. Pseudomonas spp. were the most abundant in the cloaca, whereas Lactobacillus spp. and Flavobacterium spp. were the most abundant species in the colon and the magnum. The present results indicate that the cloaca contains a mixed population of bacteria, derived from the reproductive, urinary, and digestive systems, particularly in egg-laying hens. Therefore, sampling cloaca to study bacterial populations that inhabit the digestive system of chickens requires caution especially when applied to egg-laying hens. To further understand the physiological role of the microbiota in chicken cloaca, exploratory studies of the chicken’s cloacal microbiota should be performed using chickens of different ages and types.
Introduction
Avian gut microbiota displays certain features. First, avian gut microbiota aid in protecting host birds from pathogens and contribute to the development of the immune system of the hosts [1]. Second, antibiotics administered to these birds may affect the gut microbiota depending on the dose of the antibiotic used and the age of the birds [2]. Third, avian gut microbiota are saccharolytic rather than cellulolytic and help degrade polysaccharides contained in poultry feed [3]. Finally, gut microbes may be affected by the body temperature of their avian host [4]. The most abundant bacterial genus in chicken gut varied depending on the type of sample and measuring techniques for bacterial population used in previous studies. Studies using gut contents showed that the most abundant bacterial genus in chicken gut was Clostridium [5–7]. The most abundant bacterial genus in chicken feces was Bacteroides in lean chickens, but Clostridium in fat chickens [8]. Another study showed that the most abundant bacterial genus in chicken feces was Escherichia except unclassified genus [9], while the other study showed that the most abundant bacterial genus in chicken feces was Lactobacillus [10]. A Study used cloacal swabs showed that the most abundant bacterial genus in cloaca of broilers was Lactobacillus [11]. Usually feces were collected to study the gut microbiota, because collecting feces is non-invasive. However, cloacal swab was preferred for collecting individual samples from birds. Recently, gut microbiota of juvenile ostriches was compared with those of feces and cloaca. In the study, cloacal microbiota was far different to microbiota in colon and feces [12, 13]. In contrast to this study, some of microbiota in cloaca of turkey were matched to microbiota in intestine in genus level [14]. These results raised the question of whether cloacal microbiota can represent the intestinal microbiota in chicken. Therefore, this study aimed to compare cloacal microbiota with those in colon and magnum, a part of oviduct in SPF laying hens.
Materials and methods
Sample collections
Eleven 34-week-old SPF laying chickens were used in this study. All experimental procedures were approved by the institutional animal care and use committee of Konkuk University (approval number KU17103-1). Cloacae were swabbed using the CLASSIQ swabs (Coppan, Murrieta, CA, USA), which were then suspended in 2 ml phosphate-buffered saline (PBS). The suspended samples were stored at -20°C until DNA extraction for a day. Birds were euthanized using CO2 gas and the magnum in the oviducts and colons were aseptically harvested. Mucosal area of the magnum and colon were scraped using the back of a scalpel and suspended in 1 ml of PBS and stored at -20°C until DNA extraction for a day. Ten 30-week-old Hy-Line brown commercial layer chicken carcasses were used for the isolation of Lactobacillus spp. from the cloaca, colon, and magnum. Each location was swabbed with the CLASSIQ swab and the swab was streaked on De Man, Rogosa and Sharpe agar (MRS) agar. Streaked MRS agars were incubated in 37°C for 48 h. Species of all grown colonies were identified via Matrix-assisted laser desorption/ionization and time-of-flight (MALDI-TOF) spectrometry and species of colonies not identified via MALDI-TOF were identified via 16S rRNA sequencing with 357F and 926R primers.
Extraction of DNA and sequencing
Bacterial DNA was extracted in 1 ml of PBS using the DNeasy blood and tissue kit (Qiagen, Manchester, UK). Amplification of V2, V3, V4, V6-V7, and V9 regions of the 16S rRNA was conducted using primer sets from the Ion 16S Metagenomics kit (Thermo Fisher Scientific, Waltham, MA, USA). The Ion S5 XL sequencer and the Ion 530 chip were used for sequencing.
Sequence analysis
A Qiime2 platform [15] was used for metagenome analysis via the Greengenes database (13_8 release) as the 16s rRNA gene reference [16]. The first 15 bases of all reads were removed, each sequence was truncated at position 150, and reads below the phred quality score 15 were filtered using DADA2 [17]. Chimeric sequences were detected via vsearch [18] and removed. Operational taxonomic units (OTUs) were constructed with filtered sequences using a 99% identity option. The OTUs were classified with a Naive Bayes classifier [19]. Sampling depth was set up to 3000 feature counts for diversity metrics and alpha rarefaction. One magnum sample was excluded because it showed very different microbial components compared to the other magnum samples. Alpha diversity was measured using the Shannon index for non-phylogenetic alpha diversity metric [20]. Beta diversity was measured using unweighted unifrac [21] and weighted unifrac [22] for phylogenetic beta diversity. The Emperor tool was used to visualize principal coordinates analysis (PCoA) plots [23]. To evaluate associations among microbiota in the cloaca, colon and magnum, the pairwise permutational multivariate analysis of variance (PERMANOVA) statistic was used and p-values were produced with 999 permutation tests. Relative frequencies of taxa for each group were displayed in bar plots. Differentially abundant taxa of each group were identified via analysis of microbiome composition (ANCOM) [24]. A SourceTracker2 [25] was used to calculate the contribution of microbiota in the colon and magnum to microbiota in the cloaca.
Results
Sequencing results
The cloaca, colon, and magnum samples of 11 SPF hens were analyzed. Subsequently, 6,707,244 raw reads (mean 209,601.375 ± 88,595.49) were obtained (Table 1). Following filtering, 1,315,288 reads (mean 41,102.75 ± 27,937) were obtained and classified into 1192 OTUs, which clustered at a 99% identity level. The raw sequence reads were deposited in the NCBI sequence read archive under BioProject accession number: PRJNA604381.
Table 1. Raw reads, filtered reads, and total OTUs of each sample.
| Samples | Raw reads | filtered reads | OTUs |
|---|---|---|---|
| Cloaca1 | 218949 | 27012 | 203 |
| Cloaca2 | 214261 | 29918 | 146 |
| Cloaca3 | 262902 | 37777 | 152 |
| Cloaca4 | 258339 | 30567 | 154 |
| Cloaca5 | 252877 | 34276 | 170 |
| Cloaca6 | 303497 | 37132 | 98 |
| Cloaca7 | 340755 | 37701 | 111 |
| Cloaca8 | 434301 | 70203 | 207 |
| Cloaca9 | 208477 | 21132 | 127 |
| Cloaca10 | 253007 | 27500 | 201 |
| Cloaca11 | 209453 | 22595 | 148 |
| Colon1 | 230704 | 8928 | 143 |
| Colon2 | 190807 | 9963 | 154 |
| Colon3 | 151946 | 5281 | 103 |
| Colon4 | 149177 | 6690 | 120 |
| Colon5 | 185545 | 3502 | 81 |
| Colon6 | 172814 | 8161 | 139 |
| Colon7 | 195808 | 6609 | 126 |
| Colon8 | 98102 | 3474 | 83 |
| Colon9 | 175641 | 8161 | 141 |
| Colon10 | 184051 | 7398 | 97 |
| Colon11 | 212088 | 8556 | 125 |
| Magnum1 | 110363 | 7933 | 107 |
| Magnum2 | 68544 | 6684 | 335 |
| Magnum3 | 106573 | 7876 | 123 |
| Magnum4 | 60056 | 7039 | 204 |
| Magnum5 | 84874 | 11503 | 132 |
| Magnum6 | 315157 | 22100 | 188 |
| Magnum7 | 431246 | 34927 | 235 |
| Magnum8 | 181004 | 29282 | 343 |
| Magnum9 | 193660 | 24836 | 183 |
| Magnum11 | 252266 | 27712 | 243 |
Alpha diversity and beta diversity analysis
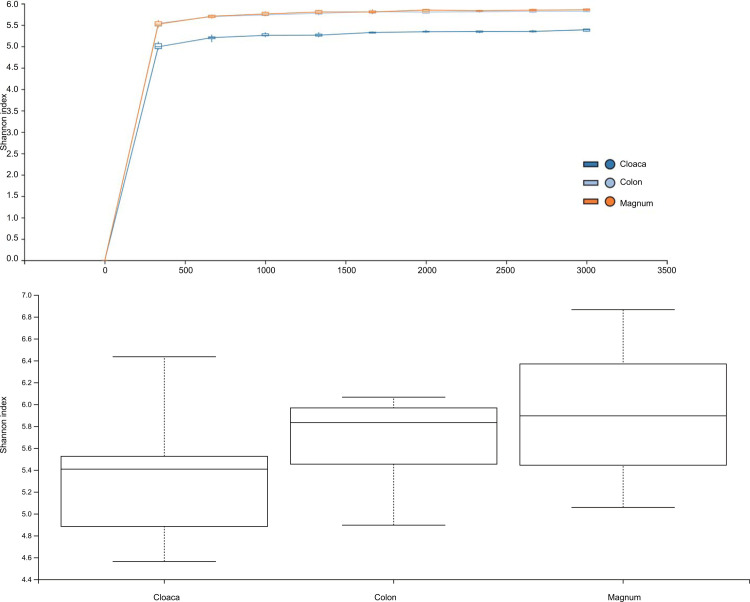
Alpha diversity of microbiota in the cloaca, colon, and magnum of 11 SPF hens were analyzed via the Shannon index, which is used to measure the non-phylogenetic alpha diversity metric. The Shannon index of microbiota in the cloaca was lower than those in the colon and magnum (Fig 1).
Fig 1. Comparison of the Shannon index between the cloaca, colon, and magnum.
Microbiota in the cloaca, colon, and magnum of SPF laying hens were analyzed via Shannon’s index. (A) Rarefaction curve for Shannon's index. The dark blue line represents the cloaca, the orange line represents the magnum, and the light (sky) blue line represents the colon. (B) Shannon's index for each group. Box plots show the quartiles, median, and extremities of the values.
However, this difference was not significant as indicated by the pairwise Kruskal–Wallis test for the Shannon index (Table 2).
Table 2. Pairwise Kruskal-Wallis tests for Shannon’s index of each group.
| Group 1 | Group 2 | H | p-value | q-value |
|---|---|---|---|---|
| Cloaca | Colon | 2.588214 | 0.107662 | 0.161492 |
| Cloaca | Magnum | 4.462810 | 0.034640 | 0.103921 |
| Colon | Magnum | 0.714050 | 0.398103 | 0.398103 |
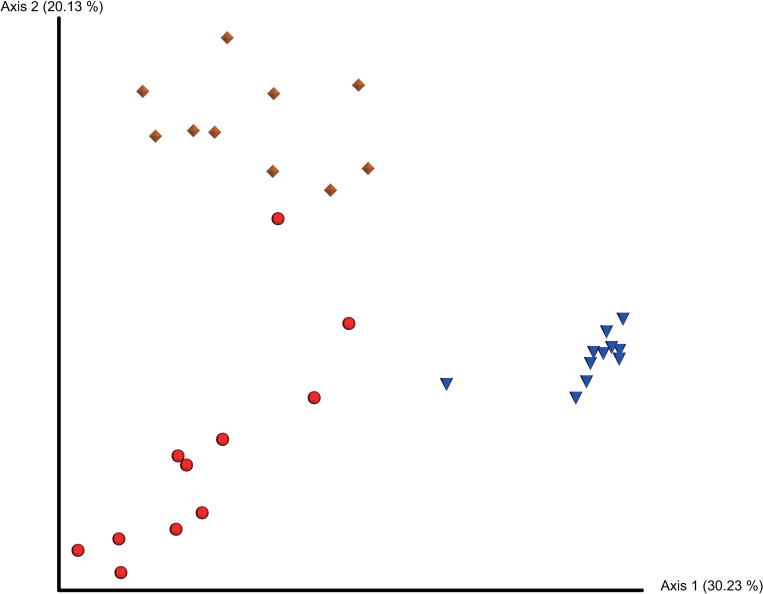
Beta-diversity analysis using an unweighted unifrac metric was performed to analyze distance among the microbiota in the cloaca, colon, and magnum. Microbiota in the cloaca, colon, and magnum were grouped separately on the PCoA plot (Fig 2).
Fig 2. PCoA plot based on unweighted unifrac distance matrix.
PCoA plots demonstrating unweighted unifrac distance among microbiota in the cloaca, colon, and magnum of laying hens. Red spheres represent the cloaca, blue spheres represent the colon, and yellow diamonds represent the magnum.
In the pairwise PERMANOVA, the cloaca, colon, and magnum showed statistically significant differences in microbial composition, furthermore the microbiota in the cloaca and colon were farther apart than the microbiota in the cloaca and the magnum (Table 3).
Table 3. Pairwise PERMANOVA results based on unweighted unifrac distance matrix.
| Group 1 | Group 2 | pseudo-F | p-value | q-value |
|---|---|---|---|---|
| Cloaca | Colon | 15.239907 | 0.001 | 0.001 |
| Cloaca | Magnum | 7.236330 | 0.001 | 0.001 |
| Colon | Magnum | 13.728121 | 0.001 | 0.001 |
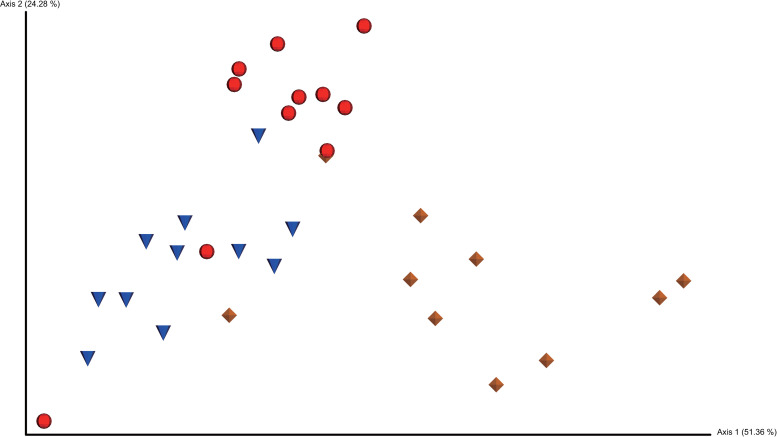
Beta-diversity analysis using a weighted unifrac metric was also performed to analyze distance among the microbiota in the cloaca, colon, and magnum. Microbiota in the cloaca, colon, and magnum were grouped separately on the PCoA plot (Fig 3).
Fig 3. PCoA plot based on weighted unifrac distance matrix.
PCoA plots demonstrating weighted unifrac distance among microbiota in the cloaca, colon, and magnum of laying hens. Red spheres represent the cloaca, blue spheres represent the colon, and yellow diamonds represent the magnum.
Pairwise PERMANOVA showed that the cloaca, colon, and magnum showed statistically significant differences in microbial composition, furthermore the microbiota in the cloaca and magnum were farther apart than the microbiota in the cloaca and colon (Table 4).
Table 4. Pairwise PERMANOVA results based on weighted unifrac distance matrix.
| Group 1 | Group 2 | pseudo-F | p-value | q-value |
|---|---|---|---|---|
| Cloaca | Colon | 8.492881 | 0.003 | 0.0030 |
| Cloaca | Magnum | 10.851457 | 0.001 | 0.0015 |
| Colon | Magnum | 17.966760 | 0.001 | 0.0015 |
Taxonomic analysis
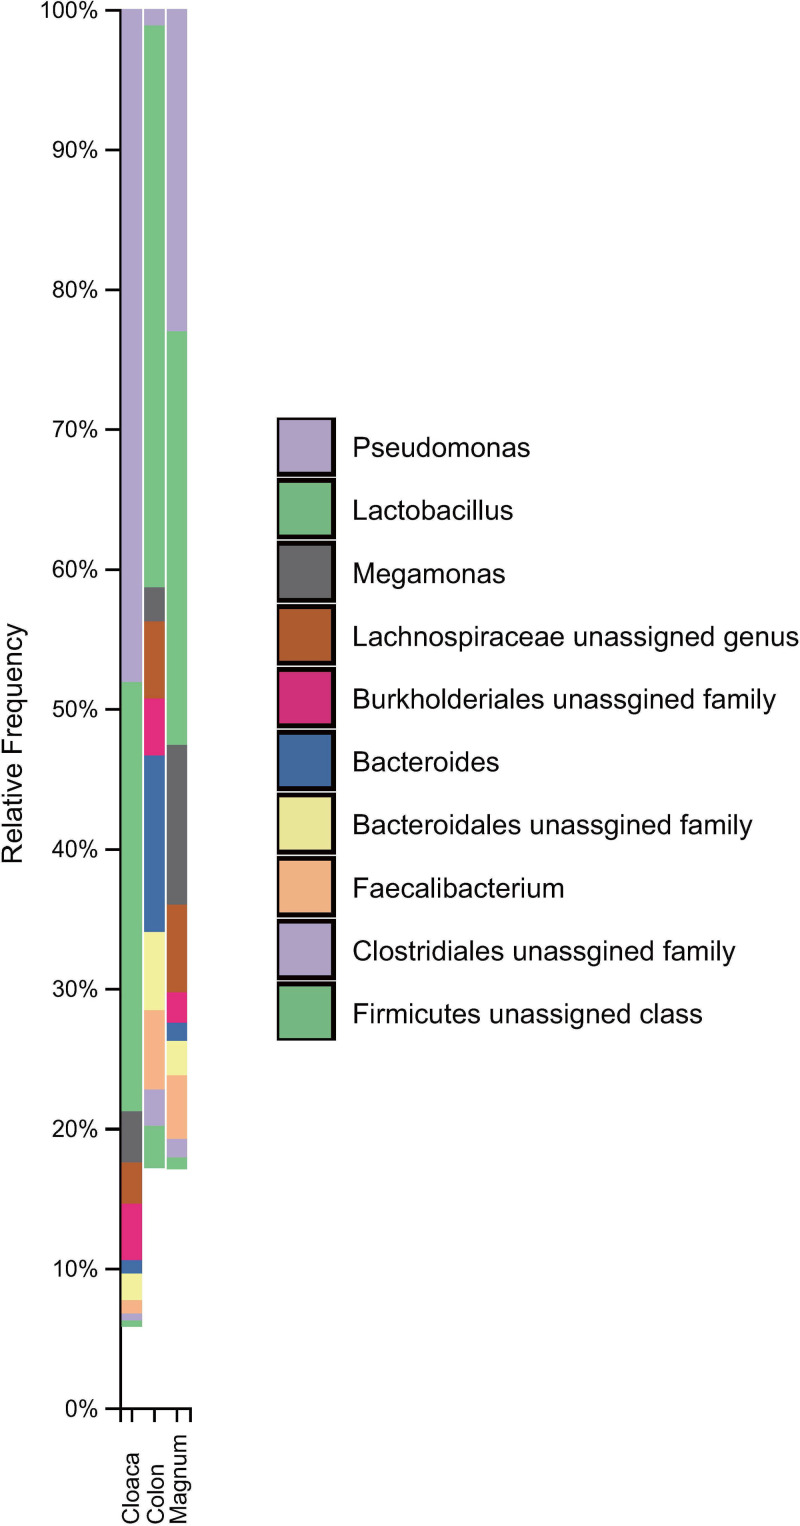
The relative taxa abundance plots at the genus level show the 20 most abundant taxa in the three groups. The most abundant genus in the cloaca was Pseudomonas, followed by Gallibacterium, Lactobacillus, Bacteroides, and unclassified Actinomycetales. The most abundant genus in the colon was Lactobacillus, followed by Bacteroides, unclassified Bacteroidales, unclassified Lachnospiraceae, and Faecalibacterium. The most abundant genus in the magnum was Flavobacterium, followed by Lactobacillus, unclassified Moraxellaceae, Pseudomonas, and Megamonas. To perform a taxonomic analysis of the shared microbiota in the cloaca, colon, and magnum, a sample each was pooled from one group respectively. Relative common taxa abundance plots at the genus level show the 10 most abundant taxa in the 3 groups (Fig 4). Lactobacillus spp. was the most abundant common taxa among each group.
Fig 4. Relative frequency of ten of the most abundant common taxa among all groups at the genus level.
Ten of the most abundant taxa, classified by different colors, are shown. Each bar indicates the relative frequencies of ten of the most abundant common taxa among all groups at genus level.
The most abundant common genus in the cloaca was Pseudomonas, followed by Lactobacillus, unclassified Burkholderiales, Megamonas, and unclassified Lachnospiraceae. The most abundant common genus in the colon was Lactobacillus, followed by Bacteroides, Faecalibacterium, unclassified Bacteroidales, and unclassified Lachnospiraceae. The most abundant common genus in the magnum was Lactobacillus, followed by Pseudomonas, Megamonas, unclassified Lachnospiraceae, and Faecalibacterium. The most abundant common genus among all groups was Lactobacillus, followed by Pseudomonas, Megamonas, Bacteroides, and unclassified Lachnospiraceae. There were 5 core taxa in the cloaca, 15 core taxa in the colon, and 20 core taxa in the magnum (Table 5).
Table 5. Core taxa* of each sampling group.
| Group | Taxa |
|---|---|
| Cloaca | Actinomyces |
| Enterococcus | |
| Lactobacillus | |
| Unclassified Actinomycetales | |
| Unclassified Gammaproteobacteria | |
| Colon | Bacteroides |
| Coprobacillus | |
| Lactobacillus | |
| Megamonas | |
| Unclassified Firmicutes | |
| Unclassified Bacteroidales | |
| Unclassified Burkholderiales | |
| Unclassified Clostridiales | |
| Unclassified RF39 | |
| Unclassified Coriobacteriaceae | |
| Unclassified Lachnospiraceae | |
| Unclassified Rikenellaceae | |
| Unclassified Ruminococcaceae | |
| Unclassified Veillonellaceae | |
| Magnum | Bacteroides |
| Brevundimonas | |
| Faecalibacterium | |
| Flavobacterium | |
| Lactobacillus | |
| Megamonas | |
| Methylobacterium | |
| Pseudomonas | |
| Rhodobacter | |
| Unclassified Betaproteobacteria | |
| Unclassified Actinomycetales | |
| Unclassified Bacteroidales | |
| Unclassified Burkholderiales | |
| Unclassified Clostridiales | |
| Unclassified Caulobacteraceae | |
| Unclassified Enterobacteriaceae | |
| Unclassified Lachnospiraceae | |
| Unclassified Microbacteriaceae | |
| Unclassified Moraxellaceae | |
| Unclassified Ruminococcaceae | |
| Unclassified Xanthomonadaceae |
* Genera detected in all samples in each group were considered as core genera.
Detection of Lactobacillus spp. at each location
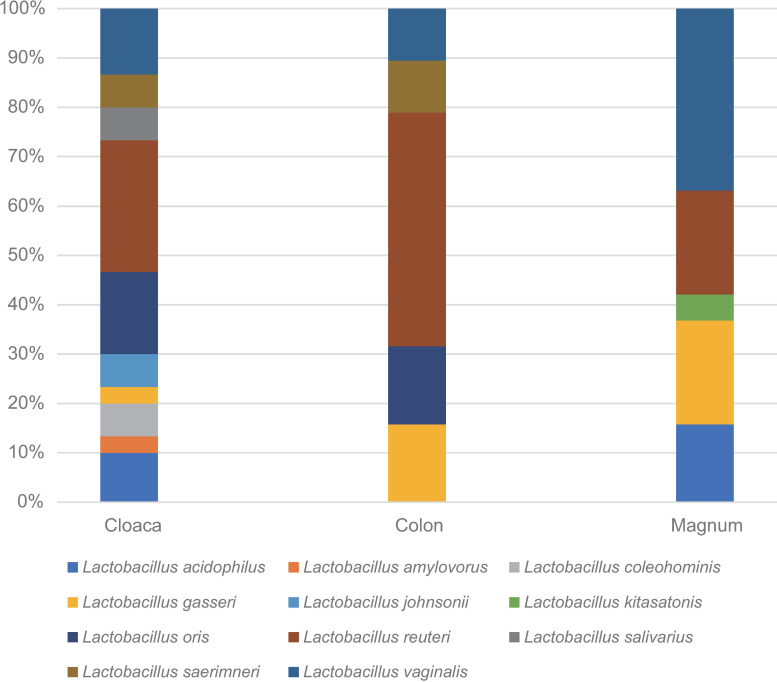
Lactobacillus spp. was the most common genus among each group. However, since the sequencing results of metagenomic analysis using 16S rRNA amplicon usually are not accurate enough to determine the correct bacterial species, we could not say the detected Lactobacilli were the same species or not. Therefore, additionally the dominant species of Lactobacillus spp. inhabiting each sampling site were investigated using culture technique. Lactobacillus spp. from each location were identified via MALDI-TOF spectrometry and 16s rRNA sequencing. Eleven Lactobacillus spp. were detected in the cloaca, 5 in the colon, and 5 in the magnum. Lactobacillus reuteri was the most dominant Lactobacillus sp. in the cloaca and colon, and Lactobacillus vaginalis was the most dominant Lactobacillus sp. in the magnum (Fig 5).
Fig 5. The distribution of Lactobacillus spp. detected at each location.
Detected Lactobacillus spp. at each location are indicated with different colors. Each bar indicates the relative detected frequencies of Lactobacillus spp. among all groups.
Differential abundance analysis
ANCOM was used to identify differentially abundant genera among the cloaca, colon and magnum. Gallibacterium, Enterococcus, Janthinobacterium, unclassified Gammaproteobacteria, Actinomyces, Helococcus, unclassified Pasteurellaceae, Stenotrophomonas, Morganella, and Comamonas were differentially abundant in cloaca. Unclassified Actinomycetales, unclassified Enterobacteriaceae, Acinetobacter, unclassified Xanthomonadaceae, and Corynebacterium were differentially abundant in the cloaca and the magnum compared with the colon. Flavobacterium, unclassified Rhodobacteraceae, Brevundimonas, unclassified Microbacteriaceae, unclassified Caulobacteraceae, unclassified Flavobacteriaceae, Propionibacterium, Methylobacterium, and Rhodobacter were differentially abundant in the magnum. Unclassified RF39, unclassified Coriobacteriaceae, and unclassified Bacteroidales were differentially abundant in the colon (S1 Table).
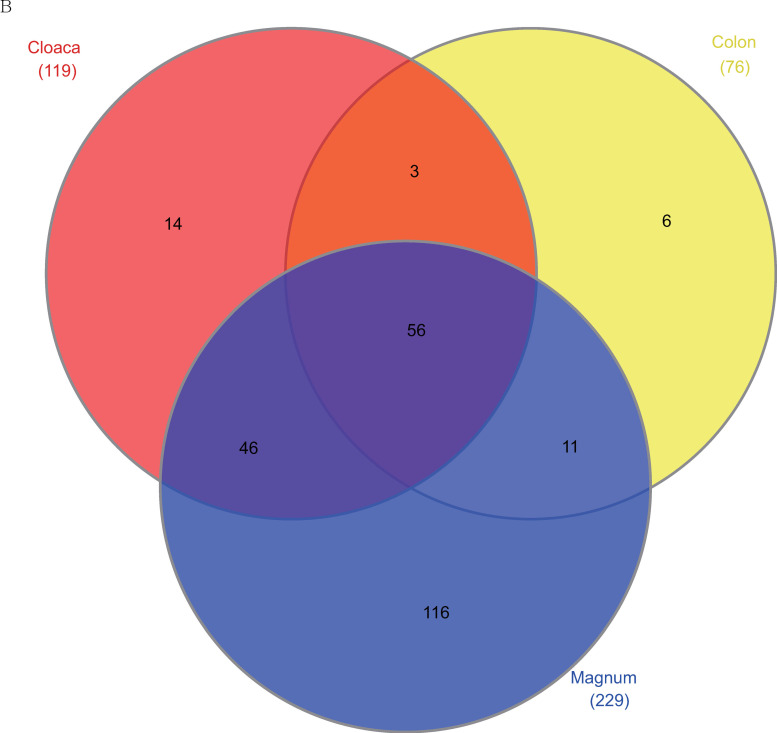
At the genus level, 56 genera were common to the cloaca, colon, and magnum (Fig 6).
Fig 6. Common and unique phylotypes at the genus level among each group.
Venn diagram demonstrating the number of common or unique phylotypes at the genus level among the groups. Phylotypes observed in each part were counted.
Origin of microbiota in chicken cloaca
The SourceTracker 2 was used to analyze the origin of the microbiota in the cloaca and each sample from one group was pooled. When the cloaca was assigned as the sink, 0.0669 of microbiota in the colon and 0.0809 of microbiota in the magnum contributed to the microbiota in the cloaca, whereas the highest contribution (0.8714) to the microbiota in the cloaca was from an unknown source (Table 6).
Table 6. Contribution of each source to each sink.
| Sink | Colon | Magnum | Cloaca | Unknown |
|---|---|---|---|---|
| Colon | - | 0.1029(0.0171) | 0.0257(0.007) | 0.8714(0.0176) |
| Magnum | 0.0192(0.0074) | - | 0.0111(0.0054) | 0.9697(0.0093) |
| Cloaca | 0.0669(0.0138) | 0.0809(0.0089) | - | 0.8522(0.0161) |
* Standard deviations are in parentheses.
Discussion
With the development of sequencing technology, research on gut microbiota is becoming active, and new roles of microorganisms in the intestine have been revealed [26]. Using a suitable sample for the study of gut microbiota is a very important factor in obtaining valuable results. Cloacal swab is a non-invasive and multiple sampling method for the same individual for the study of poultry intestinal microbiota [13]. Anatomically, cloaca is connected to the end of the digestive system, however in case of a hen, it also connects to the urinary and reproductive systems [13], so there was a question of whether the microbiota of cloaca can represent gut microbiota. In this study, we compared and analyzed microbiota present in the colon, oviduct, and cloaca of laying hens to assess whether it is possible to study the intestinal microbiota of laying hens using cloacal swabs. The results of this study indicated that the cloacal microbiota was significantly different from those in the colon and the magnum in the beta diversity analysis. Since colon and magnum samples were taken with scalpel and cloaca samples with swab, there may be a possibility that the microbiota may be different due to the difference in sampling method. Results of beta diversity analysis were slightly different between unweighted unifrac and weighted unifrac. Unweighted unifrac is a qualitative measure that does not consider the relative abundance of taxa, whereas weighted unifrac is a quantitative measure that considers the relative abundance of taxa [22]. In relative taxa abundance, the most abundant common genus in the cloaca was Pseudomonas, while the most abundant common genus in the colon and magnum was Lactobacillus. The cloaca is more aerobic than the colon and the magnum [27], and Pseudomonas is an aerobic bacteria [28] that may easily colonize the cloaca compared to the colon and the magnum. The most abundant common genus among all different sites was Lactobacillus. We used SPF white leghorn chickens to perform 16S rRNA metagenome analysis, while the Hy-Line brown commercial chickens were used in order to culture Lactobacillus spp. in all sampling sites. Although it is possible that different Lactobacillus spp. present in different breeds of chicken, culture results were consistent with those of the 16S rRNA metagenome analysis as all sampling sties contained Lactobacillus spp. Lactobacillus reuteri was the most dominant Lactobacillus spp. in the cloaca and colon, while Lactobacillus vaginalis was the most dominant Lactobacillus spp. in the magnum. Lactobacillus reuteri is an inhabitant in gastrointestinal tract in mammal and bird. Administration of Lactobacillus reuteri could improve growth of chickens having avian growth depression [29] and protect chickens from Salmonella Enteritidis challenge infection [30]. Unfortunately, role of Lactobacillus vaginalis in chicken has never been studied before. Lactobacillus gasseri were observed in magnum and colon in this study. Lactobacillus gasseri has been reported that it can produce lactocillin [31] and bacteriocin which have antimicrobial activity [32]. A small number of Lactobacillus spp. abundance have been linked to the development of bacterial vaginosis in human [33, 34]. According to our previous research [35], very few Lactobacillus spp. were present in the oviduct of unmatured pullets. Laying hen’s oviduct can be more easily infected by external bacteria than unmatured pullets, which may be one of the reasons that Lactobacilli increase in the oviduct of laying hens. Probably in the oviduct of chicken, Lactobacilli can protect the host against pathogenic bacterial infections. Since different Lactobacillus spp. were present in the intestine and oviduct of laying hens, there is a possibility that variety Lactobacillus spp. may protect the host from different species of bacterial pathogens in different body sites. Cloacal Lactobacillus spp. probably formed by the mixed population of Lactobacilli derived from the magnum and colon, and some Lactobacillus spp., which were absent in both of the magnum and colon. It can be assumed that cloacal lactobacilli are derived from not only the magnum and colon but also an unknown source (i.e., the environment). When the SourceTracker2 was used to find the original sources of the cloacal microbiota, the highest contribution (0.8714) was from an unknown source. Thus, in summation, although the colon and magnum contributed some species to the cloaca, overall, the microorganisms originating from the colon and the magnum were few. In conclusion, microbiota in the cloaca do not represent the microbiota in the digestive tract in egg laying chicken. Most notably, the SourceTracker2 results showed that the cloacal microbiota largely came from an unknown source, which is most likely an outside source from the ambient aerobic environment rather than from the digestive or reproductive track. Therefore, sampling cloaca to study bacterial populations that inhabit the digestive system of chickens requires caution especially when applied to egg-laying hens. To further understand the physiological role of the microbiota in chicken cloaca, exploratory studies of the chicken’s cloacal microbiota should be performed using chickens of different ages and types.
Supporting information
(XLSX)
Data Availability
All raw sequence reads files are available from the NCBI database (accession number: PRJNA604381).
Funding Statement
This paper was supported by Konkuk University in 2016 to SWL.
References
- 1.Brisbin JT, Gong J, Sharif S. Interactions between commensal bacteria and the gut-associated immune system of the chicken. Animal Health Research Reviews. 2008;9(1):101–10. 10.1017/S146625230800145X [DOI] [PubMed] [Google Scholar]
- 2.Zhou H, Gong J, Brisbin J, Yu H, Sanei B, Sabour P, et al. Appropriate chicken sample size for identifying the composition of broiler intestinal microbiota affected by dietary antibiotics, using the polymerase chain reaction-denaturing gradient gel electrophoresis technique. Poultry science. 2007;86(12):2541–9. 10.3382/ps.2007-00267 [DOI] [PubMed] [Google Scholar]
- 3.Vispo C, Karasov WH. The interaction of avian gut microbes and their host: an elusive symbiosis Gastrointestinal microbiology: Springer; 1997. p. 116–55. [Google Scholar]
- 4.Kohl KD. Diversity and function of the avian gut microbiota. Journal of Comparative Physiology B. 2012;182(5):591–602. [DOI] [PubMed] [Google Scholar]
- 5.Zhu XY, Zhong T, Pandya Y, Joerger RD. 16S rRNA-based analysis of microbiota from the cecum of broiler chickens. Appl Environ Microbiol. 2002;68(1):124–37. 10.1128/aem.68.1.124-137.2002 [DOI] [PMC free article] [PubMed] [Google Scholar]
- 6.Lu J, Idris U, Harmon B, Hofacre C, Maurer JJ, Lee MD. Diversity and succession of the intestinal bacterial community of the maturing broiler chicken. Appl Environ Microbiol. 2003;69(11):6816–24. 10.1128/aem.69.11.6816-6824.2003 [DOI] [PMC free article] [PubMed] [Google Scholar]
- 7.Holben WE, Feris KP, Kettunen A, Apajalahti JH. GC fractionation enhances microbial community diversity assessment and detection of minority populations of bacteria by denaturing gradient gel electrophoresis. Appl Environ Microbiol. 2004;70(4):2263–70. 10.1128/aem.70.4.2263-2270.2004 [DOI] [PMC free article] [PubMed] [Google Scholar]
- 8.Hou Q, Kwok L-Y, Zheng Y, Wang L, Guo Z, Zhang J, et al. Differential fecal microbiota are retained in broiler chicken lines divergently selected for fatness traits. Scientific reports. 2016;6:37376 10.1038/srep37376 [DOI] [PMC free article] [PubMed] [Google Scholar]
- 9.Tong P, Ji X, Chen L, Liu J, Xu L, Zhu L, et al. Metagenome analysis of antibiotic resistance genes in fecal microbiota of chickens. Agri Gene. 2017;5:1–6. [Google Scholar]
- 10.Tang Y, Underwood A, Gielbert A, Woodward MJ, Petrovska L. Metaproteomics analysis reveals the adaptation process for the chicken gut microbiota. Appl Environ Microbiol. 2014;80(2):478–85. 10.1128/AEM.02472-13 [DOI] [PMC free article] [PubMed] [Google Scholar]
- 11.Stanley D, Geier MS, Chen H, Hughes RJ, Moore RJ. Comparison of fecal and cecal microbiotas reveals qualitative similarities but quantitative differences. BMC microbiology. 2015;15(1):51. [DOI] [PMC free article] [PubMed] [Google Scholar]
- 12.Lobato E, Geraldes M, Melo M, Doutrelant C, Covas R. Diversity and composition of cultivable gut bacteria in an endemic island bird and its mainland sister species. Symbiosis. 2017;71(2):155–64. [Google Scholar]
- 13.Videvall E, Strandh M, Engelbrecht A, Cloete S, Cornwallis CK. Measuring the gut microbiome in birds: comparison of faecal and cloacal sampling. Molecular ecology resources. 2018;18(3):424–34. 10.1111/1755-0998.12744 [DOI] [PubMed] [Google Scholar]
- 14.Wilkinson TJ, Cowan A, Vallin H, Onime L, Oyama LB, Cameron S, et al. Characterization of the microbiome along the gastrointestinal tract of growing Turkeys. Frontiers in microbiology. 2017;8:1089 10.3389/fmicb.2017.01089 [DOI] [PMC free article] [PubMed] [Google Scholar]
- 15.Bolyen E, Rideout JR, Dillon MR, Bokulich NA, Abnet C, Al-Ghalith GA, et al. QIIME 2: Reproducible, interactive, scalable, and extensible microbiome data science. PeerJ Preprints, 2018. 2167–9843. [Google Scholar]
- 16.DeSantis TZ, Hugenholtz P, Larsen N, Rojas M, Brodie EL, Keller K, et al. Greengenes, a chimera-checked 16S rRNA gene database and workbench compatible with ARB. Appl Environ Microbiol. 2006;72(7):5069–72. 10.1128/AEM.03006-05 [DOI] [PMC free article] [PubMed] [Google Scholar]
- 17.Nearing JT, Douglas GM, Comeau AM, Langille MG. Denoising the Denoisers: an independent evaluation of microbiome sequence error-correction approaches. PeerJ. 2018;6:e5364 10.7717/peerj.5364 [DOI] [PMC free article] [PubMed] [Google Scholar]
- 18.Rognes T, Flouri T, Nichols B, Quince C, Mahé F. VSEARCH: a versatile open source tool for metagenomics. PeerJ. 2016;4:e2584 10.7717/peerj.2584 [DOI] [PMC free article] [PubMed] [Google Scholar]
- 19.Zhang H. The optimality of naive Bayes. AA. 2004;1(2):3. [Google Scholar]
- 20.Shannon CE. A mathematical theory of communication. Bell system technical journal. 1948;27(3):379–423. [Google Scholar]
- 21.Lozupone C, Knight R. UniFrac: a new phylogenetic method for comparing microbial communities. Appl Environ Microbiol. 2005;71(12):8228–35. 10.1128/AEM.71.12.8228-8235.2005 [DOI] [PMC free article] [PubMed] [Google Scholar]
- 22.Lozupone CA, Hamady M, Kelley ST, Knight R. Quantitative and qualitative β diversity measures lead to different insights into factors that structure microbial communities. Appl Environ Microbiol. 2007;73(5):1576–85. 10.1128/AEM.01996-06 [DOI] [PMC free article] [PubMed] [Google Scholar]
- 23.Vázquez-Baeza Y, Pirrung M, Gonzalez A, Knight R. EMPeror: a tool for visualizing high-throughput microbial community data. Gigascience. 2013;2(1):16 10.1186/2047-217X-2-16 [DOI] [PMC free article] [PubMed] [Google Scholar]
- 24.Mandal S, Van Treuren W, White RA, Eggesbø M, Knight R, Peddada SD. Analysis of composition of microbiomes: a novel method for studying microbial composition. Microbial ecology in health and disease. 2015;26(1):27663. [DOI] [PMC free article] [PubMed] [Google Scholar]
- 25.Knights D, Kuczynski J, Charlson ES, Zaneveld J, Mozer MC, Collman RG, et al. Bayesian community-wide culture-independent microbial source tracking. Nature methods. 2011;8(9):761 10.1038/nmeth.1650 [DOI] [PMC free article] [PubMed] [Google Scholar]
- 26.Maccaferri S, Biagi E, Brigidi P. Metagenomics: key to human gut microbiota. Digestive diseases. 2011;29(6):525–30. 10.1159/000332966 [DOI] [PubMed] [Google Scholar]
- 27.Barbosa A, Balagué V, Valera F, Martínez A, Benzal J, Motas M, et al. Age-related differences in the gastrointestinal microbiota of chinstrap penguins (Pygoscelis antarctica). PLoS One. 2016;11(4):e0153215 10.1371/journal.pone.0153215 [DOI] [PMC free article] [PubMed] [Google Scholar]
- 28.Sneath PH, Mair NS, Sharpe ME, Holt JG. Bergey's manual of systematic bacteriology. Volume 2: Williams & Wilkins; 1986. [Google Scholar]
- 29.Dunham HJ, Casas IA, Edens FW, Parkhurst CR, Garlich JD, Dobrogosz WJ. Avian growth depression in chickens induced by environmental, microbiological, or nutritional stress is moderated by probiotic administrations of Lactobacillus reuteri. Bioscience and microflora. 1998;17(2):133–9. [Google Scholar]
- 30.Nakphaichit M, Sobanbua S, Siemuang S, Vongsangnak W, Nakayama J, Nitisinprasert S. Protective effect of Lactobacillus reuteri KUB-AC5 against Salmonella Enteritidis challenge in chickens. Beneficial microbes. 2019;10(1):43–54. 10.3920/BM2018.0034 [DOI] [PubMed] [Google Scholar]
- 31.Check Hayden E. Vaginal microbe yields novel antibiotic. Nature News. [Google Scholar]
- 32.Pandey N, Malik R, Kaushik J, Singroha G. Gassericin A: a circular bacteriocin produced by lactic acid bacteria Lactobacillus gasseri. World Journal of Microbiology and Biotechnology. 2013;29(11):1977–87. 10.1007/s11274-013-1368-3 [DOI] [PubMed] [Google Scholar]
- 33.Spiegel CA, Amsel R, Eschenbach D, Schoenknecht F, Holmes KK. Anaerobic bacteria in nonspecific vaginitis. New England Journal of Medicine. 1980;303(11):601–7. 10.1056/NEJM198009113031102 [DOI] [PubMed] [Google Scholar]
- 34.Spiegel C. Bacterial vaginosis. Clinical Microbiology Reviews. 1991;4(4):485–502. 10.1128/cmr.4.4.485 [DOI] [PMC free article] [PubMed] [Google Scholar]
- 35.Lee S, La T-M, Lee H-J, Choi I-S, Song C-S, Park S-Y, et al. Characterization of microbial communities in the chicken oviduct and the origin of chicken embryo gut microbiota. Scientific reports. 2019;9(1):1–11. 10.1038/s41598-018-37186-2 [DOI] [PMC free article] [PubMed] [Google Scholar]


