Abstract
In this paper, we present a real-time convolutional neural network (CNN) based approach for speech source localization (SSL) using Android-based smartphone and its two built-in microphones under noisy conditions. We propose a new input feature set – using real and imaginary parts of the short-time Fourier transform (STFT) for CNN-based SSL. We use simulated noisy data from popular datasets that was augmented with few hours of real recordings collected on smartphones to train our CNN model. We compare the proposed method to recent CNN-based SSL methods that are trained on our dataset and show that our CNN-based SSL method offers higher accuracy on identical test datasets. Another unique aspect of this work is that we perform real-time inferencing of our CNN model on an Android smartphone with low latency (14 milliseconds(ms) for single frame-based estimation, 180 ms for multi frame-based estimation and frame length is 20 ms for both cases) and high accuracy (i.e. 88.83% at 0dB SNR). We show that our CNN model is rather robust to smartphone hardware mismatch, hence we may not need to retrain the entire model again for use with different smartphones. The proposed application provides a ‘visual’ indication of the direction of a talker on the screen of Android smartphones for improving the hearing of people with hearing disorders.
Keywords: Convolutional neural network, speech source localization (SSL), smartphone, direction of arrival (DOA)
I. INTRODUCTION
Speech source localization (SSL) using direction of arrival (DOA) estimation is one of the vital areas in signal processing that improves the performance of the many speech processing applications such as beamforming [1–4], speech enhancement (SE) [4–5] and speech/speaker recognition [6–7]. Another important application area for SSL as reported in [8–12] are hearing assistive devices (HADs). It has been reported that hearing-impaired people have difficulty in identifying talker direction that leads to communication-gaps during group activities, especially in the noisy environment. Hence, having a fast and reliable ‘visual and voice indication’ would be very helpful for hearing-impaired people. Furthermore, the estimated direction can be used to enhance the signal-to-noise ratio (SNR) of the desired talker speech [5]. Due to their widespread availability, smartphones offer the most accessible solution for hearing impaired people. Several speech processing applications such as real-time SE, audio compression, and adaptive feedback cancellation have been implemented and deployed on a smartphone for hearing aid users in [13–21]. Real-time video demos from our NIH-NIDCD supported project are available at http://www.utdallas.edu/ssprl/hearing-aid-project/ [22].
Various methods have been investigated and developed for SSL over the years. We can categorize the popular conventional method into three classes: (i) methods that decompose the autocorrelation matrix into signal and noise subspace like multiple signal classification (MUSIC) [23] (ii) methods that exploit time difference of signal arrivals like TDOA methods [24] (iii) methods that compute steered response power for estimating DOA like SRP-PHAT [25]. Deep learning (DL) has seen rising popularity in different areas such as computer vision [26], speech recognition [27], SE [28] due to the ability to model complex non-linear problems. A lot of promising works related to deep neural networks (DNN) based DOA estimation have been done as well. Some of these approaches use the DNN as replacement of the DOA algorithm [29–31], while some use DNN as a pre-processing step to the conventional method [32–34]. In [29], multi-layer perceptron (MLP) is used as a network architecture and input feature for MLP is GCC-PHAT. [30] exploits the CNN model, which is trained using phase of the short-time Fourier transform (STFT) of synthesized white noise. The authors of [31] propose two different sound localization methods using raw waveform. The first approach uses gammatone filter for feature extraction and the second one is fully data-driven method in [31]. The work in [32] shows that the performance of estimating time-frequency (TF) mask using DNN and applying to GCC PHAT outperforms using direct GCC PHAT as a feature set for time difference of arrival estimation. Another recent work [33] proposes DNN based phase difference enhancement for SSL. The authors of [33] firstly enhance the phase difference of each TF bins then estimate the DOA through k-means clustering. The work in [34] used CNN to predict time-frequency regions dominated by noise and reverberation, then they design a mask to remove the corrupted region. SRP-PHAT is used for DOA algorithm in [34]. In [35], the application of CNN to the minimum variance distortionless response (MVDR) scheme is explained. In [36] an approach is proposed based on discriminative machine learning (ML) from obtaining steering vectors to learning of the location estimator. [37] uses a probabilistic neural network (PNN) to estimate DOA. Although these promising algorithms perform well, most of them use only simulated data for training and inferencing. To the best of our knowledge, real-time implementation of these algorithms has never been published. Moreover, most of the discussed methods use more than four microphones, which leads to large feature dimensions on the input layer contributing to additional complexity to the model.
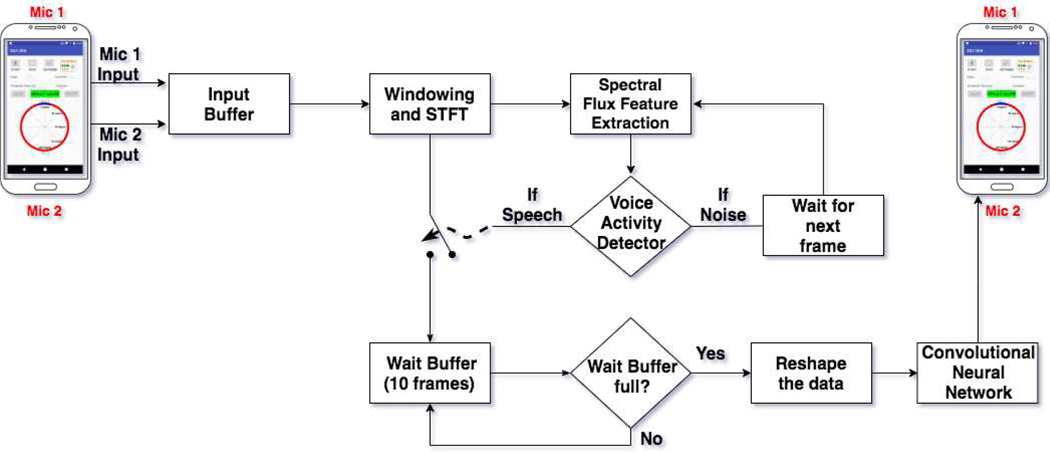
In this paper, we propose a CNN based SSL method which is trained in noisy and reverberant environments using simulated data in addition to real data recorded on a smartphone. Our first contribution is to propose a new feature set for the CNN model for SSL as used in this paper. Instead of explicit hand-crafted features from the microphone data (such as those in GCC-PHAT [30] or SRP-PHAT [34]), we use the STFT of the speech signal per microphone. Our second contribution is the efficient real-time implementation of CNN-based SSL on Android smartphone using its built-in two microphones for hearing aid applications. The pipeline of the proposed method is presented in Figure 1. Performance of the proposed CNN-based SSL algorithm along with the implementation details on Android-based smartphones are analyzed in this work. The proposed method is noise-robust and can work with only two smartphones’ microphones in different kinds of unseen noisy environments with low latency and very little computation footprint. The real-time video demo of the Android application in a noisy environment is available in http://www.utdallas.edu/ssprl/hearing-aid-project/ [22].
Fig. 1.
Block diagram of smartphone-based real-time processing modules in the proposed CNN-based SSL/DOA estimation application.
To reduce computation complexity, we use the real and imaginary part of the raw speech STFT instead of hand-crafted features. Raw STFT features are easier to compute and the CNN might learn better features than hand-crafted features. Speech presence is detected using a real-time simple voice activity detector (VAD) developed in [13]. The details about VAD will be given in the following sections. Incoming data frames from two microphones are processed by the VAD. If VAD decides that frame is speech then inferring process is performed using our pre-trained CNN model to estimate the DOA. If the incoming frame is detected as noise, then the previously estimated DOA estimate will be used.
Rest of papers is organized as follows: Section II explains the problem statement. The proposed method is presented in Section III. Experiment setup and evaluation metrics are in Section IV. Discussion of results for the proposed method is given in Section V. Section VI explains real-time implementation on Android smartphone, and Section VII concludes the paper.
II. PROBLEM STATEMENT
We are interested in using an array of two microphones built-in and available on most smartphones to accurately estimate the DOA angle of speech source in different noisy environments under low signal to noise ratios (SNRs). The smartphone alone is used in our approach with no external microphone(s) and no external hardware of any kind. The two built-in microphones of the smartphone are at a fixed close distance to each other and could have non-identical characteristics. Since these two built-in microphones are linearly located, they are called linear microphone array. The linear microphone array is not capable differentiate whether the arrival of the signal from right-hand or left-hand side. This is called the ambiguity problem. Since we use two built-in microphones of the Android-based smartphones, we have considered DOA angle range is [0°, 180°] because of ambiguity problem.
Often, SSL using DL is reformulated as a classification problem instead of a regression problem. There are two reasons for this: First, it has been shown that defining SSL as a regression problem using DNN has worse performance than a classification problem [29]. Secondly, for implementation reasons, instead of predicting ‘continuous’ angles (with high resolution), we would like to localize talkers with reasonable resolution. This means that very high-resolution SSL is not our main goal. Hence, we settle for a coarser class-wise resolution, i.e. of 10°, but high accuracy, i.e. 90%. These reasoning leads us to define SSL as a classification problem. Since the microphones on a smartphone are designed for different purposes (like voice pick-up and noise cancellation), they do not have identical frequency characteristics. Thus, an explicit equalization step is required for conventional methods. However, the equalization step can be implicitly learned and realized by the filters in the CNNs from the raw STFTs in this work.
III. PROPOSED SSL METHOD
In this section, we described the proposed method. Since the proposed method is based on a supervised learning method, it has two stages of training and testing/inferencing. Training is done offline and the pre-trained model is then implemented on the smartphone. Input feature representation of CNN based DOA estimation is explained in the following section.
A. INPUT FEATURE REPRESENTATION
Determining input feature-set is crucial for supervised learning. Input feature set should have enough DOA information to be learned by the CNN. In [30], the phase of the signal is considered as an input feature set. [4] states that signal energy is also used for speech source localization for humans. Therefore, we have decided to use real and imaginary part of short time Fourier transform (STFT) of input speech frames which is defined by
| (1) |
Xch (m, k) is complex STFT. x [n] is the input signal and w [n − m] is a window to get small frames of the signal. Subscript ch (i.e. 1,2) denotes the microphone index. The real and imaginary part of Xch (m, k) are used as the input feature set for the proposed method. Following matrices show input feature sets:
| (2) |
The dimension of each set is given by 2×(NF /2 + 1). NF is the number of FFT points. Since FFT of a signal is symmetric in the frequency domain, we use only the positive half of STFT of data. Hence, while the number of rows is fixed to two (equal to the number of microphones), the column number depends on the number of STFT points.
B. CNN BASED SSL
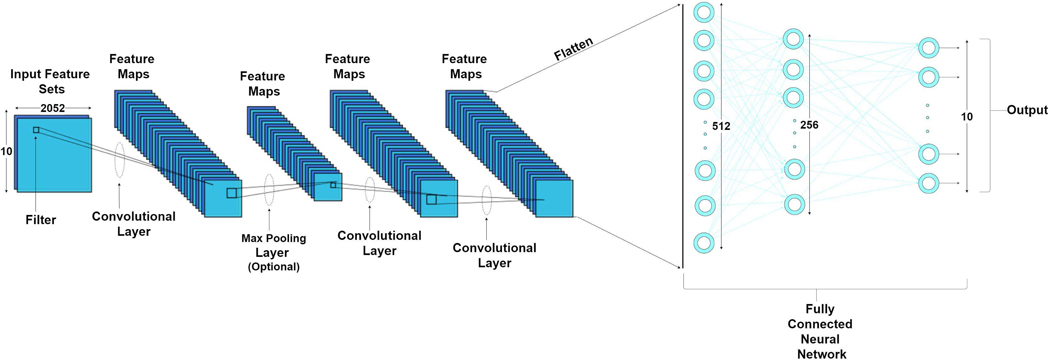
Figure 2 shows CNN topology of the proposed method. There are five main layers in the topology viz. input layer, convolutional layer, pooling layer, fully connected (FC) layer, output layer. The input layer consists of input feature sets defined in the previous section. We have two sets of matrices that consist of the real and imaginary part of STFT of the speech signal. Inputs are processed by convolutional layer. A set of kernels, i.e. filters, is convolved with small parts of input matrices in the convolutional layer. These kernels enable us to find out local information on the spectrum for SSL. After the application of filters, feature maps are generated by each convolutional layer. Pooling layer helps us to reduce the feature map resolution for decreasing computational complexity. In this work, we have used max pooling which takes maximum values in the 2×2 matrix. After max pooling layer, feature maps are flattened and fed into fully connected (FC) layer. FC layer performs classification using activation function. For this study, Rectified Linear Unit (ReLU) [38] is used as an activation function in FC layers. Softmax activation function (gives a probability of each class) is utilized in the output layer. The highest probability is selected as the output class which can be shown as:
| (3) |
Fig. 2.
Block Diagram of CNN based SSL/DOA angle estimation architecture. The CNN consists 3 components. Input image is first convolved with kernels. The final convolutional layer obtained by stride of 2 is flattened and fed into fully connected layer. Finally, output is fed to the softmax layer.
The angle denotes estimated DOA angle, is the probability of c-th class when given the i -th time frame as . The CNN architecture used in this work includes 3 convolutional layers. Each convolutional layer has 64 filters with 2×2 strides. There is one optional max pooling layer after each convolutional layer. First FC layer has 512 nodes with ReLU activation function. The second one has 256 nodes with ReLU. We have 10 output classes with Softmax activation layer in the output layer.
C. VOICE ACTIVITY DETECTOR
In real life, we are exposed to different kind of noises. The presence of background noise leads to performance degradation for DOA estimation. We would like to see the performance of the proposed method under noisy condition. Since we train the model with only speech, the proposed method requires classifier which labels speech segment (includes clean or noisy speech) and noise (or silence) segment. This classifier is called voice activity detector (VAD). As it is seen from Figure 1, if the incoming frame is detected as speech, the frame is fed to pre-trained model making a new estimation, else, the DOA angle estimate from the previous frame is retained:
| (4) |
Where angle denotes the corrected DOA estimate after VAD for ith frame. Thus, the VAD prevents model to estimate the DOA angle with noise-only frames. In this work, to reduce the real-time processing burden and to reduce CNN size, we utilize a simple single-feature based VAD. That is, ‘Spectral Flux (SF)’ is used as a feature for VAD [13]. The definition of SF is given by:
| (5) |
for kth frequency bin and i th frame. k = 1, 2, … , N . |X | denotes the magnitude spectrum of X .
A simple thresholding technique is given by:
| (6) |
where ξ is the calibration threshold.
eWe have used SF based VAD because it is easy to implement, and it has satisfactory robustness under stationary conditions [13]. In order to make our app robust under nonstationary noise, two parameters are defined for the VAD. The first parameter is decision buffer, D, which makes a VAD decision when D contiguous frames are detected as speech. The second parameter is called threshold, T ,e which determines initially how many frames is assumed as noise.
Following are the steps in the proposed DOA angle estimation method for efficient real-time implementation:
Pre-filtering using SF-based VAD to label the incoming frame as noise or speech;
If the incoming frame is detected as speech, STFT of the incoming frame is fed to CNN;
Inference is done using the pre-trained CNN model.
IV. EXPERIMENTAL SETUP AND EVALUATION
We present the experimental setup and evaluation for the proposed CNN based SSL/DOA method in this section. The performance metrics and experimental setup for simulated and smartphone recorded data are also explained in this section. The proposed method is compared with similar methods introduced in [29, 30]. For a fair comparison, we have trained the model with both noisy and clean speech data from ten different talker directions.
A. PERFORMANCE METRICS
Classification accuracy (ACC) used for quantifying the performance of the SSL/DOA estimation method is defined as
| (7) |
where Nc is the total number of correct DOA angle estimation and NF denotes the total number of frames per test case.
B. NOISY DATASET AND EXPERIMENTAL SETUP
We use simulated data and real recorded data on a smartphone to create the datasets used to train and evaluate our proposed method. The details about the datasets are given in the following subsections.
1). SIMULATION DATA:
The simulated data is prepared by adding clean speech from HINT [39] and TIMIT [40] databases to noise files collected outdoors on a smartphone at different signal to noise ratios (SNRs). The room impulse responses (RIRs), simulated via Image-Source Model [41], are generated according to different DOA angles, θ. The resolution of simulated data is 10 degree and each clean speech are a stereo channel (dual microphones). The distance between the two smartphones’ microphones is 13cm. The room size is 5m × 5m × 5m and the array of two microphones, i.e. smartphone, is located at the center of the room. The speaker distance from microphone array is 1 meter. Two noise types are considered viz. White (W), Babble (B) at three different SNRs (0dB to 20dB steps of 10dB).
2). SMARTPHONE RECORDED DATA:
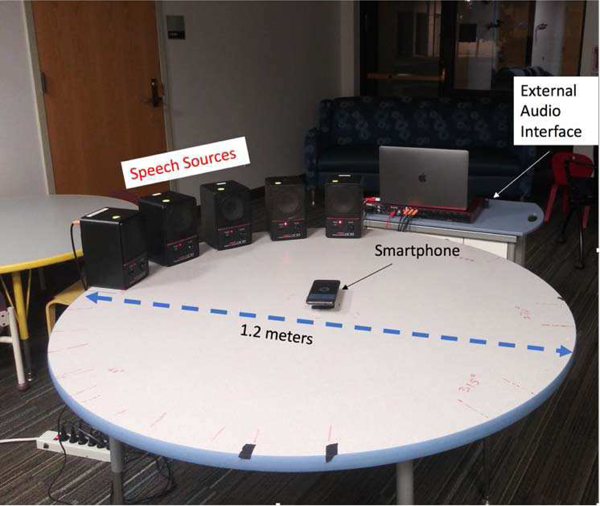
Since our goal is to implement the proposed method on the smartphone for people’s hearing improvement, we need real smartphone recorded data for training. Training the model on real recorded data makes it more robust to real-life noise and reverberation. Hence, real data is collected using Pixel 1 smartphone to get the model better trained for our applications. The data is recorded in three different rooms. In all rooms and around the smartphone on the table, we place five loudspeakers apart from each other so that the resolution is 20°. Since the DOA angle range is between [0°, 180°], we rotate the smartphone by 90° for this setup to capture another five loudspeaker signals. This way we have a total of ten loudspeakers per setup in each room (shown in Figure 3). We have 2 different setups for room 1. The distance between smartphone and loudspeakers for setup 1 and 2 in room 1 are 0.6 m and 2.4 m, respectively. The distance between smartphone and loudspeakers for room 2 and 3 are 1.3 and 0.92 meters respectively. The dimensions for room 1, 2, and 3 are 7m × 4m× 2.5m, and 6.5m × 5.5m × 3m, and 5m × 4.5m × 3m, respectively. Reverberation times vary between 300–600ms between the Rooms 1, 2 and 3. Table I shows the configuration of data recording. Figure 3 displays one setup of the data collection in Room 1. For recording, we have used clean speech files from HINT, TIMIT, and LibriVox [42]. The speech files from all three databases are mixed together randomly which would make the data more diverse and realistic. Female and male speakers/speeches are chosen from the speech databases almost equally. 35 minutes recording is done by smartphone for two setups in room 1. And, smartphone recorded 15 minutes for room 2 and 3. Noise files played from a loudspeaker and recorded separately in room 2. The loudspeaker, plays noise files, is located 3.5 meters away from the smartphone (not shown in Figure 3). Pixel 1 smartphone is used for separately recording noise files. Noise files were chosen from the DCASE 2017 challenge database [43] which includes real recordings. Vehicle (‘Traffic’) noise and multi-talker babble (‘Babble’) noises are selected from the DCASE 2017 database. In the dataset, we also used actual noise in a Magnetic Resonance Imaging (MRI) room with a 3-Tesla imaging system [44] to incorporate a machinery noise (‘Machinery’) containing strong periodic component. To generate noisy mixtures, clean speech and noise files are mixed at different SNRs levels.
Fig. 3.
One of the setup of data collection used to train the proposed CNN-based SSL/DOA estimation method
TABLE I.
DATA COLLECTION SUMMARY
| Room Size | Room 1 (7 × 4 × 2.5) m, |
| Room 2 (6.5 × 5.5 × 3 ) m, | |
| Room 3 (5 × 4.5 × 3) m | |
| Array positions in room | 2 different location in Room 1 |
| Source-array distance | 0.6 and 2.4 m for Room 1, |
| 1.3 m for Room 2, and | |
| 0.92 m for Room 3 | |
| RT60 | 400, 350, 300ms for Room 1, 2, and 3, respectively |
| SNR | −5,0, 5 dB |
| Sampling Frequency | 48 kHz |
V. RESULTS AND DISCUSSION
The proposed method is evaluated using simulated and real recorded data by smartphone. The 2D images, which are used as input features to CNN, are formed using real and imaginary parts of STFT. The sampling frequency of 16 kHz and 48 kHz for simulated and recorded data, respectively. FFT length is 512 and 1024 for simulated data and real recorded data, respectively. Various noise types and SNRs are utilized.
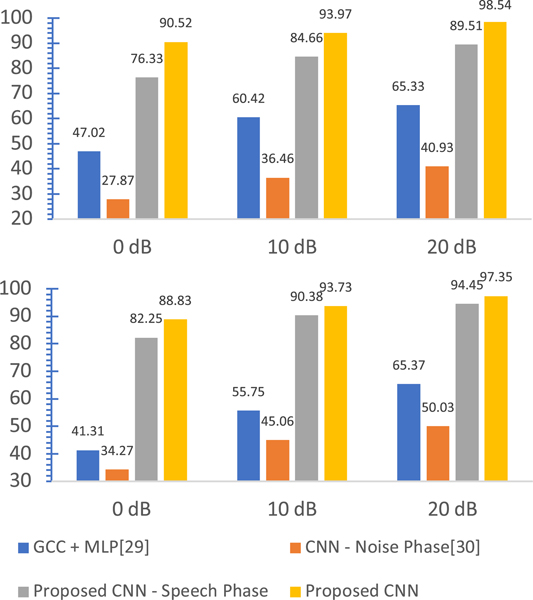
We first present results for our experiments using simulated data. Figure 4 shows a comparison of the proposed method against other deep learning based DOA methods using simulated data. Our first DOA developed method (The Proposed CNN-Speech Phase) uses phase information of speech as input for CNN, whose topology is the same as ours second/main proposed method (The Proposed CNN), see Figure 4. The method from [29] is MLP based method which uses GCC Phat information as an input and is denoted as GCC + MLP. The method from [30] utilizes synthesized white noise phase information in training. It uses the model for estimation on speech files and CNN – Noise Phase is used in [30]. The reason for including our first proposed method is to make a comparison fair with the method in [30] which uses white noise in the training part. These methods are compared under white and multi-talker babble noise at 0, 10, 20 dB SNR, where 90% of data is utilized for training and the rest is for testing. As it is seen from Figure 4, both of our proposed methods have superior performance among all other methods when the resolution is 10 degrees. For all SNR values, the proposed method (The Proposed CNN in Figure 4) has at least 90% accuracy for white noise. Another observation from the figure is that the performance of all methods increases with increasing SNR. Another observation is that the performance of the method in [30] under Babble noise has higher accuracy compared to its performance under white noise. The reason for this situation would be the model is trained with white noise for the method from [30]. Since this is two microphone DOA estimation, the method in [30] might require more training data for better performance. The last observation from Figure 4 is method in [29] that performs better compared to the method in [30] even though [29] uses MLP with input sets of GCC-PHAT.
Fig. 4.
Accuracy result for DOA angle estimation using simulated data under (top) white noise and (bottom) babble noise
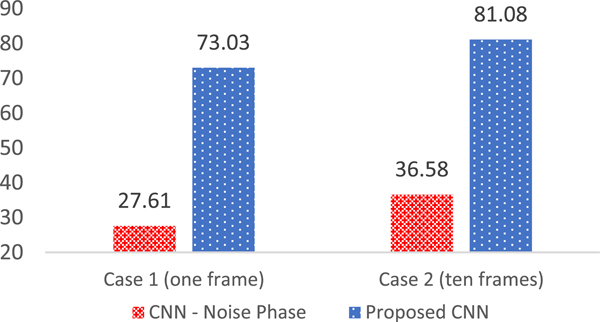
Another note to be made is the comparison between our proposed method and the method in [30] where [30] exploits CNN for DOA estimation like us. Figure 5 shows the comparison of the proposed method versus method in [30] for an unseen environment when there is no background noise with smartphone recorded data. The training data for the two methods of Figure 5 is generated using data from Room 1 and 2. We have two different setups for Room 1 as it was mentioned in the previous section. Room 3 data is used for generating test data. There are two cases for comparison: While case 1 uses one frame information for forming image to feed CNN, case 2 uses ten consecutive frames. The accuracy of the proposed method for case 1 and 2 is 73% and 81%, respectively-a relative improvement of about 8%. However, the performance of the method in [30] for case 1 and 2 is about 27% and 36%, respectively when using smartphone recorded data. A reason for such huge difference between accuracies shown in Figure 5 could be that [30] trains model using synthesized white noise while we have used speech for training in our method and in implementing the method of [30] for the comparison analysis. Another reason could be that [30] uses two identical microphones for data generation while in our comparison analysis between the two methods we have used the two built-in microphones of the smartphone which could have mismatch characteristics, e.g. different gains.
Fig. 5.
Accuracy Results using real recorded data for unseen environment (no background noise)
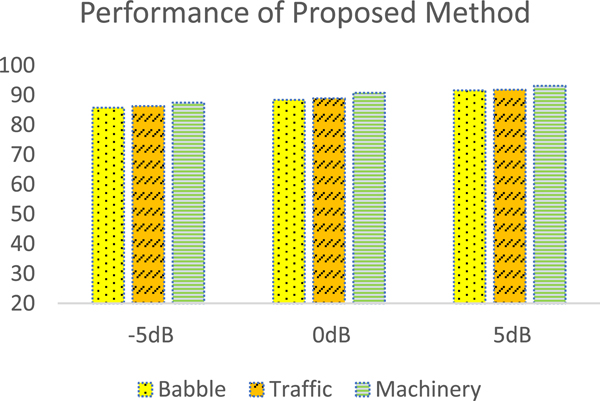
Figure 6 shows the accuracy performance of the proposed method under babble noise using real recorded data. For this figure, the results are collected under multi-talker babble, traffic, and fMRI, which is denoted as Machinery in Figure 6, noises at −5, 0, 5 dB. 90% and 10% of data is used for training and testing, respectively for figure 6. The first observation from Figure 6 is that the accuracy increases with an increase in SNR. According to Figure 6, the best results were seen under fMRI noise and the worst results are under Babble noise. This is expected because fMRI noise has strong periodicity (i.e. stationary property) and Babble noise is defined as the toughest noise type (i.e. non-stationary property) since it contains multiple speeches. For 5 dB SNR, the proposed method has more than 90% accuracy for all noise types. This performance results also prove that our proposed method works satisfactorily well in real-time.
Fig. 6.
Accuracy Results using real-recorded data under different noises for the proposed DOA angle estimation
VI. REAL TIME IMPLEMENTATION ON ANDROID BASED SMARTPHONE (PIXEL)
This section presents the real-time implementation of the proposed CNN-based DOA estimation algorithm on the Android-based smartphone. We use Android operating system (OS) that allows us to access the two built-in microphones of the phone/tablet.
A. OFFLINE TRAINING
The model is obtained through the training process and will then be put on and implemented by the Android-based smartphone. For the training and data generation process only portions of clean speech or speech portions of noisy speech files are utilized. Each input data frame is 20ms sampled at 48 kHz. Every input data frame is multiplied by a Hanning window. After performing STFT of every data frame, feature files are generated using the STFT coefficients and DOA labels. The trained model is generated using the data recorded by the smartphone. Since the data is recorded at 48 kHz, the NF selected for STFT is 1024 for every data frame of 20ms. As mentioned in Section III.A, NF /2 + 1 points of the real and imaginary part of STFT is used. Therefore, the dimension of data with added labels is equal to the number of frames multiplied by 2053 for two microphone case. After the data generation process, TensorFlow [45] is used for the training model. The reason for using TensorFlow is that it has C/C++API which can be used on Android platforms.
B. REAL-TIME IMPLEMENTATION
The detailed block diagram of real-time implementation of CNN based DOA estimation is given in Figure 1. The 20ms signal frame is captured at 48kHz sampling frequency. The captured signal frames by 2 mics are stored in Input Buffer which can store 20 frames. Then the Hanning window is applied to each frame of data and the frequency response of the frame is calculated using STFT. Next, the SF feature of the incoming frame is extracted using (5). The calibration threshold of the VAD is calculated using ‘Threshold’ which assumes the first few frames to be noise, as explained in Section III.C. After threshold calculation, VAD labels the incoming signal as speech or silent (noise) using ‘Duration’ parameter. If the VAD labels frames as speech, the STFT of the frame is stored in ‘Wait Buffer’. Otherwise, the buffer waits for the next speech frame. When ‘Wait Buffer’ size reaches 10 frames of data, the data inside the buffer is reshaped as 10×2052. The structure should be like the following:
| (8) |
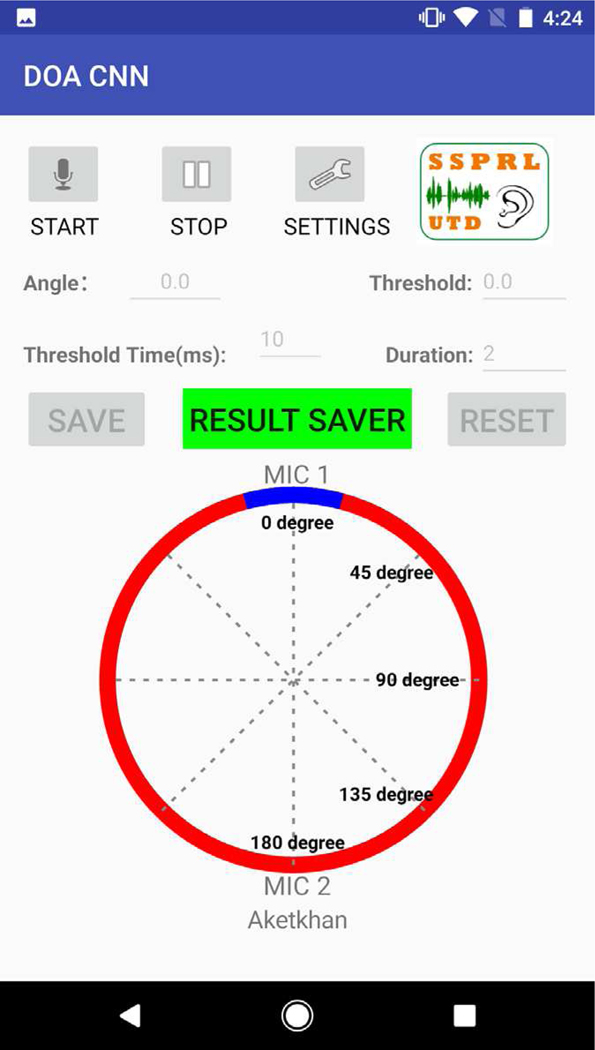
‘Imag of Ch1’ and ‘Real of Ch1’ denote imaginary and real parts of STFT for microphone 1, respectively. ‘Imag of Ch2’ and ‘Real of Ch2’ are for microphone 2. The reshaped data is fed to the pre-trained model, which was explained in the previous section. The output of the CNN model is 1×10 since we have 10 output classes. These 10 numbers show probabilities of each class, so we decide the class or DOA angle by finding the class with maximum probability. After that, we update the Graphical User Interface (GUI) to display the estimated DOA angle on the smartphone screen for the user as shown in Figure 7.
Fig. 7.
GUI display of the developed Android app for DOA angle estimate on Pixel 1.
As it is seen in Figure 7, we have four main buttons. ‘Start’ and ‘Stop’ button is used for starting and stopping the proposed DOA angle estimation app, respectively. ‘Setting’ button is for updating the VAD ‘Threshold and Duration’ parameters. Thanks to these two parameters, the application can run continuously in various environments. The direction (DOA angle) of speech source is shown numerically as well as graphically by the blue markers. The last main button is ‘Result Saver’. This button is used for saving estimated DOA angles. When we touch this button, the popup screen asks the direction of the speaker. We calculate the accuracy and root mean square error (RMSE) of the proposed real-time DOA app using the actual and estimated direction of the speaker for 100 experiments. Another feature provided by the proposed DOA app is ‘Voice Assist’. The speaker location (DOA angle) is also announced vocally through the smartphone using the ‘Voice Assist’ feature for every 10 angle estimations. The announcement says; ‘The speaker at θ degree’. θ indicates the estimated DOA angle consistent with its screen display. We have named this feature as ‘Voice Assist’.
We have a manual solution for ambiguity problem which is mentioned in Section II. The proposed app shows only one blue marker when the talker is at 0° and 180° (see Figure 7 for angles). Two blue markers (because of ambiguity problem) are displayed on GUI when the speaker is at a different angle than 0° and 180°. The solution would be rotating the smartphone clockwise. If rotating smartphone clockwise decreases the estimated angle, the talker is the right-hand side. Otherwise, the talker is left-hand side. This manual solution would resolve the ambiguity problem for two microphone based DOA angle estimation method. The video demonstration of the proposed CNN based DOA estimation can be seen at http://www.utdallas.edu/ssprl/hearing-aid-project/ [22].
C. IMPLEMENTATION HIGHLIGHTS
Four parameters are critical for the real-time implementation; training size, wait buffer, reshaping and model size. First one is the training size for training of the model. Since we have a limited dataset size, when the training size is large, like 80% to 90%, the model is overfitted to the collected data. Hence the trained model is not able to work well with new unseen data in real-time operation. To resolve this issue, we have defined training data size as 50% for training the CNN model. For the second one, we use a ‘Wait Frame Buffer’ to get more accurate estimations. Thus, the DOA angle estimations are done based on ten frames (each frame is 20ms) for real-time implementation of our algorithm. The third one is reshaping part of the model. Hence, the model is fed by data whose dimension is 10×2052 (for inference, the label isn’t required, hence the dimension is not 10×2053) for real-time implementation. Finally, the optimization operations are applied to the model to decrease model size. 32-bit floating-point representation is used to store the model weights. However, we quantize the weight values to 8-bits per parameter using Bazel [46] which causes very little loss of accuracy in the result.
D. PERFORMANCE EVALUATION
The performance of the proposed DOA app is tested using Pixel 1 and Pixel 3 Android smartphones. 100 different estimations are stored with ground truth for each degree to evaluate the real-time operation of the proposed application. The phones are placed in the center of the table and the room dimension is 6.5×5.5×3 meters. The measured reverberation time is 350 milliseconds. There was a fan noise in the background when collecting the results. The accuracy results are used for evaluating performance results. We define a modified accuracy ( ACCmod ) measure which accepts DOA estimations correct if it is within ±20 of the actual angle.
Modified accuracy results for Pixel 1 and 3 can be seen in Table II. It is worth noting that our CNN model is trained using collected data with Pixel 1 but inferred on Pixel 3. We only see a 5% absolute degradation is accuracy. This means that our CNN model is rather robust to smartphone hardware mismatch, hence we may not need to retrain the entire model again for use with different smartphones.
TABLE II.
ACCURACY (ERROR < 20°) FOR REAL-TIME USING CNN MODEL TRAINED FOR GOOGLE PIXEL 1, BUT INFERENCED ON PIXEL 3
| Google Pixel 1 | 89% |
| Google Pixel 3 | 83% |
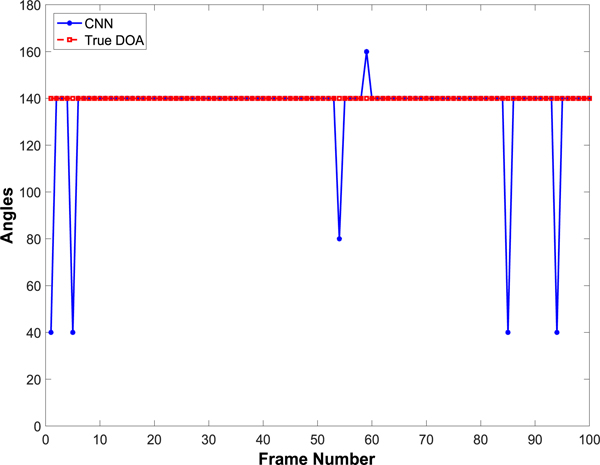
An illustration of the performance of the real-time CNN based DOA app is shown in Figure 8. 100 estimations of the DOA angle estimation app on the Pixel 1 can be seen in the figure. The speaker is located at 140° (angles can be seen in Figure 7) with respect to the Pixel 1, and we stored these 100 estimations. As it is seen in Figure 8, there are only 6 errors out of 100 estimations.
Fig. 8.
An illustration of the real-time CNN based DOA app performance on Pixel 1. Talker is fixed at 140◦.
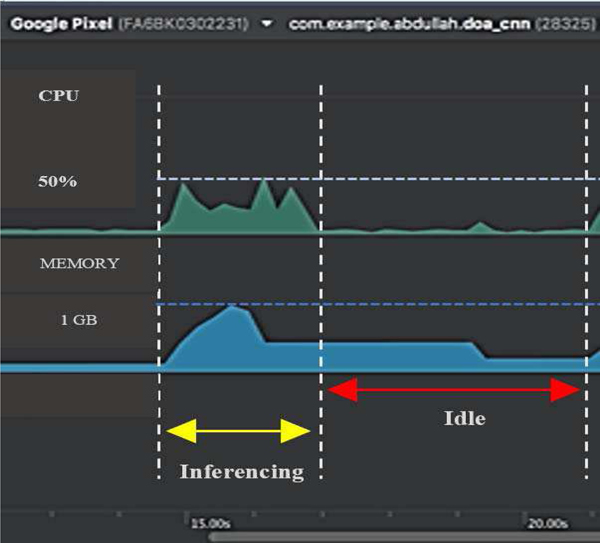
The last measurement is CPU and Memory usage of the proposed Android app is displayed in Figure 9. This snapshot in Figure 9 was taken on Pixel 1 when the ‘Wait Buffer’ size was 10. As it is seen from the figure, CPU and Memory consumption increases and decreases parallelly. The reason for this is ‘Wait Buffer’ and VAD. When ‘Wait Buffer’ size reaches ten frames, the image is formed and fed into the CNN. Then, the pre-trained model inferences as shown (in yellow arrows) in the figure. During this process, CPU and Memory usage reaches 40–44% and around 850MB, respectively. One reason for high usage is that the calculations are done using 10 frames. Another reason is TensorFlow API on Android utilizing Java which increases the CPU consumption. Although the consumptions are little more than expected, this situation is temporary. After the estimations were done, CPU consumption decreases to below 8% and memory usage reduces to less than 30 MB. The CNN based DOA app can run continuously on limited battery for over one hour without crashing of the app or any memory problems. Figure 9 clearly shows that the proposed app perfectly suits for real-time applications. If we want to implement the proposed method on hearing aid, extra CPU and battery are required. Since smartphones have a powerful CPU and long battery life, we can efficiently implement deep learning-based approaches for hearing aid applications.
Fig. 9.
Screenshot of CPU and Memory consumption of Proposed Method on Pixel 1
VII. CONCLUSION
This paper presented a convolutional neural network (CNN) based DOA angle estimation method and its real-time implementation on Android-based smartphone for hearing improvement. The system pipeline and CNN architecture were optimized for getting high accuracy and decreasing the computational complexity. The model was trained using real data recorded by the smartphone which enabled the model to implicitly compensate for gain mismatch of the two built-in microphones of the smartphone in the training phase. The proposed method was compared with the recent deep learning based DOA methods and its superior performance was shown. The proposed app accuracy and error performance were also evaluated. CPU and memory consumption of the app running on the smartphone were evaluated. As per the results of our experiments, the proposed smartphone-based DOA app suits the real-life scenarios for hearing aid applications very well.
Acknowledgments
This work was supported by the National Institute of the Deafness and Other Communication Disorders (NIDCD) of the National Institutes of Health (NIH) under Award 1R01DC015430–04. The content is solely the responsibility of the authors and does not necessarily represent the official views of the NIH. This work was done by the authors while they were part of the Department of Electrical and Computer Engineering, The University of Texas at Dallas.
REFERENCES
- [1].Lindemann E, “Two microphone nonlinear frequency domain beamformer for hearing aid noise reduction,” Proceedings of 1995 Workshop on Applications of Signal Processing to Audio and Acoustics, New Paltz, NY, 1995, pp. 24–27. [Google Scholar]
- [2].Brandstein M, Wards D (eds.), Microphone Arrays—Signal Processing Techniques and Applications (Springer, Berlin, 2001) [Google Scholar]
- [3].Benesty J, Chen J, Huang Y, Microphone Array Signal Processing, vol. 1 (Springer Science & Business Media, 2008) [Google Scholar]
- [4].Tashev IJ, Sound Capture and Processing: Practical Approaches Wiley; 2009. [Google Scholar]
- [5].Brandstein MS, and Griebel SM. “Nonlinear, model-based microphone array speech enhancement” Acoustic signal processing for telecommunication. Springer US, 2000. 261–279. [Google Scholar]
- [6].McCowan IA, Pelecanos J, and Sridharan S. “Robust speaker recognition using microphone arrays.” 2001: A Speaker Odyssey-The Speaker Recognition Workshop 2001. [Google Scholar]
- [7].Seltzer ML, Microphone array processing for robust speech recognition. Diss. Carnegie Mellon University Pittsburgh, PA, 2003. [Google Scholar]
- [8].Ding I, and Shi J. “Kinect microphone array-based speech and speaker recognition for the exhibition control of humanoid robots.” Computers & Electrical Engineering (2016). [Google Scholar]
- [9].Bhat GS, Shankar N, Reddy CKA and Panahi IMS, “A Real-Time Convolutional Neural Network Based Speech Enhancement for Hearing Impaired Listeners Using Smartphone,” in IEEE Access, vol. 7, pp. 78421–78433, 2019. [DOI] [PMC free article] [PubMed] [Google Scholar]
- [10].Widrow B, and Luo F. “Microphone arrays for hearing aids: An overview.” Speech Communication 39.1 (2003): 139–146. [Google Scholar]
- [11].Byrne D, and Noble W. “Optimizing sound localization with hearing aids.” Trends in Amplification 3.2 (1998): 51–73. [DOI] [PMC free article] [PubMed] [Google Scholar]
- [12].Noble W, Byrne D, Lepage B, “Effects on sound localization of configuration and type of hearing impairment.”,Journal of Acoust Soc Am. 1994. February; 95(2):992–1005 [DOI] [PubMed] [Google Scholar]
- [13].Ganguly A, Küçük A and Panahi I, “ Real-time Smartphone implementation of noise-robust Speech source localization algorithm for hearing aid users,” Proc. Mtgs. Acoust. 30, 055001 (2017). [Google Scholar]
- [14].Ganguly A, Küçük A and Panahi I, “Real-time Smartphone application for improving spatial awareness of Hearing Assistive Devices,” 2018 40th Annual International Conference of the IEEE Engineering in Medicine and Biology Society (EMBC), Honolulu, HI, USA, 2018, pp. 433–436. [DOI] [PubMed] [Google Scholar]
- [15].Shankar N, Küçük A, Reddy CKA, Bhat GS and Panahi IMS, “Influence of MVDR beamformer on a Speech Enhancement based Smartphone application for Hearing Aids,” 2018 40th Annual International Conference of the IEEE Engineering in Medicine and Biology Society (EMBC), Honolulu, HI, USA, 2018, pp. 417–420. [DOI] [PMC free article] [PubMed] [Google Scholar]
- [16].Bhat GS, Reddy CKA, Shankar Nikhil and Panahi IMS, “Smartphone based real-time super Gaussian single microphone Speech Enhancement to improve intelligibility for hearing aid users using formant information,” 2018 40th Annual International Conference of the IEEE Engineering in Medicine and Biology Society (EMBC), Honolulu, HI, USA, 2018, pp. 5503–5506. [DOI] [PMC free article] [PubMed] [Google Scholar]
- [17].Karadagur Ananda Reddy C, Shankar N, Shreedhar Bhat G, Charan R and Panahi I, “An Individualized Super-Gaussian Single Microphone Speech Enhancement for Hearing Aid Users With Smartphone as an Assistive Device,” in IEEE Signal Processing Letters, vol. 24, no. 11, pp. 1601–1605, November 2017. [DOI] [PMC free article] [PubMed] [Google Scholar]
- [18].Hao Y, Charan MCR, Bhat GS and Panahi IMS, “Robust real-time sound pressure level stabilizer for multi-channel hearing aids compression for dynamically changing acoustic environment,” 2017 51st Asilomar Conference on Signals, Systems, and Computers, Pacific Grove, CA, 2017, pp. 1952–1955. [Google Scholar]
- [19].Zou Z, Hao Y and Panahi I, “Design of Compensated Multi-Channel Dynamic-Range Compressor for Hearing Aid Devices using Polyphase Implementation,” 2018 40th Annual International Conference of the IEEE Engineering in Medicine and Biology Society (EMBC), Honolulu, HI, USA, 2018, pp. 429–432. [DOI] [PubMed] [Google Scholar]
- [20].Mishra P, Tokgöz S and Panahi IMS, “Efficient Modeling of Acoustic Feedback Path in Hearing Aids by Voice Activity Detector-Supervised Multiple Noise Injections,” 2018 40th Annual International Conference of the IEEE Engineering in Medicine and Biology Society (EMBC), Honolulu, HI, USA, 2018, pp. 3549–3552. [DOI] [PubMed] [Google Scholar]
- [21].Mishra P, Ganguly A, Küçük A and Panahi IMS, “Unsupervised noise-aware adaptive feedback cancellation for hearing aid devices under noisy speech framework,” 2017 IEEE Signal Processing in Medicine and Biology Symposium (SPMB), Philadelphia, PA, 2017, pp. 1–5. [Google Scholar]
- [22].‘Smartphone-Based Open Research Platform for Hearing Improvement Studies’, http://www.utdallas.edu/ssprl/hearing-aid-project/
- [23].Schmidt R, “Multiple emitter location and signal parameter estimation,” in IEEE Transactions on Antennas and Propagation, vol. 34, no. 3, pp. 276–280, March 1986. [Google Scholar]
- [24].Knapp C and Carter G, “The generalized correlation method for estimation of time delay,” in IEEE Transactions on Acoustics, Speech, and Signal Processing, vol. 24, no. 4, pp. 320–327, August 1976. [Google Scholar]
- [25].Brandstein MS and Silverman HF, “A robust method for speech signal time-delay estimation in reverberant rooms,” 1997 IEEE International Conference on Acoustics, Speech, and Signal Processing, Munich, 1997, pp. 375–378 vol.1. [Google Scholar]
- [26].Krizhevsky A, Sutskever I, and Hinton GE, “ImageNet Classification with Deep Convolutional Neural Networks” in Advances in Neural Information Processing System 25: 26th Annual Conference on Neural Information Processing Systems, 2012, pp. 1106–1114. [Google Scholar]
- [27].Hinton G et al. , “Deep Neural Networks for Acoustic Modeling in Speech Recognition: The Shared Views of Four Research Groups,” in IEEE Signal Processing Magazine, vol. 29, no. 6, pp. 82–97, November 2012. [Google Scholar]
- [28].Kounovsky T and Malek J, “Single channel speech enhancement using convolutional neural network,” 2017 IEEE International Workshop of Electronics, Control, Measurement, Signals and their Application to Mechatronics (ECMSM), Donostia-San Sebastian, 2017, pp. 1–5. [Google Scholar]
- [29].Xiao X, Zhao S, Zhong X, Jones DL, Chng ES and Li H, “A learning-based approach to direction of arrival estimation in noisy and reverberant environments,” 2015 IEEE International Conference on Acoustics, Speech and Signal Processing (ICASSP), Brisbane, QLD, 2015, pp. 2814–2818. [Google Scholar]
- [30].Chakrabarty S and Habets EAP, “Broadband doa estimation using convolutional neural networks trained with noise signals,” 2017 IEEE Workshop on Applications of Signal Processing to Audio and Acoustics (WASPAA), New Paltz, NY, 2017, pp. 136–140. [Google Scholar]
- [31].Vecchiotti P, Ma N, Squartini S and Brown GJ, “End-to-end Binaural Sound Localisation from the Raw Waveform,” ICASSP 2019 – 2019 IEEE International Conference on Acoustics, Speech and Signal Processing (ICASSP), Brighton, United Kingdom, 2019, pp. 451–455. [Google Scholar]
- [32].Pertilä P and Parviainen M, “Time Difference of Arrival Estimation of Speech Signals Using Deep Neural Networks with Integrated Time-frequency Masking,” ICASSP 2019 – 2019 IEEE International Conference on Acoustics, Speech and Signal Processing (ICASSP), Brighton, United Kingdom, 2019, pp. 436–440. [Google Scholar]
- [33].Pak J and Shin JW, “Sound Localization Based on Phase Difference Enhancement Using Deep Neural Networks,” in IEEE/ACM Transactions on Audio, Speech, and Language Processing, vol. 27, no. 8, pp. 1335–1345, August 2019. [Google Scholar]
- [34].Pertilä P and Cakir E, “Robust direction estimation with convolutional neural networks based steered response power,” 2017 IEEE International Conference on Acoustics, Speech and Signal Processing (ICASSP), New Orleans, LA, 2017, pp. 6125–6129. [Google Scholar]
- [35].Salvati D, Drioli C and Foresti GL, “Exploiting CNNs for Improving Acoustic Source Localization in Noisy and Reverberant Conditions,” in IEEE Transactions on Emerging Topics in Computational Intelligence, vol. 2, no. 2, pp. 103–116, April 2018. [Google Scholar]
- [36].Takeda R and Komatani K, “Sound source localization based on deep neural networks with directional activate function exploiting phase information,” 2016 IEEE International Conference on Acoustics, Speech and Signal Processing (ICASSP), Shanghai, 2016, pp. 405–409. [Google Scholar]
- [37].Sun Y, Chen J, Yuen C and Rahardja S, “Indoor Sound Source Localization With Probabilistic Neural Network,” in IEEE Transactions on Industrial Electronics, vol. 65, no. 8, pp. 6403–6413, August 2018. [Google Scholar]
- [38].Nair V and Hinton GE, “Rectified linear units improve restricted boltzmann machines,” in Proceedings of the 27th international conference on machine learning (ICML-10), 2010, pp. 807–814. [Google Scholar]
- [39].Nilsson M, Soli SD, and Sullivan JA. “Development of the Hearing in Noise Test for the measurement of speech reception thresholds in quiet and in noise.” The Journal of the Acoustical Society of America 95.2 (1994): 1085–1099. [DOI] [PubMed] [Google Scholar]
- [40].Garofolo JS, et al. TIMIT Acoustic-Phonetic Continuous Speech Corpus LDC93S1 Web Download. Philadelphia: Linguistic Data Consortium, 1993. [Google Scholar]
- [41].Lehmann EA, and Johansson AM. “Diffuse reverberation model for efficient image-source simulation of room impulse responses.” IEEE Transactions on Audio, Speech, and Language Processing 18.6 (2010): 1429–1439. [Google Scholar]
- [42].‘Acoustical liberation of books in the public domain’, https://librivox.org/
- [43].Mesaros A, Heittola T, and Virtanen T (January 1,2017). TUT Acoustic Scenes 2017, Development Dataset. Online Available: https://zenodo.org/record/400515 [Google Scholar]
- [44].Milani AA, Kannan G, Panahi IMS and Briggs R, “A multichannel speech enhancement method for functional MRI systems using a distributed microphone array,” 2009 Annual International Conference of the IEEE Engineering in Medicine and Biology Society, Minneapolis, MN, 2009, pp. 6946–6949. [DOI] [PubMed] [Google Scholar]
- [45].Google.(2019), TensorFlow. [Online]. Available: https://www.tensorflow.org/
- [46].Online Available: https://bazel.build/


