

Abstract
The SARS-CoV-2 pandemic has resulted in millions of infections, yet the role of host immune responses in early COVID-19 pathogenesis remains unclear. By investigating 17 acute and 24 convalescent patients, we found that acute SARS-CoV-2 infection resulted in broad immune cell reduction including T, natural killer, monocyte, and dendritic cells (DCs). DCs were significantly reduced with functional impairment, and ratios of conventional DCs to plasmacytoid DCs were increased among acute severe patients. Besides lymphocytopenia, although neutralizing antibodies were rapidly and abundantly generated in patients, there were delayed receptor binding domain (RBD)- and nucleocapsid protein (NP)-specific T cell responses during the first 3 weeks after symptoms onset. Moreover, acute RBD- and NP-specific T cell responses included relatively more CD4 T cells than CD8 T cells. Our findings provided evidence that impaired DCs, together with timely inverted strong antibody but weak CD8 T cell responses, could contribute to acute COVID-19 pathogenesis and have implications for vaccine development.
Keywords: SARS-CoV-2, COVID-19, acute infection, convalescent, dendritic cell, receptor-binding domain, nucleocapsid protein, neutralizing antibody, T cell immune response
Graphical Abstract
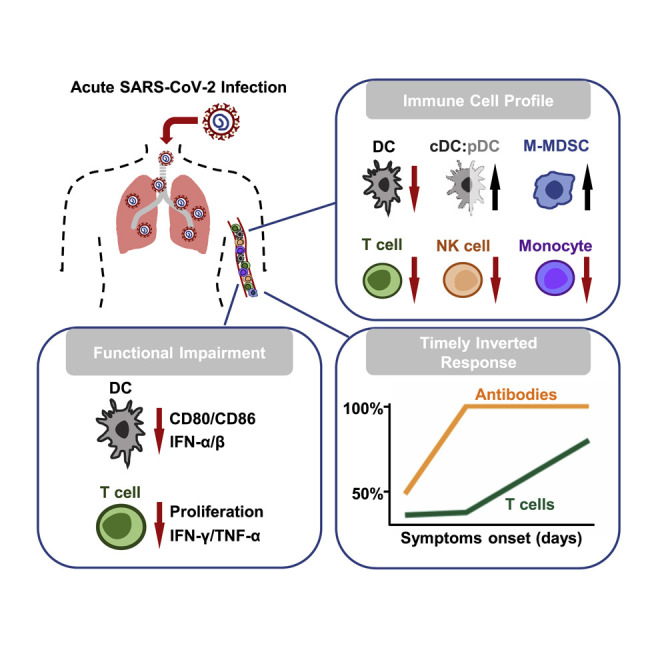
COVID-19 is an acute disease caused by SARS-CoV-2 infection. We determine how the immune system responds to SARS-CoV-2 at both acute and convalescent stages. Acute SARS-CoV-2 infection results in broad immune cell reduction and functional impairment. While neutralizing antibodies are rapidly generated, antigen-specific T cells are delayed at the acute stage.
Introduction
In December 2019, the coronavirus disease 2019 (COVID-19) outbreak was discovered among a group of pneumonia patients mainly associated with a seafood market in Wuhan, China (Zhu et al., 2020). The pandemic was suspected to be zoonotic and to have originated from a novel beta-coronavirus (CoV) that is now officially named as SARS-CoV-2 (Chan et al., 2020c, Zhu et al., 2020). SARS-CoV-2 is similar to bat SARS-related coronaviruses with 96% genomic identity, but it is relatively distinct from SARS-CoV, with only 79.5% similarity (Chan et al., 2020c, Wu et al., 2020, Zhou et al., 2020). The rapid dissemination of SARS-CoV-2 was related to highly efficient person-to-person transmission in both hospital and community settings (Chan et al., 2020c, Wang et al., 2020a). SARS-CoV-2 has been spread globally by travelers, often through contact with asymptomatic carriers (Holshue et al., 2020; Rothe et al., 2020). Since then, COVID-19 has become a severe worldwide pandemic with over 15 million confirmed cases and around 617,000 deaths within 6 months. It remains unclear why host immune responses are insufficient in controlling early pathogenesis and the transmission of SARS-CoV-2. Therefore, it is crucial to dissect the immune mechanisms to promote the control of the pandemic and the development of an effective vaccine against COVID-19.
Several elegant studies demonstrated that SARS-CoV-2 and SARS-CoV use the same cellular entry receptor angiotensin-converting enzyme 2 (ACE2) to initiate infection, despite that only 40% amino acids are identical in the receptor binding domain (RBD) external subdomain (Chan et al., 2020a, Lan et al., 2020, Wan et al., 2020, Zhou et al., 2020). Because other coronaviruses also use ACE2 as the cellular receptor but have not caused any major outbreaks, it is suspected that other host factors besides ACE2 could contribute to the highly efficient zoonotic and person-to-person transmission of SARS-CoV-2 (Chen et al., 2020b; Huang et al., 2020). Currently, the mechanism underlying early immunopathogenesis of COVID-19 remains unclear and is yet to be fully determined.
It is known that host immune responses play a critical role in defending against viral infection and disease progression (Ho et al., 2005; Zhao et al., 2010). The reduced innate and adaptive immune responses can cause harm especially during the acute phase of infection (Ho et al., 2005). We previously demonstrated that spike (S)-specific antibodies, which even contain neutralizing antibodies (NAbs), could cause acute lung injury upon live SARS-CoV infection in both SARS patients and non-human primates (NHPs) (Liu et al., 2019; Zhang et al., 2006). Recently, COVID-19 patients with higher amounts of anti-nucleocapsid (NP) immunoglobulin (Ig)M and IgG after symptoms onset have been associated with poorer disease outcomes (Tan et al., 2020). In another study, higher amounts of anti-S and anti-NP IgG and IgM were correlated with worse clinical readouts and older age (Jiang et al., 2020). Besides humoral responses, T lymphocytopenia is inversely correlated with an increase of peripheral pro-inflammatory cytokines among COVID-19 patients (Chiappelli et al., 2020; Xu et al., 2020; Zheng et al., 2020). The low CD8+ T cell count has been suggested to be a predictor for high mortality and illness severity of COVID-19 pneumonia (Du et al., 2020; Xu et al., 2020). On the other hand, low CD4+ T cell count was independently associated with intensive care unit (ICU) admission (Chen et al., 2020a). These findings support a hypothesis that unbalanced adaptive immune responses could potentially have detrimental effects on acute COVID-19 patients. To address this hypothesis, although recent studies have focused on the importance of T cell immunity in convalescent patients (Grifoni et al., 2020; Ni et al., 2020), we sought to investigate the functionality of different innate and adaptive immune cells and the adaptive immune responses in both acute and convalescent patients. We found that SARS-CoV-2 rapidly impaired dendritic cell and T cell responses during the acute phase of infection, which could have significant implications for COVID-19 pathogenesis.
Results
Clinical Characteristics of COVID-19 Patients
Between February 10 and April 22, 2020, a total of 41 COVID-19 subjects, including 8 severe and 33 mild patients (24 female and 17 male), with sufficient blood samples were screened and recruited into our study (Table 1 ). Initially, 6 severe and 11 mild cases were recruited in the acute patient (AP) group (recruited during hospitalization), whereas 2 severe and 22 mild patients were included in the convalescent patient (CP) group (recruited at follow-up outpatient clinic). After hospital discharge, 5 AP subjects were subsequently recruited for experiments with CP subjects. When we analyzed patient profiles listed in Table 1, no significant differences were observed between AP and CP groups at the time of hospital admission (Table S1). We then divided our study subjects into mild and severe patient groups (Table 1). Oxygen supplementation were all required in the 8 considered as severe COVID-19 patients, whereas the rest of the 33 patients only presented mild symptoms. The median age of severe and mild patients was 59 years old (interquartile range 54–69) and 57 years old (interquartile range 33–63), respectively. Among the 41 patients, chronic comorbidities were more common among the severe group (6/8, 75%) than the mild group (9/33, 27%) (p = 0.035). The most common underlying diseases were hypertension in 8/41 (20%) and diabetes mellitus in 5/41 (12%) patients. Hypertension was significantly more frequent among severe than mild patients (4/8, 50% versus 4/33, 12.1%; p = 0.033), as was diabetes mellitus (3/8, 37.5% versus 2/33, 6.1%; p = 0.043). Regarding symptoms presentation, fever (23/41, 56%) was the most common, followed by cough (16/41, 39%), sore throat (6/41, 15%), and dyspnea (5/41, 12%) (Table 1). Dyspnea was significantly more frequent among severe than mild patients (3/8, 37.5% versus 2/33, 6.1%; p = 0.043). For blood tests performed at admission, lymphocyte counts in severe patients were significantly lower than those in mild patients (0.9 × 10⁹ cells/L [range 0.8–0.9] versus 1.2 [1.0–1.6]; p = 0.011). Similarly, severe patients had a significantly lower platelet count than did mild patients (150 × 109 cells/L [range 141–191] versus 236 [184–309]; p = 0.002). These results demonstrated that acute SARS-CoV-2 infection could lead to a more profound immune suppression in severe patients.
Table 1.
Clinical Characteristics of All Patients in this Study
| Characteristics | Severe (n = 8) | Mild (n = 33) | p Value |
|---|---|---|---|
| Demographic | |||
| Age, median years (interquartile range) | 59 (54.5–69.5) | 52 (33.5–63) | 0.137 |
| Female | 4 (50) | 20 (60.6) | 0.698 |
| Chronic Comorbidities | |||
| Hypertension | 4 (50) | 4 (12.1) | 0.033 |
| Chronic heart disease | 0 (0) | 1 (3.0) | 1.000 |
| Chronic lung disease | 0 (0) | 1 (3.0) | 1.000 |
| Chronic liver disease | 1 (12.5) | 1(21.5) | 0.195 |
| Chronic kidney disease | 0 (0) | 0 (0) | N/A |
| Diabetes mellitus | 3 (37.5) | 2 (6.1) | 0.043 |
| Any chronic comorbidities | 6 (75) | 9 (27.3) | 0.035 |
| Presenting Symptoms | |||
| Fever | 6 (75) | 17 (51.5) | 0.429 |
| Dyspnea | 3 (37.5) | 2 (6.1) | 0.043 |
| Cough | 5 (62.5) | 11 (33.3) | 0.225 |
| Rhinorrhea | 1 (12.5) | 3 (9.1) | 1.000 |
| Sore throat | 2 (25) | 4 (12.1) | 0.578 |
| Diarrhea | 2 (25) | 2 (6.1) | 0.165 |
| Blood Tests on Admission (Median, Interquartile Range) | |||
| Haemoglobin (g/dL) | 13.0 (12.5–14.6) | 13.5 (12.7–14.3) | 0.711 |
| Total white blood cell count (×109/L) | 5.0 (4.5–8.2) | 5.3 (4.4–7.4) | 0.885 |
| Neutrophil count (×109/L) | 3.8 (3.2–5.7) | 3.4 (2.2–5.2)a | 0.475 |
| Lymphocyte count (×109/L) | 0.9 (0.8–0.9) | 1.2 (1.0–1.6)a | 0.011 |
| Platelet count (×109/L) | 150 (141–191) | 236 (184–309) | 0.002 |
| Urea (mmol/L) | 4.4 (3.6–6.2) | 4.0 (3.3–4.9)a | 0.325 |
| Creatinine (μmol/L) | 77 (62–94) | 68 (56–86)a | 0.496 |
| Alanine aminotransferase (U/L) | 31 (27–59) | 23 (15–33)a | 0.065 |
| Severity | |||
| Oxygen supplementation | 8 (100) | 0 (0) | <0.001 |
Neutrophil count, lymphocyte count, urea, creatinine, and alanine aminotransferase available for 32 patients.
Acute SARS-CoV-2 Infection Results in Broad Reduction of Different Immune Cell Populations
By using 2 panels of antibodies for 12-color flow cytometry analysis (Table S2), we evaluated immune cell profiles of APs and CPs in comparison with those of healthy donors (HDs). Freshly isolated human peripheral blood mononuclear cells (PBMCs) were subjected to the flow cytometry analysis using gating strategies presented in Figures S1A and S2, except for 5 AP frozen samples. We observed significantly reduced frequencies of broad immune cell types, including T cell, natural killer (NK) cell, dendritic cell (DC), and classical monocyte in APs in comparison with frequencies seen in HDs (Figures 1A and 1B). These 5 AP frozen samples displayed slightly high percentages of T cells, which did not affect overall statistical analysis. In contrast, the frequency of monocytic myeloid-derived suppressive cells (M-MDSCs) was significantly higher in APs than that in HDs. Because the majority of AP samples (14/17) were tested within 3 weeks after symptoms onset (6 in 1–7 days, 5 in 8–14, 3 in 15–21, 3 in >21), our observation on immune cell profiling indicated that acute SARS-CoV-2 infection resulted in broad immune cell reduction during the early phase of infection. Of note, although many CPs had increased frequencies of lymphocytes including T and NK cells (Figure 1A), their frequencies of DCs and monocytes remained significantly lower than those of HDs (Figure 1B). These observations suggested that there was likely a broad suppression of monocyte and DC populations with shorter-term effect on NK and T cells in COVID-19 patients.
Figure 1.

Acute SARS-CoV-2 Infection Results in Broad Immune Cell Suppression
Fresh PBMCs were isolated from acute patients (APs), convalescent patients (CPs), and healthy donors (HDs).
(A) For analysis of lymphocyte subsets including T, B, and NK cells, samples of 17 APs and 25 CPs were collected at a median of 13 (range, 1–42 days) and 30 days (range, 21–54 days) after symptoms onset, respectively.
(B) For analysis of myeloid cells including DCs, CD14++CD16− monocytes, and M-MDSCs, samples of 17 APs and 29 CPs were collected at a median of 13 (range, 1–42 days) and 30 days (range, 21–54 days) after symptoms onset, respectively.
Twenty HDs were included as controls. Cells were stained with different markers of immune cell populations and were subjected to flow cytometry analysis. Cumulative data show the cell frequencies. Each symbol represents an individual donor with a line indicating the mean of each group. Severe patients in both the AP and CP groups were presented as black symbols. Statistics were generated by using one-way ANOVA followed by Tukey’s multiple comparisons test and Mann-Whitney test. ∗p < 0.05; ∗∗p < 0.01; ∗∗∗p < 0.001.
See also Figures S1A and S2A; Tables S1 and S2.
AP-Derived DCs Have Reduced Frequency and Functionality for Undergoing Maturation
DCs play a central role in both innate and adaptive immune responses. Moreover, plasmacytoid DCs (pDCs) comprise a subset of DCs characterized by their ability to produce large amount of antiviral type I interferon (IFN-I) (Fitzgerald-Bocarsly et al., 2008). We therefore further measured the proportion and functionality of conventional dendritic cell (cDC) and pDC subsets among total DCs derived from our AP and CP patients. The frequencies of CD11c+ cDCs in total DCs showed increases in the CP group (Figure 2 A, top panel; Figure S2A). Moreover, there were significant increases of the cDC:pDC ratios in the AP group in comparison with those in the HD and CP groups. We then compared DC surface markers (HLA-DR, CD86, and CCR2) and functionality among our study subjects. The expression amount of the co-stimulatory molecule CD86 was significantly lower in both APs and CPs than that in HDs (Figure 2A, bottom panel), whereas there were no differences for HLA-DR or CCR2. These results indicated that patient-derived DCs might reduce their functionality of maturation. To test this hypothesis, we then measured the effect of a cocktail of maturation cytokines (interleukin [IL]-1β, IL-6, tumor necrosis factor alpha [TNF-α], and PGE2) on patient-derived cDCs isolated from 3 APs and 4 CPs based on the availability of samples. The results of real-time reverse-transcriptase (RT)-PCR showed that there are no significant differences in receptor expression of IL-6 (IL-6R), TNF-α (TNFR1/2), and PGE2 (EP2) between HD and COVID-19 patients (data not shown). The maturation cytokine cocktail was added to stimulate freshly isolated DCs for 24 h, after which the expression levels of the maturation markers on cDCs (CD11c+) were determined by flow cytometry using the DC maturation panel of antibodies (Figure S2B; Table S2). The maturation stimuli significantly upregulated the co-stimulatory molecules CD80 and CD86 in all HDs (Figure 2B, top panel) but not CD83, CCR7, HLA-ABC, and HLA-DR molecules (data not shown). The increase in DC maturation, however, was not significant in 3/3 APs and 1/4 CPs. In these DC cultures, IFN-α was not induced in 3/3 APs and 3/4 CPs, and IFN-β was not significantly increased in 3/3 APs, rather only slightly elevated in 3/4 CPs (Figure 2B, bottom panel), indicating a reduced capacity of making antiviral interferon, especially among APs. In addition, significantly less expressions of CD80, CD86, CCR7, and HLA-DR were induced in all 3 subsets of peripheral dendritic cells (pDCs, cDC1, and cDC2) in 3/3s AP after stimulation with TLR3, 4, 7, or 8 ligands in comparison with HDs (Figure S3). We next conducted the mixed lymphocyte reaction assay (MLR) to further determine the functionality of patient-derived DCs to induce proliferation of allogeneic CD4 and CD8 T cells at both immature and maturation stages (Jongbloed et al., 2010). Although HD- and CP-derived DCs were able to stimulate CD4 and CD8 T cell proliferation, none of the AP-derived DCs displayed similar activity (Figure 2C). These results demonstrated that DCs derived from APs are functionally impaired for maturation and T cell activation and thereby likely reduce the induction of adaptive T cell responses against SARS-CoV-2.
Figure 2.

DCs Derived from Acute Patients Have Reduced Maturation Potential
(A) Flow cytometry analysis was used to define frequencies of CD11c+ cDC and CD123+ pDC in total blood DCs and the ratio of cDC:pDC. Samples of 17 APs and 29 CPs were collected at a median of 13 (range, 1–42 days) and 30 days (range, 21–54 days) after symptoms onset, respectively. Twenty HDs were included as controls. The expression of HLA-DR, CD86, and CCR2 on cDCs was analyzed by using the mean fluorescence intensity (MFI). Samples of 17 APs and 24 CPs were collected at a median of 13 (range, 1–42 days) and 30 days (range, 21–54 days) after symptoms onset, respectively. Severe patients in the AP and CP groups were presented as black symbols.
(B) The expression of CD80 and CD86 on CD11c+ cDC was determined by using the MFI by flow cytometry analysis. Enriched DCs of 3 APs (purple line, 2 severe and 1 mild patients) and 4 mild CPs (blue line) were obtained from samples collected at a median of 11 (range, 1–13 days) and 25 days (range, 21–47 days) after symptoms onset, respectively. DCs were stimulated with the proinflammatory cytokine cocktail (stimuli) for 24 h before the analysis. Seven HDs (black line) were included as controls. Secreted levels of IFN-α and IFN-β were determined by the bead-based cytokine assays.
(C) Enriched DCs derived from the same set of samples in (B) were stimulated with or without the stimuli for 24 h, followed by γ-irradiation and then co-cultured with CFSE-labeled allogeneic T cells from a HD for 5 days. Proliferation of CD4 and CD8 T cells was determined by the percentage of CFSE low using flow cytometry. Each symbol represents an individual donor. Error bars indicate standard deviation. Statistics were generated by using one-way ANOVA followed by Tukey’s multiple comparisons test Mann-Whitney test and 2-tailed Student’s t test. ∗p < 0.05; ∗∗p < 0.01; ∗∗∗p < 0.001.
See also Figures S2 and S3; Tables S1 and S2.
AP-Derived Peripheral CD4 and CD8 T Cells Display Reduced Functionality
Antigen-specific T cells are responsible for SARS-CoV clearance and host survival (Zhao et al., 2010). Because acute SARS-CoV-2 infection resulted in T lymphocytopenia, we sought to determine the phenotype and functionality of patient-derived CD4 and CD8 T cells. Phenotypic analysis by measuring Ki67 expression showed that T lymphocytopenia was likely associated with the significant reduction of CD4 T cell proliferation (Figure 3 A; Figure S1B). Evaluating CD38 and HLA-DR expression during acute infection also associated T lymphocytopenia with elevated activation of CD8 T cells (Figure 3A; Figure S1A). However, the frequency of total percentage of T cells was positively correlated with only Ki67+ CD4 T cells among APs but not with activated CD38+HLA-DR+ CD8 T cells (Figure S4). Interestingly, most AP and CP patients’ CD4 T but not CD8 T cells expressed higher amount of PD-1 than those of HDs, indicating a state of CD4 activation or possible exhaustion. We then performed ex vivo experiments to measure T cell proliferation in 6 APs and 6 CPs through T cell receptor (TCR) activation by anti-CD3 and anti-CD28 antibodies in comparison with HDs. AP-derived CD4 and CD8 T cells showed significantly reduced frequencies of CSFE low cells (Figure 3B, top panel) and lower capacity for producing IFN-γ and IL-2 (Figure 3B, bottom panel). Furthermore, performing polyclonal stimulation with PMA/Ionomycin revealed that both central memory (CM) and effector memory (EM) CD4 T cells have significantly reduced polyfunctionality for releasing both IFN-γ and TNF-α in 6 APs in comparison with those of CPs and HDs (Figure 3C, middle panel). Similarly, EM and CD45RA+ effector (EMRA) CD8 T cells also showed reduced polyfunctionality for releasing both IFN-γ and TNF-α in 6 APs in comparison with those of CPs and HDs (Figure 3C, bottom panel). In addition, in the absence of any stimulation, EM and EMRA CD8 T cells of 6/6 APs also displayed significantly reduced cytotoxic potential for expressing granzyme B and perforin (Figure 3D). These findings demonstrated that acute SARS-CoV-2 infection has led to functional impairment in both CD4 and CD8 T cell subsets in AP patients.
Figure 3.

Peripheral T Cells Display Functional Loss during Acute SARS-CoV-2 Infection
(A) Frequencies of Ki67+ cells on CD4 and CD8 T cells were determined by flow cytometry. Fresh PBMCs from 13 APs and 9 CPs were collected at a median of 9 (range, 1–20 days) and 31 days (range, 23–54 days) after symptoms onset, respectively. Frequencies of CD38+HLA-DR+ and PD-1+ cells on CD4 T cells (left) and CD8 T cells (right) were also determined by flow cytometry. Samples of 17 APs and 20 CPs were collected at a median of 13 (range, 1–42 days) and 29.5 days (range, 21–54 days) after symptoms onset, respectively. Samples of 17 HDs were included as controls. Severe patients in the AP and CP groups were presented as black symbols.
(B) Proliferation ability of T cells from COVID-19 patients was determined by flow cytometry. Fresh PBMCs from 6 APs (1 severe and 5 mild patients) and 6 mild CPs were obtained at a median of 12 (range, 2–25 days) and 32 days (range, 23–39 days) after symptoms onset, respectively. PBMCs were labeled with CFSE and then were cultured in the presence or absences of anti-CD3 and anti-CD28 mAbs for 3 days before the flow cytometry. PBMCs of 6 HDs were included as controls. Representative histograms (top left) and quantified results (top right) depict the CFSE profiles of CD4 and CD8 T cells, respectively. The presence of IFN-γ, TNF-α, and IL-2 in culture supernatants after anti-CD3/CD28 stimulation was also quantified by using the bead-based cytokine assays (bottom).
(C) T cell responses to non-specific stimulation. Fresh PBMCs (same samples from Figure 3B) were stimulated with PMA/Ionomycin activation cocktail in the presence of brefeldin A (BFA) for 6 h. Expression of IFN-γ and TNF-α in T cells were determined by intracellular cytokine staining analysis. Representative plots showing IFN-γ and TNF-α expression in CD4 and CD8 T cells (top). Frequencies of IFN-γ+ and TNF-α+ cells were gated on CD45RA− CCR7+ CM and CD45RA−CCR7− EM CD4 T cells (middle), as well as on EM and CD45RA+CCR7− (CD45RA+ effector memory, EMRA) CD8 T cells (bottom).
(D) Expression of granzyme B and perforin in unstimulated EM and EMRA CD8 T cells (same samples from Figure 3B) was determined by intracellular staining. Representative plots (top) and quantified results (bottom) are shown. Each symbol represents an individual donor. Error bars indicate standard deviation. Statistics were generated by using one-way ANOVA followed by Tukey’s multiple comparisons test, Mann-Whitney test, and 2-tailed Student’s t test. ∗p < 0.05; ∗∗p < 0.01; ∗∗∗<0.001.
See also Figures S1 and S4; Tables S1 and S2.
Impact of Disease Severity on AP-Derived Immune Cells
To further evaluate the impact of disease severity on patients’ immune cell profiles at the acute stage of SARS-CoV-2 infection, we divided the AP group into mild and severe patients for comparison. Interestingly, the frequency of M-MDSCs was significantly higher in severe patients than that in mild ones (Figure 4 A). There were no significant differences for other immune cell types including T, B, NK cells, DC, and monocytes between mild and severe patients. Moreover, there were no significant differences for expression of Ki67, PD-1, and CD38+HLA-DR in both CD4 and CD8 T cells (Figure S5). When DC subsets were further analyzed, however, there was a significant increase of the cDC:pDC ratio in severe patients in comparison with mild ones (Figure 4B, top panel), although significant differences were not found for the frequencies of cDC and pDC. In addition, there were no significant differences in HLA-DR, CD86, and CCR2 expression of cDC between mild and severe patients (Figure 4B, bottom panel). These findings suggested that acute SARS-CoV-2 infection results in more significant changes in cDC:pDC ratios and the increase of M-MDSCs among severe patients. High cDC:pDC ratios of about 50-fold could serve as a potential biomarker of severe sickness.
Figure 4.

Impact of Disease Severity on AP-Derived Immune Cells
Samples of 11 mild and 6 severe APs (same as Figures 1 and 2) were collected at a median of 9 (range, 3–23 days) and 15 days (range, 1–54 days) after symptoms onset, respectively.
(A) The frequencies of lymphocyte subsets (T, B, and NK cells) and myeloid cells (DCs, CD14++CD16− monocytes, and M-MDSCs) were analyzed by flow cytometry.
(B) Frequencies of CD11c+ cDC and CD123+ pDC in total blood DCs and the cDC:pDC ratios were determined by flow cytometry. The expression of HLA-DR, CD86, and CCR2 on cDCs was analyzed by using the MFI. Each symbol represents an individual donor with a line indicating the mean of each group. Statistics were generated by using 2-tailed Student’s t test. ∗p < 0.05; ∗∗p < 0.01.
Timely Inverted RBD-Specific Antibody and T Cell Responses in APs
Upon viral entry, earlier development of antigen-specific T cells and subsequent production of NAbs are classical adaptive immune responses for effective control of infection and elimination of pathogens (Chaplin, 2010). To further study specific immunity in APs, we developed ELISA and pseudovirus-based neutralization assays to measure antibody responses, as well as ELISPOT to measure cell-mediated immune responses. In the first week after symptoms onset, specific RBD IgG responses were found in 4/7 mild APs (P2, P3, P4, and P7) by ELISA. Three of them developed high NAb titers but low NP-specific T cell responses, whereas only 2 of them had weak RBD-specific T cells (Figure 5 A). Only P4 had NP-specific T cells with >500 spots/million PBMCs. In the second week after symptoms onset, 8/8 APs, including 4 mild and 4 severe cases, developed both RBD IgG and NAb responses. Importantly, however, 4/4 severe patients (P8, P10, P11, and P13) did not develop measurable T cell responses against NPs or RBDs. In contrast, 2 mild followed-up cases P3 and P4 displayed increased NP- but not RBD-specific T cells, whereas P3 developed NAb response at this stage. Another mild case, P12, had RBD IgG and NAb responses but weak NP- and RBD-specific T cell responses (<100 spots/million PBMCs). In the third week and beyond, 4 APs were newly recruited including 2 severe cases (P16 and P17) and 2 mild cases (P14 and P15), whereas the rest were followed-up patients. During this stage, all APs had RBD IgG and NAb responses. Most APs also developed increased NP-specific T cell responses except for the mild P14 and the severe P16 who did not have measurable T cell responses against NPs and RBDs. Notably, 3/5 followed-up patients including P7, P8, and P10 developed RBD-specific but weak T cell responses. Our results, therefore, demonstrated that the overall frequencies of RBD IgG and NAb responses in APs reached 100% (8/8) by the second week after symptom onset, whereas only 50% (4/8) and 25% (2/8) were found for NP- and RBD-specific T cell responses, respectively (Figure 5B, left). When the AP group was divided to compare mild versus severe cases, 4/4 and 2/4 mild APs had NP- and RBD-specific T cell responses, respectively (Figure 5B, middle). In contrast, none of the 4/4 severe APs developed NP- and RBD-specific T cell responses at this stage (Figure 5B, right), indicating that delayed cell-mediated immune responses could contribute to acute COVID-19 pathogenesis.
Figure 5.

Timely Inverted RBD-Specific Antibody and T Cell Responses during Acute Infection
(A) Nab responses, shown as IC50, of 17 APs were measured by a pseudovirus-based assay. Endpoint titers of RBD IgG in plasma of each patient were measured by ELISA. Antigen-specific T cell responses toward the RBD peptide pool and NP protein were determined by the IFN-γ ELISPOT assays. Patient IDs highlighted in bold represent severe patients.
(B) Percentages of patients with positive RBD IgG, NAb, NP ELISPOT, and RBD ELISPOT responses in each week after symptoms onset according to results in (A). “NA” means that samples were not available.
(C) Kinetics of viral loads, anti-RBD IgG, NAb, and T cell responses against RBD peptide pool and NP protein were presented by weeks. Each symbol represents an individual subject. The mean values of individual groups are indicated by bars. Undetectable viral titers and immune responses were set as 1 Log10. “NA” means that samples were not available. Severe patients were labeled by black symbols.
(D) Comparisons of titers of anti-RBD IgG, NAb, T cell responses against RBD peptide pool, and NP protein between mild and severe acute patients with either undetectable (neg) or positive (pos) viral loads. Severe patients were labeled by black symbols. Negative response was set as 1 Log10. Each symbol represents an individual subject, and the mean values of each group are shown by bars. Statistics were generated by using 2-tailed Student’s t test. ∗p < 0.05.
See also Figures S6 and S7; Tables S1 and S3.
To understand the possible immune responses that are associated with viral clearance, we labeled each severe AP with a black symbol for kinetic analysis (Figure 5C). In week 2 after symptoms onset, although 4/4 mild and 4/4 severe AP developed comparable amounts of RBD IgG and NAb responses, 1/4 mild and 3/4 severe cases still had viral loads (>105 copies/mL). At the same time, 4/4 mild and 0/4 severe APs had NP ELISPOT responses. Moreover, significantly higher numbers of NP ELISPOT responses were found in APs without detectable viral loads than in those with measurable viral loads (Figure 5D). Improved immune responses over time were observed when we plotted 4 AP patients (2 mild and 2 severe) who had multiple samples collected consecutively (Figure S6). These results implicated that NP-specific T cells are likely needed for reducing disease severity and viral control during acute infection.
Higher Frequencies of Effector Memory CD4 than CD8 T Cell Responses against NPs and RBDs
We lastly evaluated antibody and T cell responses in 23 CPs at a median of 30 days after symptoms onset (range, 21–54 days). All CPs (100%, 23/23) developed both anti-RBD IgG and NAbs, whereas 61% (14/23) and 83% (19/23) of them developed RBD- and NP-specific T cell responses, respectively (Figure 6 A). Moreover, when RBD peptide pool and RBD protein were compared by using the same ELISPOT, consistent responses were observed with a significantly positive correlation (Figure S7). Based on availability of isolated cells, we also determined specific T cell responses in CD4 and CD8 subsets by intracellular cytokine staining (ICS) in 3 APs and 13 CPs. Significantly higher frequencies of T cell responses were found in CD4 than in CD8 T cells against both RBDs and NPs (Figure 6B). Moreover, consistent with the ELISPOT results, the frequencies of NP-specific T cell responses were higher than RBD-specific T cell responses, which is similar to a recent study of CP subjects (Ni et al., 2020). Interestingly, the majority of NP- and RBD-specific CD4 T cells tended to have an EM phenotype (Figure 6C). NP- and RBD-specific but weaker CD8 T cells also exhibited the EM phenotype (Figure S8A). When all 51 samples from 17 APs and 23 CPs were analyzed together, there was a strong positive correlation between RBD IgG and NAb responses (Figure S8B) as well as between RBD-specific T cell response and NAb titer (Figure S8C). The development of NAbs, therefore, could still be correlated with the induction of RBD-specific T cell responses. In contrast, the correlation between NP RBD-specific T cell response and NAb titer did not reach statistical significance (Figure S8D). Our results indicated that timely inverted strong antibody but weak CD8 T cell responses might be immune features of acute SARS-CoV-2 infection.
Figure 6.

Antibody and T Cell Response Profiles of Convalescent Patients
(A) The NAb IC50 of 23 convalescent patients was measured by the pseudovirus-based assay, and the endpoint titer of RBD IgG in plasma of each patient was measured by ELISA. Antigen-specific T cell responses toward the RBD peptide pool and NP protein were determined by IFN-γ ELISPOT respectively. Patient ID highlighted in bold represents severe patients.
(B) PBMCs from 3 APs and 13 CPs were subjected to the ICS assay against RBD peptide pool and NP protein. IFN-γ+ cells were gated on CD4 and CD8 T cells, respectively. Representative dot plots (left) and quantified results (right) depict the percentage of IFN-γ+ cells. Each symbol represents an individual donor with a line indicating the mean of each group.
(C) Phenotypes of RBD and NP-specific CD4 T cells were defined by using CD45RA and CCR7 markers (left). Averaged frequencies of each subset of IFN-γ+ cells were shown (right). Statistics were generated by using 2-tailed Student’s t test. ∗p < 0.05.
See also Figures S7 and S8; Tables S1 and S3.
Discussion
Rapid loss of DC function could lead to delayed T cell immune responses in COVID-19 patients. DCs play an important role in bridging innate and adaptive immunity. Neither DCs nor macrophages are permissive for SARS-CoV replication (Tseng et al., 2005). The infection was abortive because there was no increase in viral RNA and viral titer. Infected DCs neither produced anti-viral cytokines nor matured to perform direct antigen presentation to activate T cells (Law et al., 2005). In NHPs, we showed that mucosal monocytes/macrophages sequestered SARS-CoV virions in intracellular vesicles together with infected Langerhans cells (Liu et al., 2016). They then migrated into the tonsils and/or draining lymph nodes, all within 2 days of infection. In lymphoid tissues, viral RNA and proteins were detected in infected monocytes upon differentiation into DCs within 3 days. Therefore, spatiotemporal interactions of SARS-CoV, monocytes/macrophages, and the DC network in mucosal tissues provide a mechanism for the virus to escape host mucosal innate immunity and disseminate systemically (Liu et al., 2016). Among SARS patients, the frequency of peripheral DC subsets significantly dropped after symptoms onset, mainly attributed to a large dose of steroid administration (Zhang et al., 2004). In this study, although few of our acute COVID-19 patients received even low-dose steroid treatment, the frequency and functionality of peripheral DC subsets still significantly and rapidly reduced upon symptoms onset. On the one hand, pDC is the major potent IFN-I producer upon viral infection. Therefore, the significant loss of pDC together with NK cell reduction among severe cases could lead to immediate abolishment of innate immunity against SARS-CoV-2 infection. To this end, SARS-CoV-2 significantly suppressed the host innate immune response in ex vivo human lung tissue explant in comparison with 2003 SARS-CoV (Chu et al., 2020). These implicated the significant efficacy of our early IFN-β-1b cocktail treatment (Hung et al., 2020). Our results also suggested that a high ratio of cDC:pDC at about 50-fold could serve as a potential biomarker for severe sickness. For one exception, the severe AP (P8) who had a low ratio of cDC:pDC during acute infection was actually able to develop early NP-specific T cell responses. On the other hand, the rapid loss of DC number and function could contribute to the delayed T cell responses and the features of low-level IFN-I/IFN-III during COVID-19 infection (Blanco-Melo et al., 2020).
Acute SARS-CoV-2 infection results in a loss of a predominant RBD-specific T cell response. Lymphocytopenia is a common clinical presentation of both SARS and COVID-19, and this suggests that the two viruses could share a common mechanism in immune evasion. Grifoni et al. reported that the frequencies of T lymphocytes were not significantly low because their subjects were convalescing COVID-19 patients (Grifoni et al., 2020), which are similar to results of our CP cases. Liao et al. showed recently that there were increased T cells in bronchoalveolar lavage fluids in mild patients but not in severe patients, suggesting a difference in T cell migration into the lungs (Liao et al., 2020). In our study, we found that reduced frequencies of peripheral T cells in AP subjects were likely associated with decreased CD4 T cell proliferation and CD8 T cell hyperactivation in addition to T cell migration into the lungs during acute infection. Most recovered SARS patients developed T cell immune responses that mainly target the spike glycoprotein when compared with non-structural proteins (Channappanavar et al., 2014; Li et al., 2008a; Lv et al., 2009; Wang et al., 2004; Xu and Gao, 2004). In particular, T cell responses against the RBD region had a high frequency of responders. T cell response against the single RBD epitope 435-NYNYKYRYLRHGKLRPF-451 was found among 22% convalescent subjects, only lower than 24% of an epitope in Orf3 (Li et al., 2008a). Memory CD8 T cells specific for a single immunodominant RBD epitope in this domain (S436) substantially protected 8- to 10-month-old mice from lethal SARS-CoV infection (Channappanavar et al., 2014). Importantly, this RBD epitope also contains the most important determinant for inducing NAbs. We previously demonstrated that a single R441A mutation eliminates vaccine-induced NAbs against SARS-CoV (Yi et al., 2005). Interestingly, despite that there is a high sequence variation in RBD between SARS-CoV and SARS-CoV-2, the R441 residue remains conserved in both and allows the induction of RBD-specific NAbs. However, it is surprising that our AP subjects did not develop strong RBD-specific T cell response as evaluated by both ELISPOT and ICS assays. This aberrant observation contradicts with the high amounts of early RBD-specific IgG and NAb responses. This might be partly due to diminished DC function as mentioned above, or due to 7 amino acid differences (underlined) in the predicted immunodominant T cell epitope 435-NYNYLYEARLFRKSNLKPF-451 in SARS-CoV-2. We also observed that 39% CP subjects did not develop measurable RBD-specific T cell responses. It is possible that lacking RBD-specific T cell responses might be one of the potential mechanisms allowing SARS-CoV-2 to evade immune control and results in prolonged viral shedding in comparison with SARS-CoV.
Lack of timely developed CD8 T cell responses could contribute to disease severity during acute SARS-CoV-2 infection. The SARS-CoV infection induces strong and long-lasting cytotoxic T lymphocytes (CTL)-mediated immunity in surviving SARS patients (Chen et al., 2005). CD4-biased T cell responses induced by SARS-CoV, especially the proinflammatory cytokine storm, could cause pathological damage to the host (Xu and Gao, 2004). Moreover, increased Th2 cytokines were observed in patients with the fatal form of infection (Li et al., 2008a). We recently demonstrated that COVID-19 displays rapid kinetics of viral load peak and unexpected prolonged time of viral shedding in patients’ salivary samples, which are different from what was seen in SARS patients (To et al., 2020). In this study, we found that besides the overall loss of T cell functionality during acute SARS-CoV-2 infection, both RBD- and NP-specific T cells were likely dominated by CD4 T cells. Because we were not able to obtain T cells from more severely ill patients in ICU for comparison, we could not establish the role of antigen-specific CD4 T cells in promoting COVID-19 disease severity. However, we found that 3/6 severe AP cases (P11, P13, and P16) had neither measurable CD4 nor CD8 T cell responses in contrast to their high amounts of potent NAbs. In particular, although there is not a statistically significant difference in overall T cell responses between mild versus severe acute cases, the delayed RBD- and NP-specific T cell responses within first 2 weeks after symptoms onset might impact disease severity. It should be noted that initial T cell immune responses are highly variable among APs, but they tend to improve over time. Overall, the unusual timely reverted NAb and T cell responses in acute patients might contribute to COVID-19 pathogenesis. In support of this notion, we and others have previously reported that deceased SARS patients had faster development of NAbs than did CPs (Ho et al., 2005; Zhang et al., 2006). Moreover, COVID-19 patients with higher amounts of anti-S, anti-N IgG, and IgM correlate with worse clinical outcomes than do patients with older age (Jiang et al., 2020). A recent preprint study indicated that SARS-CoV-2 NAb responses are more robust in patients with severe disease (Wang et al., 2020b), which agrees with our recent finding that severe AP subjects in the ICU displayed significantly higher amounts of anti-RBD IgG and NAbs (Liu et al., 2020). In this study, although our overall AP and CP data indicated that the development of NAbs could be correlated with the induction of RBD-specific T cells responses, which likely supports the notion that the production of NAbs by plasma B cells requires the priming of viral protein specific CD4 T cells (Grifoni et al., 2020; Mitchison, 2004), the underlying mechanism of faster NAb and delayed RBD-specific CD4 T cells response during acute infection remains to be investigated. In a recent study, Ni et al. showed that 13/14 CPs had NAb responses, where the numbers of RBD-specific T cells are much lower than those of NP-specific T cells by ELISPOT, and 3/8 and 1/8 CPs did not have positive NP- and RBD-specific T cell responses, respectively (Ni et al., 2020). In a separate study, although 100% (20/20) CPs developed RBD-specific antibody responses, peripheral SARS-CoV-2-specific CD8+ and CD4+ T cells were identified in ∼70% and 100% of COVID-19 CPs, respectively, using the T cell receptor-dependent activation induced marker (AIM) assay (Grifoni et al., 2020). Because this assay did not measure the antigen-specific intracellular cytokine production, whether or not the responses were overestimated remains to be further determined. Here, we demonstrated consistently that although 100% (23/23) CPs had RBD IgG and NAb responses, 61% (14/23) and 83% (19/23) of them developed RBD- and NP-specific T cell responses, respectively. Moreover, 13% (3/23) of CPs had no measurable RBD- and NP-specific T cell responses against both NPs and RBDs. Collectively, the lack of T cell responses in some CPs might indicate their possibility for prolonged viral transmission and their vulnerability to secondary infection.
In summary, to the best of our knowledge, this study is the first to report DC functionality and imbalanced antibody and T cell responses during the acute phase of SARS-CoV-2 infection. We provide experimental evidence that acute SARS-CoV-2 infection leads to rapid deficiency of host DC and T cell functionality. This deficiency could have implications in viral pathogenesis, clinical severity, prolonged viral transmission, and vulnerability for future re-infection. Our findings could importantly contribute to the current knowledge on acute COVID-19 pathogenesis and to the design of an effective vaccine for inducing balanced protective immunity.
Limitations of Study
There are some limitations in our experiments. Due to the limited number of severe COVID-19 patients in Hong Kong, the sample size of APs should be increased in future studies. Another possible drawback of our study is that we used 15-mer overlapped by 11 for measuring RBD-specific CD4 T cell responses. CD4 T cell responses to larger peptides or conformational proteins therefore remain unclear. In addition, due to lymphocytopenia and other limitations of acquiring blood samples from ICU patients, the impact of NP- and RBD-specific T cell responses in COVID-19 disease severity should be further investigated. Because antiviral treatment has been given to patients rapidly after hospital admission (Hung et al., 2020), future studies should evaluate the impact of such therapy on host immune responses. Lastly, we only measured T cell responses to viral RBD and NP proteins, but T cell epitopes in the whole viral genome should be evaluated in future studies.
STAR★Methods
Key Resources Table
| REAGENT or RESOURCE | SOURCE | IDENTIFIER |
|---|---|---|
| Antibodies | ||
| BV785 anti-human CD3 (OKT3) | Biolegend | Cat# 317330; RRID: AB_2563507 |
| PE-Dazzle594 anti-human CD4 (OKT4) | Biolegend | Cat# 317448; RRID: AB_2565847 |
| APC-Fire750 anti-human CD8 (SK1) | Biolegend | Cat# 344746; RRID: AB_2572095 |
| BV421 anti-human CD19 (HIB19) | Biolegend | Cat# 302234; RRID: AB_11142678 |
| APC anti-human CD56 (B159) | BD Biosciences | Cat# 555518; RRID: AB_398601 |
| BV605 anti-human CD16 (3G8) | Biolegend | Cat# 302040; RRID: AB_2562990 |
| BV711 anti-human CCR2 (K036C2) | Biolegend | Cat# 357232; RRID: AB_2800970 |
| PE anti-human PD-1 (EH12.2H7) | Biolegend | Cat# 329906, RRID: AB_940483 |
| Percp-cy5.5 anti-human CD38 (HB7) | Biolegend | Cat# 356614; RRID: AB_2562183 |
| AF488 anti-human HLA-DR (LN3) | Biolegend | Cat# 327010; RRID: AB_893568 |
| PE-cy7 anti-human TIM-3 (F38-2E2) | Biolegend | Cat# 345014; RRID: AB_2561720 |
| BV785 anti-human CD19 (HIB19) | Biolegend | Cat# 302240; RRID: AB_2563442 |
| BV785 anti-human CD56 (5.1H11) | Biolegend | Cat# 362550; RRID: AB_2566059 |
| Percp-cy5.5 anti-human CD14 (HCD14) | Biolegend | Cat# 325622; RRID: AB_893250 |
| APC-Fire750 anti-human CD11C | Biolegend | Cat# 371510; RRID: AB_2650793 |
| PE-cy7 anti-human CD123 (7G3) | BD Biosciences | Cat# 560826; RRID: AB_10563898 |
| APC anti-human CD11b (1CRF44) | Biolegend | Cat# 301310; RRID: AB_314162 |
| PE-CF594 anti-human CD33 (WM53) | BD Biosciences | Cat# 562492; RRID: AB_2713912 |
| BV421 anti-human CD15 (W6D3) | Biolegend | Cat# 323040; RRID: AB_2566520 |
| PE anti-human CD86 (BU63) | Biolegend | Cat# 374206; RRID: AB_2721633 |
| PB anti-human CD40 (5C3) | Biolegend | Cat# 334320; RRID: AB_10613295 |
| PE-cy7 anti-human CD80 (2D10) | Biolegend | Cat# 305218; RRID: AB_2076148 |
| PE-CF594 anti-human CD83 (HB15e) | BD Biosciences | Cat# 562631; RRID: AB_2737688 |
| Percp-cy5.5 anti-human CD86 (IT2.2) | Biolegend | Cat# 305420; RRID: AB_1575068 |
| APC anti-human HLA-DR (L243) | Biolegend | Cat# 307610; RRID: AB_314688 |
| FITC anti-human HLA-ABC (W6/32) | Biolegend | Cat# 311404; RRID: AB_314873 |
| PE anti-human CCR7 (G043H7) | Biolegend | Cat# 353204; RRID: AB_10913813 |
| BV711 anti-human CD3 (OKT3) | Biolegend | Cat# 317328; RRID: AB_2562907 |
| Percep-cy5.5 anti-human CD4 (OKT4) | Biolegend | Cat# 317428; RRID: AB_1186122 |
| PE-Dazzle594 anti-human CD8 (RPA-T8) | Biolegend | Cat# 301058; RRID: AB_2563570 |
| PE-cy7 anti-human CD45RA (HI100) | Biolegend | Cat# 304126; RRID: AB_10708879 |
| BV605 anti-human IFN-g (B27) | Biolegend | Cat# 506542; RRID: AB_2801102 |
| APC-cy7 anti-human TNF-a (MAB11) | Biolegend | Cat# 502944; RRID: AB_2562870 |
| AF647 anti-human Granzyme-B (GB11) | Biolegend | Cat# 515406; RRID: AB_2566333 |
| BV421 anti-human Perforin (dG9) | Biolegend | Cat# 308122; RRID: AB_2566204 |
| BV421 anti-human CD141 (M80) | Biolegend | Cat# 344114; RRID: AB_2563858 |
| BV605 anti-human CD123 (6H6) | Biolegend | Cat# 306026; RRID: AB_2563826 |
| APC anti-human CCR7 (G043H7) | Biolegend | Cat# 353214; RRID: AB_10917387 |
| FITC anti-human CD303 (201A) | Biolegend | Cat# 354208; RRID: AB_2561364 |
| PE anti-human CD11c (3.9) | Biolegend | Cat# 301606; RRID: AB_314176 |
| APC-cy7 anti-human CD1c (L161) | Biolegend | Cat# 331520; RRID: AB_10644008 |
| AF488 anti-human ki67 (B56) | BD Biosciences | Cat# 561165; RRID: AB_10611866 |
| Purified Anti-CD3 (OKT3) | Biolegend | Cat# 317347; RRID: AB_2571994 |
| Purified Anti-CD28 (CD28.2) | Biolegend | Cat# 302902; RRID: AB_314304 |
| Anti-human CD49d (9F10) | Biolegend | Cat# 304302; RRID: AB_314428 |
| Biological Samples | ||
| Blood sample from healthy donor | Hong Kong Red Cross | N/A |
| Blood sample from COVID-19 patients | Queen Mary Hospital | N/A |
| Chemicals, Peptides, and Recombinant Proteins | ||
| Human BD Fc block | BD Biosciences | Cat# 564220; RRID: AB_2728082 |
| Lymphoprep | STEMCELL | Cat# 07851 |
| Cell Stimulation Cocktail, PMA/Ionomycin | Biolegend | Cat# 423302 |
| Human IL-1 beta protein | PeproTech | Cat# 200-01B/2ug |
| Human IL-6 | Miltenyi Biotec | Cat# 130-095-365 |
| Human TNF-a | Miltenyi Biotec | Cat# 130-094-017 |
| Prostaglandin E2 | PeproTech | Cat# SM-3632464-A |
| SARS-CoV-2 RBD peptide pool | Genscript Biotech | Custom-made |
| SARS-CoV-2 Nucleocapsid Protein (NP) | ImmunoDiagnostics | Cat# 41A220 |
| SARS-CoV-2 RBD-His Recombinant Protein | Sino Biological | Cat# 40592-V08B |
| 3, 3′,5, 5′-Tetramethylbenzidine Liquid Substrate | Sigma-Aldrich T4444 | Cat# T4444 |
| Goat anti-Human IgG Cross-Adsorbed Secondary Antibody, HRP | Invitrogen | Cat# 62-8420 |
| Critical Commercial Assays | ||
| Zombie Aqua™ Fixable Viability Kit | Biolegend | Cat# 308110; RRID: AB_493254 |
| Fixation/Permeabilization Solution Kit | BD Biosciences | Cat# 554714 |
| Pan-DC Enrichment Kit, human | Miltenyi Biotec | Cat# 130-100-777 |
| Pan T Cell Isolation Kit, human | Miltenyi Biotec | Cat# 130-096-535 |
| QuantiNova Probe RT-PCR kit | QIAGEN | Cat# 208352 |
| CellTrace™ CFSE Cell Proliferation Kit | Invitrogen | Cat# C34554 |
| LEGENDplex™ Human Th Panel (13-plex) | Biolegend | Cat# 740722 |
| LEGENDplex™ Human Anti-Virus Response Panel (13-plex) | Biolegend | Cat# 740390 |
| Human IFN-γ ELISpot PLUS kit | MABTECH | Cat# 3420-4APT-2 |
| Luciferase Assay System | Promega | Cat# 1501 |
| Experimental Models: Cell Lines | ||
| HEK293T-hACE2 cells | In house | N/A |
| Software and Algorithms | ||
| FLOWJO X 10.0.7r2 | https://www.flowjo.com/solutions/flowjo/ | RRID: SCR_008520 |
| LEGENDplex v8.0 | https://www.biolegend.com/en-us/legendplex | N/A |
| GraphPad Prism 6 | https://www.graphpad.com/scientific-software/prism/ | RRID: SCR_002798 |
Resource Availability
Lead Contact
Further information and requests for resources and reagent should be directed to and will be fulfilled by the Lead Contact, Zhiwei Chen (zchenai@hku.hk).
Materials Availability
This study did not generate new unique reagents.
Data and Code Availability
The study did not generate any unique datasets or codes.
Experimental Models and Subject Details
Human subjects
Forty-one adult COVID-19 patients, including 17 acute and 24 convalescent cases, were recruited from Queen Mary Hospital, Princess Margaret Hospital and Pamela Youde Nethersole Eastern Hospital in the Hong Kong Special Administrative Region. COVID-19 was confirmed by the detection of SARS-CoV-2 by reverse-transcription polymerase chain reaction (RT-PCR) as previously described (To et al., 2020). Twenty-seven out of 39 patients included in this study have been reported recently (Hung et al., 2020), but their immune profiles and functions have not been studied. Written informed consent was obtained from all patients. This study was approved by the Institutional Review Board of University of Hong Kong/Hospital Authority Hong Kong West Cluster, Hong Kong East Cluster Research Ethics Committee, and Kowloon West Cluster Research Ethics Committee (UW 13-265, HKECREC-2018-068, KW/EX-20-038[144-26]). Six severe and 11 mild patients, who remained hospitalized during study, were recruited in the acute patient (AP) group. Blood samples were collected at the median 13.5 days after symptoms onset (range, 1-42 days). A total of 28 blood samples were collected from the AP cohort, of which 21 samples were collected within 21 days after symptoms onset and 7 samples were collected at least 21 days after symptoms onset. Among the convalescent patients (CP) who received treatment and were subsequently discharged from the hospital, a total of 29 blood samples from 3 severe and 26 mild patients were collected at the median 30 days (range, 21-54 days) after symptoms onset. Patient information of the overall cohort, including age, sex, and health status, was shown in Table 1. A comparison of patient information between acute patients and convalescent patients was shown in Table S1. Healthy human blood buffy coats were obtained from the Red Cross of Hong Kong from donors at median age of 40 (interquartile range, 19-49). The use of buffy coats received ethics approval from the Institutional Review Board of the University of Hong Kong/Hospital Authority Hong Kong West Cluster #UW13-476.
Cell lines
HEK293T-hACE2 cells were maintained in DMEM containing 10% FBS, 2 mM L-glutamine and 100 U/mL penicillin and were incubated at 37°C in 5% CO2 setting (Liu et al., 2019).
Method Details
Peripheral blood mononuclear cell (PBMC) isolation
PBMCs from healthy donors and patients were isolated from fresh blood samples using Ficoll-Paque density gradient centrifugation in our BSL-3 laboratory at the same day of blood collection. The majority of purified PBMCs were used for immune cell phenotyping whereas plasma samples were subjected to antibody testing. The rest of the cells were cryopreserved in freezing medium (90% FBS+10% DMSO) at 5 × 10⁶ cells/mL at −150°C.
The 12-color flow cytometry analysis
For the 12-color flow cytometry analysis, four panels of mAbs were used (Biolegend, eBiosciences and BD Biosciences) (Table S2). Cells were incubated for 10 min with Fc Block (BD Biosciences) in staining buffer (PBS containing 2% FBS) followed by staining with the indicated antibodies for 30 min at 4°C. The amounts of cytokines of interest in culture supernatant were measured by LEGENDplex Human Panel (13-plex, Biolegend). Stained cells and beads were acquired by FACSAriaIII Flow Cytometer (BD Biosciences) inside a BSL-3 laboratory and analyzed with FlowJo software (v10.6) (BD Bioscience) and LEGENDplex software (v8.0) (Biolegend).
Dendritic cell (DC) isolation and in vitro maturation
Mixed population of pDC and cDC were first isolated using untouched Pan-DC Enrichment Kits (Miltenyi Biotec) according to manufacturer’s instructions and were then cultured in AIM-V medium (GIBCO). For the maturation assay, DCs were stimulated with a cocktail of proinflammatory cytokines (10 ng/mL of recombinant human IL-1β, IL-6, TNF-α and 500 ng/mL of prostaglandin E2 for 24 h as previously described (Schuler-Thurner et al., 2002). The expression of DC maturation markers was then determined by flow cytometry.
Allogeneic mixed lymphocyte reaction assay (MLR)
Pan DCs were stimulated with or without the cocktail of proinflammatory cytokines for 24 h and were then washed 3 times with PBS. DCs were then γ-irradiated (30 Gy) and counted using trypan blue. Pan T cells from allogeneic healthy donors were isolated using a human Pan T Cell Isolation Kit according to manufacturer’s instructions. T cells were then stained with 5 μM Carboxyfluorescein succinimidyl ester (CFSE) for 10 min and further washed 3 times with medium (AIM-V). 1x10⁴ viable DCs from either HD or patients were co-cultured with CFSE-labeled allogeneic T cells (105) from a different HD at a DC:T cells ratio of 1:10. T cells alone and T cells stimulated with anti-CD3/CD28 mAbs were included as the negative and positive controls, respectively. Five days post-coculture, the percentage of T cell proliferation was measured by the percentage of CFSE low cells as previously described (Gutzmer et al., 2004).
T cell proliferation
To measure T cell proliferation, Carboxyfluorescein 6 succinimidyl ester (CFSE, Thermo Scientific)-labeled PBMCs were cultured in 96-well U-bottom plates with RPMI 1640 medium containing 10% FBS and 1% streptomycin/penicillin (all from GIBCO). PBMCs were then cultured in the presence or absence of soluble anti-CD3 (2 μg/mL) antibody and anti-CD28 (1 μg/mL) antibody for 3 days. Proliferated T cells were identified by the percentage of CFSE low cells.
Intracellular cytokine staining (ICS)
To measure T cell activation, PBMCs were stimulated with the commercially available cell activation cocktail (Biolegend) containing phorbol 12-myristate-13-acetate (PMA) and ionomycin in the presence of brefeldin A (BFA, 7.5 μg/mL, Sigma-Aldrich) for 6 h. For COVID-19-specific T cell responses, PBMCs were stimulated with 1 μg/mL COVID-19 RBD peptide pool (15-mer overlapping by 11, spanning the whole RBD sequence at Spike306-543) or 5 μg/mL purified nucleocapsid (NP) protein in the presence of 0.5 μg/mL anti-CD28 and anti-CD49d mAbs (BD Bioscience). Cells were incubated at 37°C overnight and BFA was added at 2 h post incubation, as previously described (Li et al., 2008a). PMA/ionomycin stimulation was included as positive control. After overnight incubation, cells were washed with staining buffer (PBS containing 2% FBS) and stained with mAbs against surface markers. For intracellular staining, cells were fixed and permeabilized with BD Cytofix/Cytoperm (BD Biosciences) prior to staining with the mAbs against cytokines (Table S2) with Pern/Wash buffer (BD Biosciences). Results were considered positive when there was at least a 2-fold increase above the background of HD.
IFN-γ ELISPOT
Frozen PBMCs were rested overnight at 37°C with 5% CO2 after thawing. Cells were then seeded into the anti-human IFN-γ mAb pre-coated 96-well plate at 200,000 cells/well. The COVID-19 RBD peptide pool using the optimal concentration of 1 μg/mL (Grifoni et al., 2020) or NP protein (5 μg/mL) was added to the cells for overnight incubation in the presence of anti-CD28 and anti-CD49d mAbs (0.5 μg/mL) as described by others (Shin et al., 2019, Li et al., 2008a, Waldrop et al., 1998). The sequences of the RBD peptide pool are shown in Table S3. PMA/ionomycin treatment was used as the positive control and anti-CD28/anti-CD49d mAbs treatment was used as the as the negative control. The ELISPOT assay was performed using the human IFN-γ ELISPOT Kit (Mabtech) according the manufacturer’s instructions. Spots were counted using an immunospot reader and image analyzer (Cellular Technology Limited). Results were considered positive when the number of spot-forming cells (SFC)/106 PBMCs was 2-fold above that of the negative controls.
Pseudotyped viral neutralization assay
To determine the neutralizing activity of patients’ plasma, plasma were inactivated at 56°C for 30 min prior to a pseudotype viral entry assay as previously described (Liu et al., 2019; Zhang et al., 2006). The result of this assay is strongly correlated with that of neutralization assay using replication-competent SARS-CoV or SARS-CoV-2 (Liu et al., 2020; Temperton et al., 2005). In brief, the SARS-CoV-2 pseudotype virus was generated through co-transfection of 293T cells with 2 plasmids, pVax-1-S-COVID19 and pNL4-3Luc_Env_Vpr, carrying the optimized SARS-CoV-2 S gene and a human immunodeficiency virus type 1 backbone respectively. At 48 h post-transfection, viral supernatant was collected and frozen at −150°C. Serially diluted plasma samples were incubated with 200 TCID50 of pseudovirus at 37°C for 1 h. The plasma-virus mixtures were then added into pre-seeded HEK293T-hACE2 cells. After 48 h, infected cells were lysed and luciferase activity was measured using Luciferase Assay System kits (Promega) in a Victor3-1420 Multilabel Counter (PerkinElmer). The 50% inhibitory concentrations (IC50) of each plasma specimen were calculated to reflect anti-SARS-CoV-2 potency.
Enzyme-linked immunosorbent assay (ELISA)
ELISA was performed to detect SARS-CoV-2 RBD-specific IgG, as previously described (Wu et al., 2018). In brief, 96-well plates (Costar) were coated with recombinant SARS-CoV-2 RBD antigen (50 ng/well; Sino Biological) at 4°C overnight. After washing with PBST (0.05% Tween-20 in PBS), the plates were blocked with 4% skim milk in PBS for 1 h at 37°C and incubated with serially diluted patient plasma for 1 h at 37°C. After washing with PBST, goat anti-human IgG conjugated with HRP (Santa Cruz Biotechnology) was added and the whole solution was incubated for 1 h, followed by washing and the addition of 50 μl HRP chromogenic substrate 3,3′,5,5′-TMB (Sigma). Optical density (OD) values were measured at 450 nm using the VARIOSKANTM LUX multimode microplate reader (Thermo Fisher Scientific). Five-fold of mean OD values detected from blank wells containing 4% skim milk in PBS alone was used as a cutoff for the endpoint antibody titer calculation. All experiments were performed in duplicate.
Real-time RT-PCR assay for SARS-CoV-2 RNA measurement
Saliva specimens from COVID-19 patients were collected as previously described (To et al., 2020) and further subjected to total nucleic acid (TNA) extraction using a NucliSENS easyMAG extraction system (Chan et al., 2020). The real-time RT-PCR assay for SARS-CoV-2-RdRp/Hel RNA detection was performed using QuantiNova Probe RT-PCR kit (QIAGEN) in a LightCycler 480 real-time PCR system. Briefly, 5 μl TNA was added to 15 μL reaction mixture that contained 0.2 μM probe. The thermal cycling condition was 10 min at 45°C for reverse transcription, 5 min at 95°C for PCR initial activation, and 45 cycles of 5 s at 95°C and 30 s at 55°C.
Quantification and Statistical Analysis
Statistical analysis was performed with the GraphPad Prism 6 Software. Data represent mean values or mean values with SD. Significant differences between the means of three groups were tested using a one-way analysis of variance (ANOVA) followed by Tukey’s multiple comparisons test. Significant differences between two groups were performed using the 2-tailed Student’s t test. p < 0.05 was considered statistically significant.
Acknowledgments
This work was partly supported by Theme-Based Research Scheme (T11-706/18-N to Z.C.) of the Hong Kong Research Grants Council, University Development Fund, and Li Ka Shing Faculty of Medicine Matching Fund from HKU to AIDS Institute. We thank Dr. Xu Aiming for providing purified NP protein. We also thank Serena J. Chen and Lok-Yan Yim for editorial work. Funding supports to K.Y. include the donations of the Shaw Foundation Hong Kong, Richard Yu and Carol Yu, May Tam Mak Mei Yin, Michael Seak-Kan Tong, Respiratory Viral Research Foundation Limited, Hui Ming, Hui Hoy and Chow Sin Lan Charity Fund Limited, Chan Yin Chuen Memorial Charitable Foundation, Marina Man-Wai Lee, the Hong Kong Hainan Commercial Association South China Microbiology Research Fund, the Jessie & George Ho Charitable Foundation, Perfect Shape Medical Limited, and Kai Chong Tong; funding from the Health and Medical Research Fund (grant no. COVID190123), the Food and Health Bureau, The Government of the Hong Kong Special Administrative Region; the National Program on Key Research Project of China (grant no. 2020YFA0707500 and 2020YFA0707504); the Consultancy Service for Enhancing Laboratory Surveillance of Emerging Infectious Diseases and Research Capability on Antimicrobial Resistance for Department of Health of the Hong Kong Special Administrative Region Government; the Theme-Based Research Scheme (T11/707/15) of the Research Grants Council, Hong Kong Special Administrative Region; Sanming Project of Medicine in Shenzhen, China (No. SZSM201911014); and the High Level-Hospital Program, Health Commission of Guangdong Province, China. The funding sources had no role in study design, data collection, analysis, interpretation, or writing of the report. The corresponding author had full access to all the data in the study and had final responsibility for the decision to submit for publication.
Author Contributions
Z.C. and K.-Y.Y. supervised their collaborative teams in the study. R.Z. and Z.C. designed experiments, analyzed data, and wrote the manuscript. R.Z., H.H., and Y.M. did ELISPOT and ICS. Y.-C.W., R.Z., X.L., Y.-L.T., and T.T.-K.L. prepared samples. L.L. and Z.C. conducted the pseudoviral neutralization assay. B.Z. did RBD ELISA. K.K.-W.T., P.Y., W.-M.C., A.K.-L.W., K.-C.L., O.T.-Y.T., W.-S.L., and I.F.-N.H. collected clinical samples and data.
Declaration of Interests
The authors declare no competing interests.
Published: August 4, 2020
Footnotes
Supplemental Information can be found online at https://doi.org/10.1016/j.immuni.2020.07.026.
Supplemental Information
References
- Blanco-Melo D., Nilsson-Payant B.E., Liu W.C., Uhl S., Hoagland D., Møller R., Jordan T.X., Oishi K., Panis M., Sachs D. Imbalanced Host Response to SARS-CoV-2 Drives Development of COVID-19. Cell. 2020;181:1036–1045.e9. doi: 10.1016/j.cell.2020.04.026. [DOI] [PMC free article] [PubMed] [Google Scholar]
- Chan J.F., Kok K.H., Zhu Z., Chu H., To K.K., Yuan S., Yuen K.Y. Genomic characterization of the 2019 novel human-pathogenic coronavirus isolated from a patient with atypical pneumonia after visiting Wuhan. Emerg. Microbes Infect. 2020;9:221–236. doi: 10.1080/22221751.2020.1719902. [DOI] [PMC free article] [PubMed] [Google Scholar]
- Chan J.F., Yip C.C., To K.K., Tang T.H., Wong S.C., Leung K.H., Fung A.Y., Ng A.C., Zou Z., Tsoi H.W. Improved Molecular Diagnosis of COVID-19 by the Novel, Highly Sensitive and Specific COVID-19-RdRp/Hel Real-Time Reverse Transcription-PCR Assay Validated In Vitro and with Clinical Specimens. J. Clin. Microbiol. 2020;58:e00310–e00320. doi: 10.1128/JCM.00310-20. [DOI] [PMC free article] [PubMed] [Google Scholar]
- Chan J.F., Yuan S., Kok K.H., To K.K., Chu H., Yang J., Xing F., Liu J., Yip C.C., Poon R.W. A familial cluster of pneumonia associated with the 2019 novel coronavirus indicating person-to-person transmission: a study of a family cluster. Lancet. 2020;395:514–523. doi: 10.1016/S0140-6736(20)30154-9. [DOI] [PMC free article] [PubMed] [Google Scholar]
- Channappanavar R., Fett C., Zhao J., Meyerholz D.K., Perlman S. Virus-specific memory CD8 T cells provide substantial protection from lethal severe acute respiratory syndrome coronavirus infection. J. Virol. 2014;88:11034–11044. doi: 10.1128/JVI.01505-14. [DOI] [PMC free article] [PubMed] [Google Scholar]
- Chaplin D.D. Overview of the immune response. J. Allergy Clin. Immunol. 2010;125(2, Suppl 2):S3–S23. doi: 10.1016/j.jaci.2009.12.980. [DOI] [PMC free article] [PubMed] [Google Scholar]
- Chen H., Hou J., Jiang X., Ma S., Meng M., Wang B., Zhang M., Zhang M., Tang X., Zhang F. Response of memory CD8+ T cells to severe acute respiratory syndrome (SARS) coronavirus in recovered SARS patients and healthy individuals. J. Immunol. 2005;175:591–598. doi: 10.4049/jimmunol.175.1.591. [DOI] [PubMed] [Google Scholar]
- Chen J., Qi T., Liu L., Ling Y., Qian Z., Li T., Li F., Xu Q., Zhang Y., Xu S. Clinical progression of patients with COVID-19 in Shanghai, China. J. Infect. 2020;80:e1–e6. doi: 10.1016/j.jinf.2020.03.004. [DOI] [PMC free article] [PubMed] [Google Scholar]
- Chen N., Zhou M., Dong X., Qu J., Gong F., Han Y., Qiu Y., Wang J., Liu Y., Wei Y. Epidemiological and clinical characteristics of 99 cases of 2019 novel coronavirus pneumonia in Wuhan, China: a descriptive study. Lancet. 2020;395:507–513. doi: 10.1016/S0140-6736(20)30211-7. [DOI] [PMC free article] [PubMed] [Google Scholar]
- Chiappelli F., Khakshooy A., Greenberg G. CoViD-19 Immunopathology and Immunotherapy. Bioinformation. 2020;16:219–222. doi: 10.6026/97320630016219. [DOI] [PMC free article] [PubMed] [Google Scholar]
- Chu H., Chan J.F., Wang Y., Yuen T.T., Chai Y., Hou Y., Shuai H., Yang D., Hu B., Huang X. Comparative replication and immune activation profiles of SARS-CoV-2 and SARS-CoV in human lungs: an ex vivo study with implications for the pathogenesis of COVID-19. Clin. Infect. Dis. 2020:ciaa410. doi: 10.1093/cid/ciaa410. [DOI] [PMC free article] [PubMed] [Google Scholar]
- Du R.H., Liang L.R., Yang C.Q., Wang W., Cao T.Z., Li M., Guo G.Y., Du J., Zheng C.L., Zhu Q. Predictors of mortality for patients with COVID-19 pneumonia caused by SARS-CoV-2: a prospective cohort study. Eur. Respir. J. 2020;55:2000524. doi: 10.1183/13993003.00524-2020. [DOI] [PMC free article] [PubMed] [Google Scholar]
- Fitzgerald-Bocarsly P., Dai J., Singh S. Plasmacytoid dendritic cells and type I IFN: 50 years of convergent history. Cytokine Growth Factor Rev. 2008;19:3–19. doi: 10.1016/j.cytogfr.2007.10.006. [DOI] [PMC free article] [PubMed] [Google Scholar]
- Grifoni A., Weiskopf D., Ramirez S.I., Mateus J., Dan J.M., Moderbacher C.R., Rawlings S.A., Sutherland A., Premkumar L., Jadi R.S. Targets of T cell responses to SARS-CoV-2 coronavirus in humans with COVID-19 disease and unexposed individuals. Cell. 2020;181:1489–1501.e15. doi: 10.1016/j.cell.2020.05.015. [DOI] [PMC free article] [PubMed] [Google Scholar]
- Gutzmer R., Li W., Sutterwala S., Lemos M.P., Elizalde J.I., Urtishak S.L., Behrens E.M., Rivers P.M., Schlienger K., Laufer T.M. A tumor-associated glycoprotein that blocks MHC class II-dependent antigen presentation by dendritic cells. J. Immunol. 2004;173:1023–1032. doi: 10.4049/jimmunol.173.2.1023. [DOI] [PubMed] [Google Scholar]
- Ho M.S., Chen W.J., Chen H.Y., Lin S.F., Wang M.C., Di J., Lu Y.T., Liu C.L., Chang S.C., Chao C.L. Neutralizing antibody response and SARS severity. Emerg. Infect. Dis. 2005;11:1730–1737. doi: 10.3201/eid1111.040659. [DOI] [PMC free article] [PubMed] [Google Scholar]
- Holshue M.L., DeBolt C., Lindquist S., Lofy K.H., Wiesman J., Bruce H., Spitters C., Ericson K., Wilkerson S., Tural A., Washington State 2019-nCoV Case Investigation Team First Case of 2019 Novel Coronavirus in the United States. N. Engl. J. Med. 2020;382:929–936. doi: 10.1056/NEJMoa2001191. [DOI] [PMC free article] [PubMed] [Google Scholar]
- Huang C., Wang Y., Li X., Ren L., Zhao J., Hu Y., Zhang L., Fan G., Xu J., Gu X. Clinical features of patients infected with 2019 novel coronavirus in Wuhan, China. Lancet. 2020;395:497–506. doi: 10.1016/S0140-6736(20)30183-5. [DOI] [PMC free article] [PubMed] [Google Scholar]
- Hung I.F., Lung K.C., Tso E.Y., Liu R., Chung T.W., Chu M.Y., Ng Y.Y., Lo J., Chan J., Tam A.R. Triple combination of interferon beta-1b, lopinavir-ritonavir, and ribavirin in the treatment of patients admitted to hospital with COVID-19: an open-label, randomised, phase 2 trial. Lancet. 2020;395:1695–1704. doi: 10.1016/S0140-6736(20)31042-4. [DOI] [PMC free article] [PubMed] [Google Scholar]
- Jiang H.-w., Li Y., Zhang H.-n., Wang W., Yang X., Qi H., Li H., Men D., Zhou J., Tao S.-c. SARS-CoV-2 proteome microarray for global profiling of COVID-19 specific IgG and IgM responses. Nat. Commun. 2020;11:3581. doi: 10.1038/s41467-020-17488-8. [DOI] [PMC free article] [PubMed] [Google Scholar]
- Jongbloed S.L., Kassianos A.J., McDonald K.J., Clark G.J., Ju X., Angel C.E., Chen C.J.J., Dunbar P.R., Wadley R.B., Jeet V. Human CD141+ (BDCA-3)+ dendritic cells (DCs) represent a unique myeloid DC subset that cross-presents necrotic cell antigens. J. Exp. Med. 2010;207:1247–1260. doi: 10.1084/jem.20092140. [DOI] [PMC free article] [PubMed] [Google Scholar]
- Lan J., Ge J., Yu J., Shan S., Zhou H., Fan S., Zhang Q., Shi X., Wang Q., Zhang L., Wang X. Structure of the SARS-CoV-2 spike receptor-binding domain bound to the ACE2 receptor. Nature. 2020;581:215–220. doi: 10.1038/s41586-020-2180-5. [DOI] [PubMed] [Google Scholar]
- Law H.K., Cheung C.Y., Ng H.Y., Sia S.F., Chan Y.O., Luk W., Nicholls J.M., Peiris J.S., Lau Y.L. Chemokine up-regulation in SARS-coronavirus-infected, monocyte-derived human dendritic cells. Blood. 2005;106:2366–2374. doi: 10.1182/blood-2004-10-4166. [DOI] [PMC free article] [PubMed] [Google Scholar]
- Li C.K., Wu H., Yan H., Ma S., Wang L., Zhang M., Tang X., Temperton N.J., Weiss R.A., Brenchley J.M. T cell responses to whole SARS coronavirus in humans. J. Immunol. 2008;181:5490–5500. doi: 10.4049/jimmunol.181.8.5490. [DOI] [PMC free article] [PubMed] [Google Scholar]
- Liao M., Liu Y., Yuan J., Wen Y., Xu G., Zhao J., Cheng L., Li J., Wang X., Wang F. Single-cell landscape of bronchoalveolar immune cells in patients with COVID-19. Nat. Med. 2020;26:842–844. doi: 10.1038/s41591-020-0901-9. [DOI] [PubMed] [Google Scholar]
- Liu L., Wei Q., Nishiura K., Peng J., Wang H., Midkiff C., Alvarez X., Qin C., Lackner A., Chen Z. Spatiotemporal interplay of severe acute respiratory syndrome coronavirus and respiratory mucosal cells drives viral dissemination in rhesus macaques. Mucosal Immunol. 2016;9:1089–1101. doi: 10.1038/mi.2015.127. [DOI] [PMC free article] [PubMed] [Google Scholar]
- Liu L., Wei Q., Lin Q., Fang J., Wang H., Kwok H., Tang H., Nishiura K., Peng J., Tan Z. Anti-spike IgG causes severe acute lung injury by skewing macrophage responses during acute SARS-CoV infection. JCI Insight. 2019;4:e123158. doi: 10.1172/jci.insight.123158. [DOI] [PMC free article] [PubMed] [Google Scholar]
- Liu L., To K.K., Chan K.H., Wong Y.C., Zhou R., Kwan K.Y., Fong C.H., Chen L.L., Choi C.Y., Lu L. High neutralizing antibody titer in intensive care unit patients with COVID-19. Emerg. Microbes Infect. 2020;9:1664–1670. doi: 10.1080/22221751.2020.1791738. [DOI] [PMC free article] [PubMed] [Google Scholar]
- Lv Y., Ruan Z., Wang L., Ni B., Wu Y. Identification of a novel conserved HLA-A∗0201-restricted epitope from the spike protein of SARS-CoV. BMC Immunol. 2009;10:61. doi: 10.1186/1471-2172-10-61. [DOI] [PMC free article] [PubMed] [Google Scholar]
- Mitchison N.A. T-cell-B-cell cooperation. Nat. Rev. Immunol. 2004;4:308–312. doi: 10.1038/nri1334. [DOI] [PubMed] [Google Scholar]
- Ni L., Ye F., Cheng M.L., Feng Y., Deng Y.Q., Zhao H., Wei P., Ge J., Gou M., Li X. Detection of SARS-CoV-2-Specific Humoral and Cellular Immunity in COVID-19 Convalescent Individuals. Immunity. 2020;52:971–977.e3. doi: 10.1016/j.immuni.2020.04.023. [DOI] [PMC free article] [PubMed] [Google Scholar]
- Rothe C., Schunk M., Sothmann P., Bretzel G., Froeschl G., Wallrauch C., Zimmer T., Thiel V., Janke C., Guggemos W. Transmission of 2019-nCoV Infection from an Asymptomatic Contact in Germany. N. Engl. J. Med. 2020;382:970–971. doi: 10.1056/NEJMc2001468. [DOI] [PMC free article] [PubMed] [Google Scholar]
- Schuler-Thurner B., Schultz E.S., Berger T.G., Weinlich G., Ebner S., Woerl P., Bender A., Feuerstein B., Fritsch P.O., Romani N., Schuler G. Rapid induction of tumor-specific type 1 T helper cells in metastatic melanoma patients by vaccination with mature, cryopreserved, peptide-loaded monocyte-derived dendritic cells. J. Exp. Med. 2002;195:1279–1288. doi: 10.1084/jem.20012100. [DOI] [PMC free article] [PubMed] [Google Scholar]
- Shin H.S., Kim Y., Kim G., Lee J.Y., Jeong I., Joh J.S., Kim H., Chang E., Sim S.Y., Park J.S., Lim D.G. Immune Responses to Middle East Respiratory Syndrome Coronavirus During the Acute and Convalescent Phases of Human Infection. Clin. Infect. Dis. 2019;68:984–992. doi: 10.1093/cid/ciy595. [DOI] [PMC free article] [PubMed] [Google Scholar]
- Tan W., Lu Y., Zhang J., Wang J., Dan Y., Tan Z., He X., Qian C., Sun Q., Hu Q. Viral Kinetics and Antibody Responses in Patients with COVID-19. medRxiv. 2020 2020.2003.2024.20042382. [Google Scholar]
- Temperton N.J., Chan P.K., Simmons G., Zambon M.C., Tedder R.S., Takeuchi Y., Weiss R.A. Longitudinally profiling neutralizing antibody response to SARS coronavirus with pseudotypes. Emerg. Infect. Dis. 2005;11:411–416. doi: 10.3201/eid1103.040906. [DOI] [PMC free article] [PubMed] [Google Scholar]
- To K.K., Tsang O.T., Leung W.S., Tam A.R., Wu T.C., Lung D.C., Yip C.C., Cai J.P., Chan J.M., Chik T.S. Temporal profiles of viral load in posterior oropharyngeal saliva samples and serum antibody responses during infection by SARS-CoV-2: an observational cohort study. Lancet Infect. Dis. 2020;20:565–574. doi: 10.1016/S1473-3099(20)30196-1. [DOI] [PMC free article] [PubMed] [Google Scholar]
- Tseng C.T., Perrone L.A., Zhu H., Makino S., Peters C.J. Severe acute respiratory syndrome and the innate immune responses: modulation of effector cell function without productive infection. J. Immunol. 2005;174:7977–7985. doi: 10.4049/jimmunol.174.12.7977. [DOI] [PubMed] [Google Scholar]
- Waldrop S.L., Davis K.A., Maino V.C., Picker L.J. Normal human CD4+ memory T cells display broad heterogeneity in their activation threshold for cytokine synthesis. J. Immunol. 1998;161:5284–5295. [PubMed] [Google Scholar]
- Wan Y., Shang J., Graham R., Baric R.S., Li F. Receptor recognition by novel coronavirus from Wuhan: An analysis based on decade-long structural studies of SARS. J. Virol. 2020;94:e00127-20. doi: 10.1128/JVI.00127-20. [DOI] [PMC free article] [PubMed] [Google Scholar]
- Wang Y.D., Sin W.Y., Xu G.B., Yang H.H., Wong T.Y., Pang X.W., He X.Y., Zhang H.G., Ng J.N., Cheng C.S. T-cell epitopes in severe acute respiratory syndrome (SARS) coronavirus spike protein elicit a specific T-cell immune response in patients who recover from SARS. J. Virol. 2004;78:5612–5618. doi: 10.1128/JVI.78.11.5612-5618.2004. [DOI] [PMC free article] [PubMed] [Google Scholar]
- Wang D., Hu B., Hu C., Zhu F., Liu X., Zhang J., Wang B., Xiang H., Cheng Z., Xiong Y. Clinical Characteristics of 138 Hospitalized Patients With 2019 Novel Coronavirus-Infected Pneumonia in Wuhan, China. JAMA. 2020;323:1061–1069. doi: 10.1001/jama.2020.1585. [DOI] [PMC free article] [PubMed] [Google Scholar]
- Wang P., Liu L., Nair M.S., Yin M.T., Luo Y., Wang Q., Yuan T., Mori K., Solis A.G., Yamashita M. SARS-CoV-2 Neutralizing Antibody Responses Are More Robust in Patients with Severe Disease. bioRxiv. 2020 doi: 10.1080/22221751.2020.1823890. 2020.2006.2013.150250. [DOI] [PMC free article] [PubMed] [Google Scholar]
- Wu X., Guo J., Niu M., An M., Liu L., Wang H., Jin X., Zhang Q., Lam K.S., Wu T. Tandem bispecific neutralizing antibody eliminates HIV-1 infection in humanized mice. J. Clin. Invest. 2018;128:2239–2251. doi: 10.1172/JCI96764. [DOI] [PMC free article] [PubMed] [Google Scholar]
- Wu A., Peng Y., Huang B., Ding X., Wang X., Niu P., Meng J., Zhu Z., Zhang Z., Wang J. Genome Composition and Divergence of the Novel Coronavirus (2019-nCoV) Originating in China. Cell Host Microbe. 2020;27:325–328. doi: 10.1016/j.chom.2020.02.001. [DOI] [PMC free article] [PubMed] [Google Scholar]
- Xu X., Gao X. Immunological responses against SARS-coronavirus infection in humans. Cell. Mol. Immunol. 2004;1:119–122. [PubMed] [Google Scholar]
- Xu B., Fan C.Y., Wang A.L., Zou Y.L., Yu Y.H., He C., Xia W.G., Zhang J.X., Miao Q. Suppressed T cell-mediated immunity in patients with COVID-19: A clinical retrospective study in Wuhan, China. J. Infect. 2020;81:e51–e60. doi: 10.1016/j.jinf.2020.04.012. [DOI] [PMC free article] [PubMed] [Google Scholar]
- Yi C.E., Ba L., Zhang L., Ho D.D., Chen Z. Single amino acid substitutions in the severe acute respiratory syndrome coronavirus spike glycoprotein determine viral entry and immunogenicity of a major neutralizing domain. J. Virol. 2005;79:11638–11646. doi: 10.1128/JVI.79.18.11638-11646.2005. [DOI] [PMC free article] [PubMed] [Google Scholar]
- Zhang Z., Wang F.S., Zhao M., Liu J.C., Xu D.P., Jin L., Chen J.M., Wang M., Chu F.L. [Characterization of peripheral dendritic cell subsets and its implication in patients infected with severe acute respiratory syndrome] Zhonghua Yi Xue Za Zhi. 2004;84:22–26. [PubMed] [Google Scholar]
- Zhang L., Zhang F., Yu W., He T., Yu J., Yi C.E., Ba L., Li W., Farzan M., Chen Z. Antibody responses against SARS coronavirus are correlated with disease outcome of infected individuals. J. Med. Virol. 2006;78:1–8. doi: 10.1002/jmv.20499. [DOI] [PMC free article] [PubMed] [Google Scholar]
- Zhao J., Zhao J., Perlman S. T cell responses are required for protection from clinical disease and for virus clearance in severe acute respiratory syndrome coronavirus-infected mice. J. Virol. 2010;84:9318–9325. doi: 10.1128/JVI.01049-10. [DOI] [PMC free article] [PubMed] [Google Scholar]
- Zheng Y., Xu H., Yang M., Zeng Y., Chen H., Liu R., Li Q., Zhang N., Wang D. Epidemiological characteristics and clinical features of 32 critical and 67 noncritical cases of COVID-19 in Chengdu. J. Clin. Virol. 2020;127:104366. doi: 10.1016/j.jcv.2020.104366. [DOI] [PMC free article] [PubMed] [Google Scholar]
- Zhou P., Yang X.L., Wang X.G., Hu B., Zhang L., Zhang W., Si H.R., Zhu Y., Li B., Huang C.L. A pneumonia outbreak associated with a new coronavirus of probable bat origin. Nature. 2020;579:270–273. doi: 10.1038/s41586-020-2012-7. [DOI] [PMC free article] [PubMed] [Google Scholar]
- Zhu N., Zhang D., Wang W., Li X., Yang B., Song J., Zhao X., Huang B., Shi W., Lu R., China Novel Coronavirus Investigating and Research Team A Novel Coronavirus from Patients with Pneumonia in China, 2019. N. Engl. J. Med. 2020;382:727–733. doi: 10.1056/NEJMoa2001017. [DOI] [PMC free article] [PubMed] [Google Scholar]
Associated Data
This section collects any data citations, data availability statements, or supplementary materials included in this article.
Supplementary Materials
Data Availability Statement
The study did not generate any unique datasets or codes.