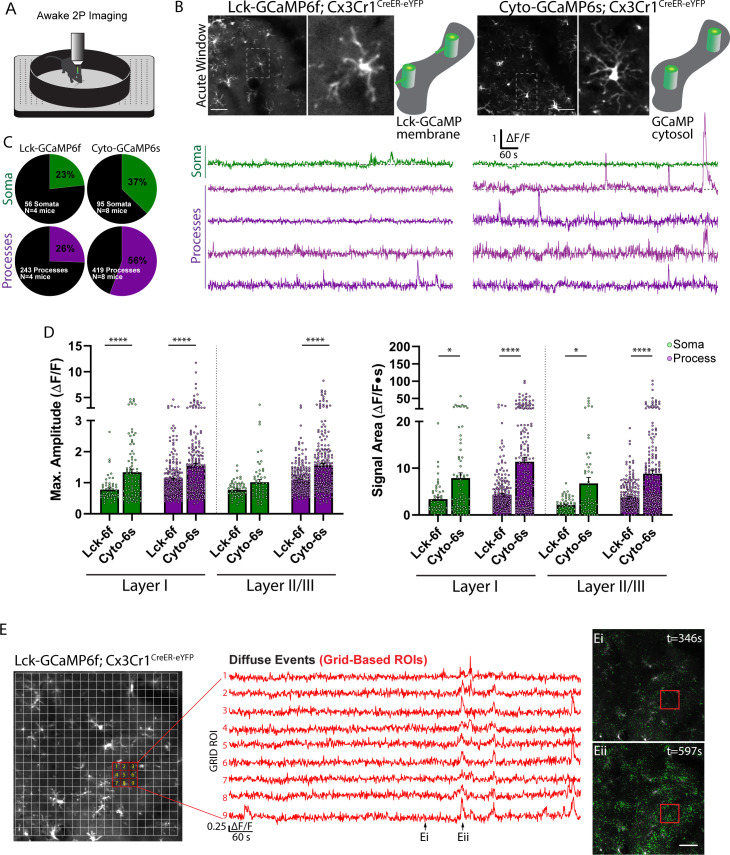
Figure 1. Spontaneous microglial calcium activity reported in the Lck-GCaMP6f and cytosolic GCaMP6s mouse.
(A) Imaging setup: in vivo two-photon imaging of microglial calcium activity in the awake, head-restrained animal. (B) Average intensity projection images and microglial ∆F/F calcium traces reported by Lck-GCaMP6f or cytosolic-GCaMP6s mice with a magnified cell. ∆F/F traces are from the soma and processes of a representative cell using manual segmentation. (C) Percentage of active microdomains reported by each sensor. (D) Maximum amplitude and signal area reported by each sensor (bar: mean ± SEM; dots: individual microdomains; 1-Way ANOVA with Sidak’s post-hoc comparison). (E) The Lck-GCaMP6f mouse reports microglial calcium activity that is widespread, coordinated, and low-level throughout the parenchyma (Eii), compared to periods of relative inactivity (Ei). Scale bar: 50 µm (B and E). *p<0.05, ****p<0.0001. N = 4 Lck-GCaMP6f mice, N = 8 Cyto-GCaMP6s mice.

