Abstract
Label-free microfluidic-based cell sorters leverage innate differences among cells (e.g., size and stiffness), to separate one cell type from another. This sorting step is crucial for many cell-based applications. Polystyrene-based microparticles (MPs) are the current gold standard for calibrating flow-based cell sorters and analyzers; however, the deformation behavior of these rigid materials is drastically different from that of living cells. Given this discrepancy in stiffness, an alternative calibration particle that better reflects cell elasticity is needed for the optimization of new and existing microfluidic devices. Here, we describe the fabrication of cell-like, mechanically tunable MPs and demonstrate their utility in quantifying differences in inertial displacement within a microfluidic constriction device as a function of particle elastic modulus, for the first time. Monodisperse, fluorescent, cell-like microparticles that replicate the size and modulus of living cells were fabricated from polyacrylamide within a microfluidic droplet generator and characterized via optical and atomic force microscopy. Trajectories of our cell-like MPs were mapped within the constriction device to predict where living cells of similar size/modulus would move. Calibration of the device with our MPs showed that inertial displacement depends on both particle size and modulus, with large/soft MPs migrating further toward the channel centerline than small/stiff MPs. The mapped trajectories also indicated that MP modulus contributed proportionally more to particle displacement than size, for the physiologically relevant ranges tested. The large shift in focusing position quantified here emphasizes the need for physiologically relevant, deformable MPs for calibrating and optimizing microfluidic separation platforms.
I. INTRODUCTION
Polymer microparticles (MPs) have long been used in both clinical and research settings, with applications ranging from calibration standards to drug delivery to tissue engineering and more.1 These MPs have been fabricated using many techniques, including but not limited to, microfluidic platforms,2,3 layer-by-layer deposition,4 and emulsification.5,6 In recent years, efforts have been made to fabricate MPs that better mimic cellular mechanical properties to further reproduce cell behavior in experimental systems.7 Our recently developed cell-like MPs aim to replicate these physical characteristics of cells while allowing for additional modifications to their surface or internal composition through standard chemistries. Currently, rigid polymer microspheres made from materials such as polystyrene (PS) latex are used for calibrating fluorescence-activated cell sorters (FACSs), Coulter counters, and microfluidic-based sorters.8 However, the nominal elastic modulus of PS is GPa,9 which is roughly six orders of magnitude higher than that of living cells ( kPa).10 This drastic difference in stiffness raises questions as to whether these rigid materials can serve appropriately as calibration particles or cell surrogates in testing systems with micro-environmental stresses large enough to induce deformation, such as within fluidic channels.
Characterization and/or isolation of cellular subpopulations based on their mechanical properties is an increasingly common goal since this phenotype correlates to molecular signatures.11 Mechanical differences have been observed during cell cycle regulation,12 differentiation,13 immune-cell activation,14 malignancy,15 and disease state (e.g., osteoarthritis,16 etc.). Currently, researchers use conventional methods such as FACS to separate these cells based on biological surface markers. Recently, researchers have employed microfluidic platforms that are capable of interrogating deformability differences within populations of cells.17 Such devices include straight channel inertial microfluidics,18 curved channels,19 bluff-body obstacles,20 and abrupt changes in a channel cross section.21 Each separation modality has inherent advantages and disadvantages, as well as trade-offs in device complexity and cost. To properly assess the performance of these novel microfluidic devices and to enable improved predictive models, a calibration particle is needed that more appropriately replicates cell behavior in flow.
In this work, we test the hypothesis of using physiologically relevant MPs for calibration within a simple microchannel device that inertially focuses particles within and downstream of a single short constriction, previously reported by Faivre et al.22 Inertial focusing is driven by two competing forces, the shear-gradient lift force, which acts down the gradient in shear rate, and the wall effect lift force directed away from the wall. The shear-gradient lift force is driven by the shape of the fluid velocity profile near the particle, while the wall effect lift force depends on the proximity of the nearby wall. The wall disrupts the axisymmetry of the wake vorticity generated on the surface of the particle.23–25 We expect different focusing behavior for the deformable MPs compared to rigid, PS particles of similar size due to more complex fluid–structure interactions as the particle deforms in the flow field. The resulting force has been termed the deformability-induced lift force.18,19,26 This additional force predominately shifts particle equilibrium positions away from walls within microchannels.27,28
The goal of this study was to investigate the relative effect of particle elastic modulus on the focusing behavior within a shear field using deformable MPs of controlled size and modulus within physiologically relevant ranges. First, we describe the fabrication methods used to create a flow-focusing droplet generator from rigid, inert, autoclave sterilizable, and reusable materials. The process we developed allows for rapid prototyping of different geometries where the time from design conception to working device is less than 2 h. We then highlight the fabrication and characterization of our novel deformable MPs and demonstrate the capabilities of the droplet generator in a production-like test run, where MPs were produced with no user intervention over a 2-h period. Finally, using a simple microfluidic constriction device to achieve the inertial displacement of particles, we show that our deformable MPs allowed us to examine the size-stiffness effects on this displacement in a controlled manner. Once the constriction device was calibrated with our deformable particles, we measured cell displacement of two human cell lines of different elastic moduli and compared against calculated displacement values derived from the calibration, showing good agreement.
II. METHODS
A. Cell-like microparticle fabrication
1. Droplet generator device design and fabrication
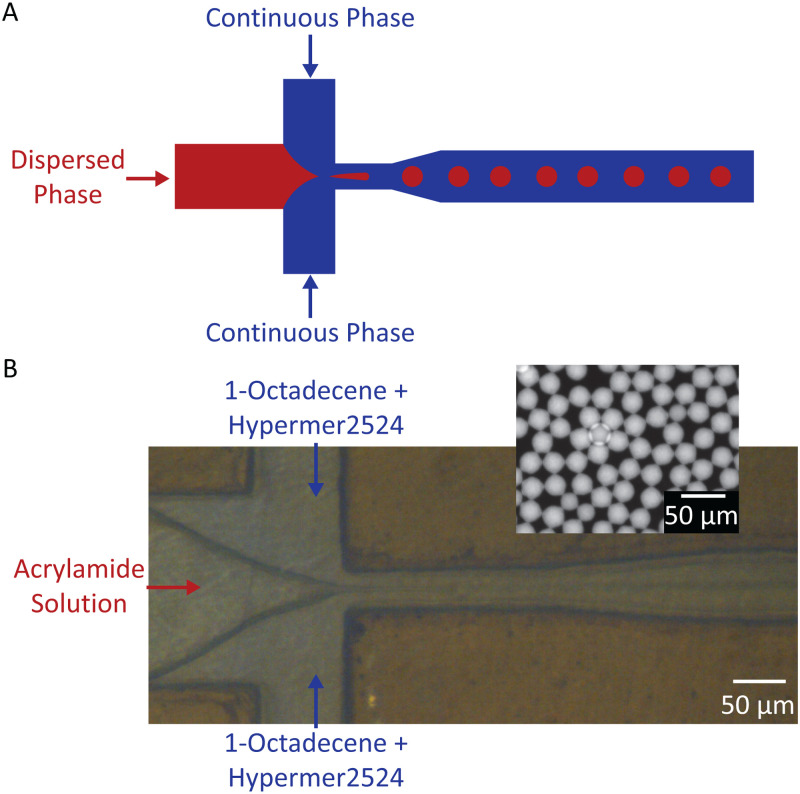
Cell-like MPs made of polyacrylamide were produced using a microfluidic flow-focusing droplet generator, based on designs previously shown to produce monodisperse droplets.29 The droplet generator configuration is shown in Fig. 1. Theoretical and experimental data generated by others30,31 were adapted and used as conditions and constraints, in addition to our own empirical findings, for device optimization. All materials of the droplet generator were chosen for their high rigidity, chemical stability, and glass transition temperature as well as good optical clarity for real-time observation. The combination of these materials made for a rigid, biocompatible, and autoclave-sterilizable device.
FIG. 1.
(a) Illustration of flow-focusing droplet generating device, where red is the dispersed phase (microdroplets) and blue is the continuous phase (fluid surrounding the droplets). (b) Image of droplet generator device with acrylamide solution serving as the dispersed phase and 1-octadecene + Hypermer 2524 serving as the continuous phase (inset: fluorescent image of polyacrylamide droplets collected from the device outlet).
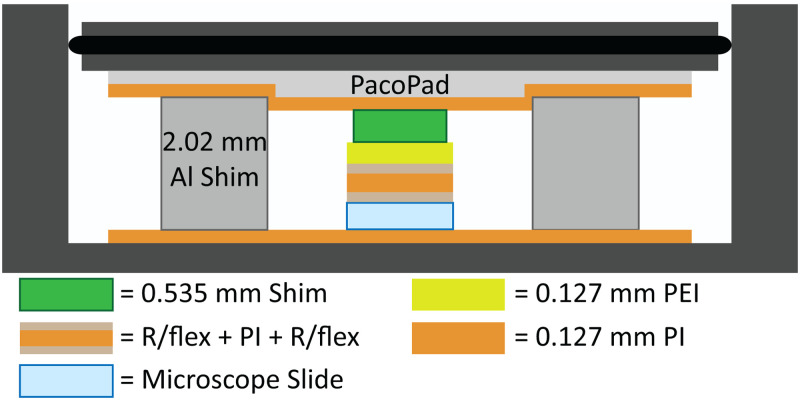
For all flow-focusing droplet generator devices, a mm pre-cleaned glass microscope slide served as the device base. Channel features were UV laser machined (LPKF ProtoLaser U4, LPKF Laser & Electronics AG) into a 0.025 mm-thick Kapton type HN polyimide (PI, CS Hyde Company) film, while channel cover features were cut from pre-annealed 0.127 mm polyetherimide (PEI, McMaster-Carr) using similar methods. R/flex® 1000 dry film adhesive (Rogers Corporation) was used to bond the three layers. The device was laminated at C for 1 h,32 with MPa pressure applied to the top layer of the device33 within a two-chamber custom laminator,34 as shown in Fig. 2. Compressible fiberboard (1.5 mm thick, PacoPad, Pacothane Technologies), a custom PEI/PI 0.535 mm thick support shim, and aluminum shims were used to facilitate even distribution of force.33,35 Additional device fabrication information can be found in the supplementary material.
FIG. 2.
Diagram of the material stack within a two-chamber laminator (not to scale). Al: aluminum.
Polycarbonate (PC) inlet and outlet covers were machined using a desktop micro-mill (Bantam Tools). Top covers were made from 3/8 in.-thick, clear PC sheets to accommodate 1/4-28 polyether ether ketone (PEEK) chromatography fittings, while bottom covers were 1/4 in. thick. To create a seal, two laser-machined gaskets were made from 0.508 mm-thick Viton fluoroelastomer (Aaa-Acme Rubber Co.). These gaskets were inserted between the inlet and outlet two-piece compression covers and the flow-focusing droplet generator.
The completed fluidic channels were surface treated by manually injecting Aquapel (Aquapel Glass Treatment) into the device, incubating at room temperature for 15 min, and flushing with nitrogen, leaving a thin, hydrophobic coating of the chemical along channel walls.36 All devices were treated at least 24 h prior to operation.
2. Microparticle solution preparation
The continuous phase of the emulsion consisted of 1% weight mixture of Hypermer 2524 surfactant (Croda International) in 1-octadecene (technical grade, 90%, MilliporeSigma), mixed until monophasic. The solution was degassed for at least 3 h, backfilled with nitrogen for 10 min, and then stored within a nitrogen chamber. Prior to use, the solution was passed through a 0.4 m syringe filter.
The dispersed phase of the emulsion consisted of defined ratios of acrylamide (40% acrylamide stock solution, Bio-Rad), bis-acrylamide (2% bis-acrylamide stock solution, Bio-Rad), ammonium persulfate (APS, MilliporeSigma), lithium phenyl-2,4,6-trimethylbenzoylphosphinate (LAP, , MilliporeSigma), liquid ink (Sharpie), and de-ionized (DI) water. The addition of liquid ink, extracted from consumer highlighter pens, produced uniform fluorescent staining throughout the particle, without requiring any additional staining. A final solution of 5 ml was prepared with 5 mg of APS, 2.5 mg of LAP, and 50 l of Sharpie ink in DI water. Percentage of monomer and crosslinker were varied to achieve different MP moduli (Table S1 in the supplementary material). Contents were vortexed and placed in a vacuum desiccator for 20 min and then backfilled with nitrogen for 5 min. Prior to use, the solution was filtered using a 0.2 m syringe filter.
3. Microparticle production
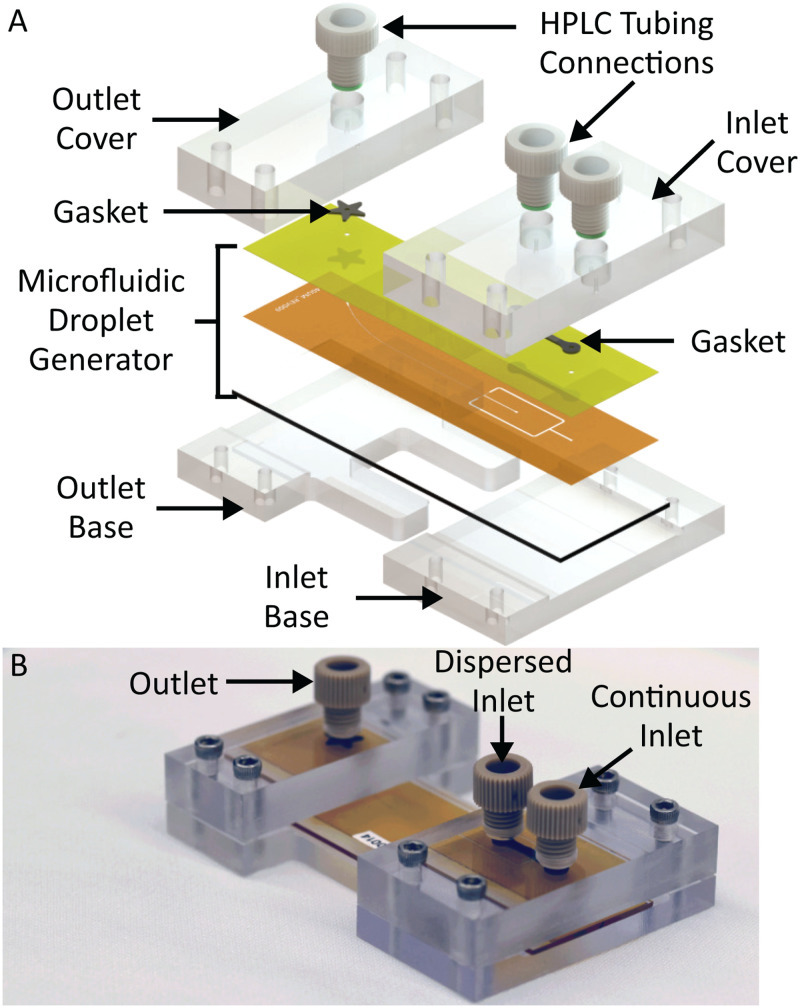
Continuous and dispersed phase solutions were loaded into 10- and 1-ml plastic syringes, respectively. PEEK tubing (0.015 in. inner diameter, 1/32 in. outer diameter, IDEX Health & Science, LLC) was secured to the inlet port and polytetrafluoroethylene tubing (0.012 in. inner diameter, 0.030 in. outer diameter, Cole-Parmer) to the outlet port with 1/4-28 PEEK connectors. The gaskets were sandwiched between the droplet generator and compression cover (Fig. 3).
FIG. 3.
(a) Exploded view of device assembly, highlighting the PEEK connectors (HPLC tubing connections), PC compression covers, compliant fluoroelastomer (gasket), and microfluidic droplet generator assembly. (b) Photograph of the assembled droplet generator.
Solutions were injected into the system by a syringe pump (Harvard Apparatus Pump 33 DDS, Harvard Apparatus). The device was primed with continuous phase solution, followed by the introduction of the dispersed phase. Visual observation of droplet size determined the chosen flow rates. Additional information regarding droplet size capabilities for the flow-focusing droplet generator is discussed in the supplementary material. The system was allowed to stabilize for at least 5 min prior to collecting or measuring the sample. Droplet size was measured via optical microscopy. Droplets were collected in a 1.5 ml centrifuge tube with a 365 nm UV LED placed above it for initial curing. Droplet generation was monitored with a digital microscope (Meros High Speed Digital Microscope). Samples in suspension were further cured in a 365 nm UV chamber for 3 h, with nitrogen purge for the first 30 min. Once particles were cured, MPs were cleaned with filtered 0.1% Triton X-100 (MilliporeSigma) three times via centrifugation and then an additional three times with filtered DI water. Particles were stored in DI water.
4. Microparticle and cell characterization
Following particle generation, MPs were diluted in filtered DI water and counted by hemocytometer. For size measurement, aliquots of MP suspensions were dispensed onto coverslips, which had been cleaned with atmospheric plasma for 1 min (PDC-001, Harrick Plasma) to improve MP adhesion to the glass. Particles were allowed to settle for 15 min. Those that remained on the focal plane of the coverslip were digitally imaged and descriptive statistics were calculated for each lot using a custom image processing script written in MATLAB.
The elastic properties of individual MPs were characterized via indentation testing with an MFP-3D-BIO atomic force microscope (AFM, Oxford Instruments). A tip-less, silicon nitride cantilever (MLCT10, spring constant N/m, Bruker Corporation) was tipped with a 5 m diameter, PS bead (Microbeads AS).1 Using an approach velocity of 5 m/s, particles were indented with sufficient force (0.6-6 nN), dependent on the elastic modulus of the MP, to result in m of indentation. The elastic modulus was calculated from force vs indentation curves using a modified, thin-layer Hertz model as described previously.37
Human cell lines tested in this study included HepG2 liver cancer cells and MG-63 osteosarcoma cells, because they were of similar size but different elastic modulus. Cells were suspended in Minimum Essential Medium Eagle (MEM 1X, Cellgro) containing 10% fetal bovine serum (FBS, Zen-Bio) and 1% penicillin-streptomycin (P/S, Hyclone) and stained with 1 M calcein AM (MilliporeSigma) for size visualization. A 50 l aliquot of suspended cells was placed on a glass coverslip and allowed to settle for 30 min prior to size measurement as described above. The elastic modulus of each cell type was measured using a trigger force of nN. All optical and AFM measurements were made within 4 h of thawing cells.
B. Inertial displacement of microparticles and cells
1. Constriction device fabrication
A positive mold was fabricated from a laser machined 0.075 mm-thick PI film bonded to glass using similar processes to those described for the droplet generator device. We fabricated a constriction width of 60 m, a constriction length of 400 m, a main channel width of 240 m, and a channel height of 75 m. Standard soft lithography methods were used to create polydimethylsiloxane (PDMS) microfluidic channels from the polyimide-glass master. Channel walls were then treated with filtered 0.5% Tween 20 (MilliporeSigma) for at least 1 h. Ports were punched using a standard beveled punch for 1/32 in. outer diameter PEEK tubing.
2. Microparticle and cell displacement
Cell-like MPs of varying size and stiffness and rigid PS particles were flowed through the constriction device to visually map their trajectories. PS microspheres of 12.5 m radius (Analytical Standard, MilliporeSigma) were fluorescently stained with Rhodamine B (MilliporeSigma) using gradual solvent evaporation.38 PS and cell-like MPs were diluted to particles per ml in filtered 0.01% Tween 20 solution. Similarly, cells were diluted to per ml in a culture medium. Note that a concentration of 80 000 particles/ml is orders of magnitude lower than the critical threshold, termed length fraction, which is the limit established for steric interactions between particles.24
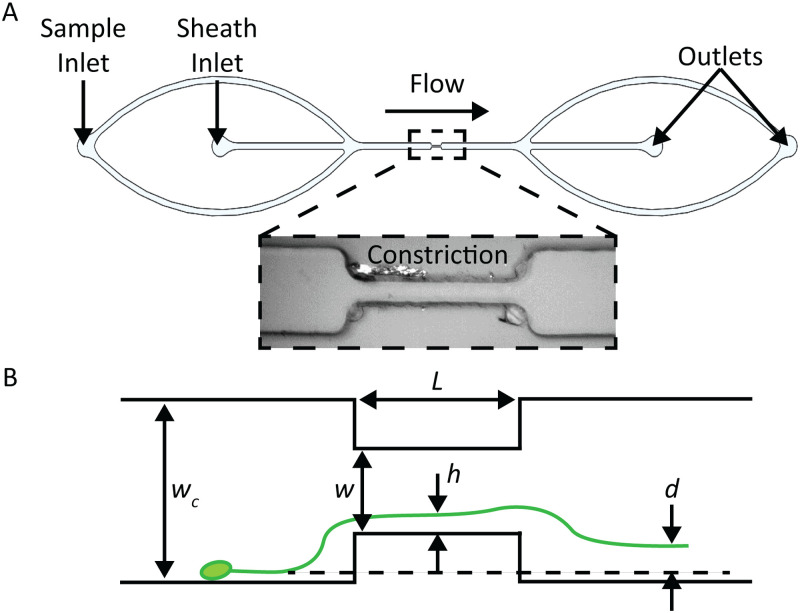
The particle/cell suspensions were continuously agitated (Magnetic Tumble Stirrer, V&P Scientific, Inc.) to reduce settling prior to injection into the system by a syringe pump. Sheath fluid (0.01% Tween 20) was used to position particles close to the walls upstream of the microfluidic constriction. The total volumetric flow rate for separation experiments was 50 l/min, with 75% sheath flow in the center inlet. Figure 4 illustrates sheath and sample inlets; both outlet flows were collected into the same collection tube, so particles could be reused for subsequent studies.
FIG. 4.
(a) Diagram of constriction device, indicating the location of sample and sheath inlets (inset: bright field image of constriction region in the microchannel). (b) Illustration of constriction device indicating key geometric and measurement variables. Variable is the distance of the particle to the wall within the constriction, and is the particle displacement.
Trajectories were imaged by taking long-exposure images in succession and analyzed as described below. At least 30 images were taken for each experimental condition in 1 s intervals. Exposure time was chosen so that particles would traverse the entire field of view. A zero condition was used for image processing purposes where no particles were present inside the channel. Cell displacement experiments were performed within 4 h of thawing. Each experiment was performed three times.
3. Image processing and quantification of microparticle and cell displacement
To compare inertial displacement of the particles within the constriction device, trajectories were imaged with a ZEISS Axio Zoom.V16 microscope (Carl Zeiss AG) and Retiga R6 camera (Teledyne QImaging). Images were imported into ImageJ as stacks.39 We used a highly dilute sample to allow for image capture of single-particle trajectories. During contiguous imaging sessions, frames containing clear particle trajectories () were aligned using the normalized correlation coefficient matching method within the Align slices plug-in. Areas outside of the channel features were reduced or removed entirely during post-processing; channel edges were removed for clarity of presented figures. The stacks were projected using the average intensity output values present at that pixel location among all frames.22 The background was then leveled using the “rolling ball” algorithm, where the radius of the ball was determined by the largest non-background object.40 Image contrast was then adjusted such that the mean trajectory pixel values for each lot were similar for color stacking purposes. The distance from the center of the particle trace to the channel wall was measured for each average projected stack, upstream and downstream of the constriction. The difference between the upstream and downstream measured values defined the particle displacement, “” in Fig. 4(b). The distances from the wall were measured far enough upstream and downstream of the constriction that the trajectory was parallel to the channel wall (i.e., terminal focusing position).
4. Statistical analysis
Analyses of MP properties and particle mean displacement were implemented to quantify the statistical significance of results. One-way analysis of variance (ANOVA) was used to compare MP lot sizes and elastic moduli and final particle trajectories downstream of the constriction. We also used a two-way ANOVA to compare cell elastic moduli measurements between cell types using either AFM or the constriction device methodologies. All statistical tests used a p-value threshold of 0.01 for significance. 0.01 was chosen to reproduce similar, production capability analysis techniques (e.g., statistical process control) that utilize a threshold at three standard deviations about the sample mean.41
III. RESULTS
A. Microparticle size and elastic modulus
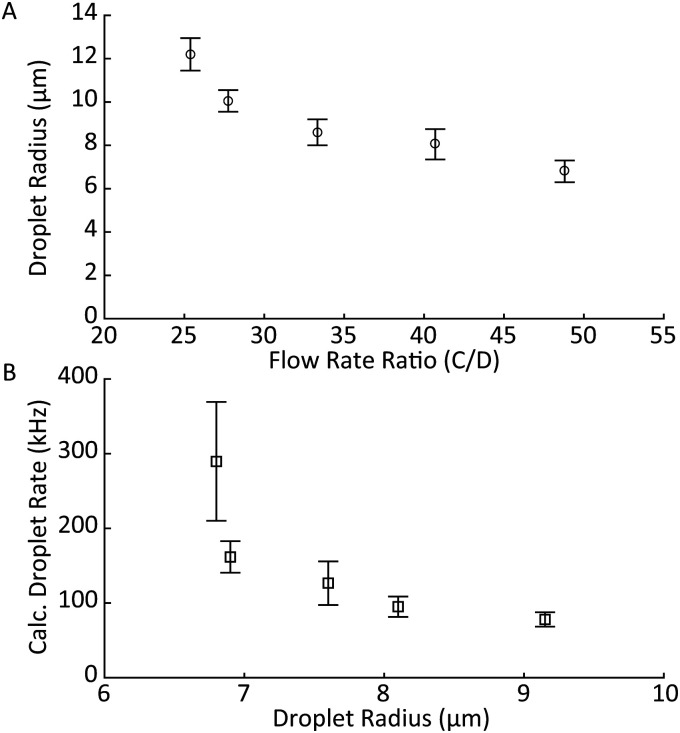
Monodisperse lots of cell-like MPs were successfully fabricated to allow experiments that decoupled size and elastic modulus in relation to particle displacement in a fluidic channel. MP size was controlled by adjusting the ratio of the continuous-to-dispersed phase flow rate in the droplet generator. For a constant formulation, we were able to fabricate particle lots of varying sizes with real-time feedback from the digital microscope positioned above the orifice. Liquid droplets of the uncured acrylamide solution were sampled directly from the outlet to allow for flow rate adjustments to achieve a desired, final, cured MP size. Representative results for a single, 0.2 kPa MP formulation are shown in Fig. 5.
FIG. 5.
Representative results of the cell-like MP fabrication process. (a) Droplet radius ( standard deviation) as a function of continuous-to-dispersed phase flow rate ratio. (b) Calculated droplet generation rate as a function of droplet radius. Droplets production rate increased when the dispersed phase flow rate increased and continuous-to-dispersed flow ratio was maintained.
Increasing the ratio of continuous-to-dispersed flow rates resulted in a smaller droplet radius [Fig. 5(a)]. Increasing the continuous phase rate while keeping the dispersed phase rate constant resulted in smaller droplets as well as an increased droplet rate [Fig. 5(b)]. The droplet rate was calculated by dividing the dispersed flow rate by the average droplet volume, which was calculated and measured via optical microscopy.42 Droplet volume was calculated pre-polymerization, as we observed that MPs would swell once suspended in DI water. MP elastic modulus was controlled by the acrylamide-to-bis-acrylamide ratio, with increasing bis percentages leading to less deformable particles following polymer curing.
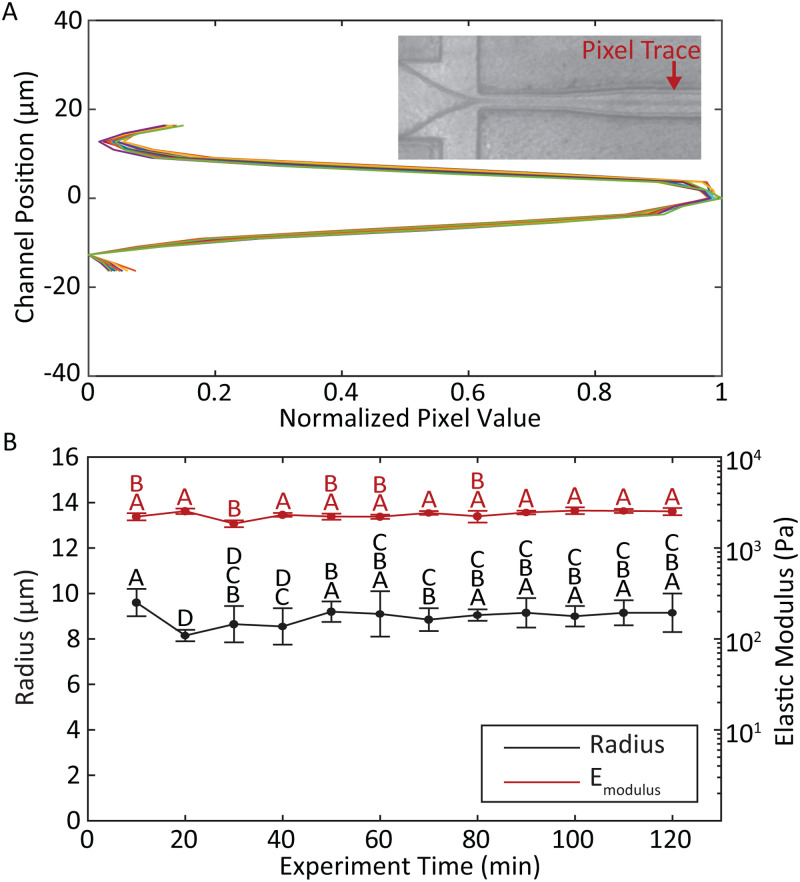
To test the stability of the particle generator over an extended operation, we allowed the system to run for 2 h without intervention, collecting samples in 10-min increments to produce 12 lots that were analyzed individually. Figure 6 shows the stability of the droplet size and stream immediately following droplet pinchoff over the duration of the run. An approximation of droplet size was obtained in real-time by measuring the width of the pixel trace associated with the droplet stream [Fig. 6(a)]. These sizes matched well to post-production measurements of the particles [Fig. 6(b)].
FIG. 6.
(a) Real-time measurement of the droplet size was obtained by plotting normalized pixel values across the channel at a fixed position downstream of the pinch-off point. Representative traces were taken at 10-min increments for the duration of the 2-h long MP production run. The closely overlapping traces indicate highly consistent droplet sizes over time (inset: sample screenshot of flow-focusing droplet generator indicating the location of pixel sampling). (b) Post-cure MP radius (black) and elastic modulus (red) with standard deviation for each 10-min sample group. Letters above data points indicate groups of statistical similarity ().
Pooling the 12 lots together as a single experiment produced an average radius of m. Eliminating lots taken during the first 30 min, which exhibited more instability than later in the run, resulted in an average radius of . The elastic modulus of the pooled samples was kPa. The coefficient of variation (CV) for all lots combined remained less than 4% for size and 9% for elastic modulus. Comparisons of size and modulus for samples across the entire production run showed few statistically significant differences among lots. No significant differences were observed among lots taken after 40 min of run time [, Fig. 6(b)]. It should be noted that previous reports describing polyacrylamide-based hydrogel MP generation were limited to production runs of less than 20 min before polymerization became either inconsistent or ceased completely.43
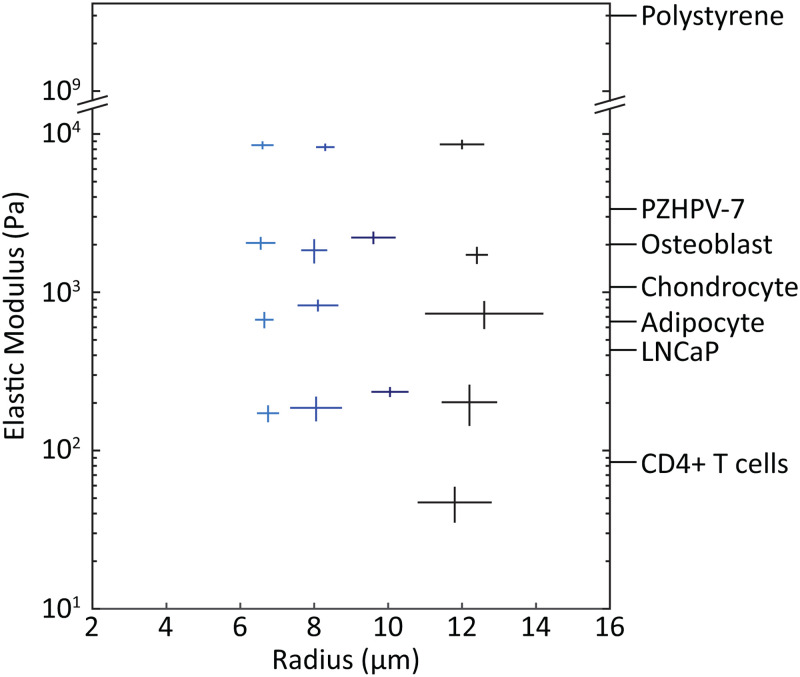
Following optimization experiments, we completed 15 MP production runs to acquire lots that spanned a range of physiologically relevant sizes and moduli, varying only one parameter at a time (Fig. 7). Overall, mean radius of particles in the lots ranged from 6.5 to 12.6 m, and mean modulus from 0.05 to 8.6 kPa. These MPs formed a calibration matrix for testing the microfluidic constriction device shown in Fig. 4. Each MP lot was statistically distinct in both size and elastic modulus (Fig. S1 in the supplementary material).
FIG. 7.
Calibration-grade, deformable MPs were fabricated across a range of physiologically relevant cell sizes and moduli. Each cross indicates a MP lot fabricated under tuned conditions with the droplet generator. Horizontal and vertical line length indicates one standard deviation in both positive and negative directions from the sample mean for MP radii and elastic modulus, respectively. For comparison, labels on the right axis show typical measured values of elastic modulus for a variety of cell types. PZHPV-7 and LNCaP are normal and cancerous prostate cell lines, respectively.44 Human osteoblast, chondrocyte, and adipocyte measurements were taken in the spherical conformation to more closely mimic their state in a flow channel.10 Primary CD4+ T cells were measured in spherical morphology as well.45
B. Separation of microparticles by size and modulus in constriction device
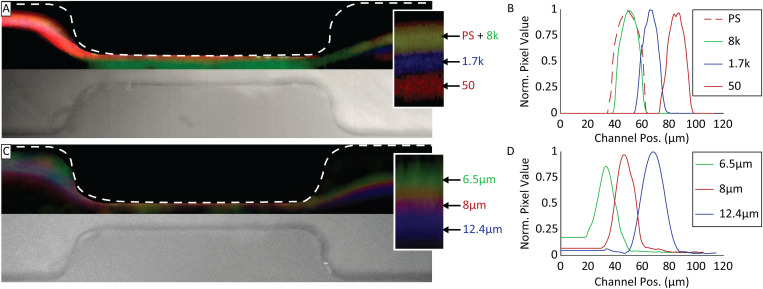
Having prepared particles with differing properties of size and modulus, we measured their lateral displacement after passing through the narrow segment of the constriction device. The displacement, , is defined as shown in Fig. 4. Cell-like MPs of similar size ( m radius) but varying moduli were flowed into the microfluidic constriction device, and their trajectories recorded to measure particle displacement [Figs. 8(a) and 8(b)]. Results showed that the trajectories for PS and 8 kPa MPs overlapped. Comparatively, mean displacements for 1.7 and 0.050 kPa MPs were 13 and 31 m, respectively, further from the channel wall. Comparison of PS to cell-like MP trajectories showed 8 kPa MPs were statistically similar to PS (), while 1.7 and 0.05 kPa MPs were different from PS ().
FIG. 8.
(a) Composite false color image of cell-like MP and PS particle separation by elastic modulus in a microfluidic constriction device, with a particle radius of m (inset: magnification of particle trajectories with particle modulus labels in Pa). (b) Normalized pixel value traces of cell-like MP and PS particle trajectories after constriction, where 0 is the channel wall. (c) Composite false color image of MP separation by size in a microfluidic constriction device, particle elastic modulus kPa (inset: magnification of particle trajectories with particle radius labels). (d) Normalized pixel value traces of particle trajectories after constriction.
MPs of similar moduli ( kPa) but varying sizes were also tested in the microfluidic constriction device [Figs. 8(c) and 8(d)]. As expected, we observed a size-dependent shift in particle trajectories, where particle groups with radii of 8 and 12.4 m shifted 13 and 35 m further from the wall, respectively, compared to the 6.5 m particle. The observed size-dependent displacement agrees with previously reported measurements.22 All three groups were statistically different from each other ().
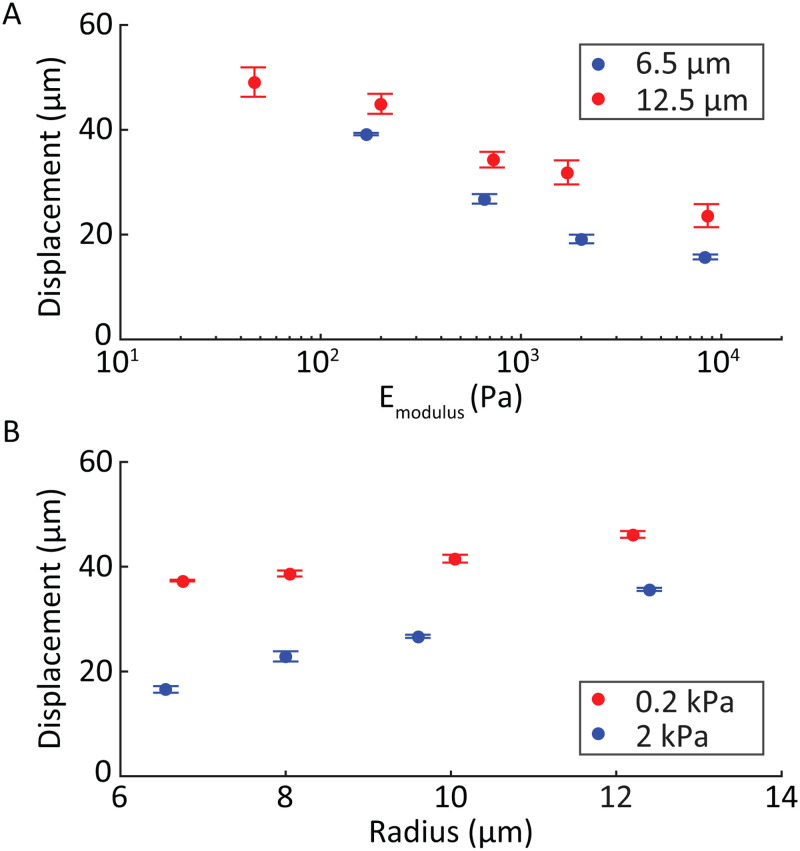
The particle mean displacement as a function of elastic modulus for two example sizes was plotted [Fig. 9(a)] and found to monotonically decrease with increasing modulus. Mean displacement as a function of the undeformed particle radii for two example moduli [Fig. 9(b)] follows a linear trend with larger particles displacing more than smaller particles of similar moduli.
FIG. 9.
(a) Particle displacement of cell-like MPs based on their elastic modulus for two representative sizes (6.5 and 12.5 m radius). (b) Mean displacement of MPs based on their size for two representative elastic moduli (0.2 and 2 kPa). Steeper slopes were observed for elastic modulus compared to size, when varied over physiological ranges.
C. Separation of human cell types
To evaluate whether the elasticity-driven displacements present for ideal microparticles could also be observed in cells, HepG2 and MG-63 human cell lines were tested in the microfluidic constriction device. As noted above, these cell types were chosen because they are similar in size but significantly different in modulus. Independent measurements using optical microscopy and AFM showed that HepG2 cells have a radius of and an elastic modulus of kPa. MG-63 cells have a radius of and elastic modulus of kPa. When flowed through the constriction device, we observed an average displacement of for HepG2 cells and for MG-63 cells (). Similar to the behavior of the cell-like MPs, the higher modulus MG-63 cells displaced less than the lower modulus HepG2 cells.
IV. DISCUSSION
This study used physiologically relevant, deformable MPs to empirically characterize how particle size and elastic modulus influenced their trajectories within a microfluidic device. Currently, particle size dependency for inertial focusing is well understood, with analytical solutions to idealized situations having been previously reported.28,46–48 While the dependence on size has been extensively analyzed, much less is known regarding the dependence on elastic modulus.18,19 This has been an active area of interest for deformation cytometry, particularly the development of solutions that capture the complexities of a deformable particle within a deformation-inducing shear field. A selection of these analytical and computational methods and their inherent strengths and limitations are described in depth by Razavi Bazaz et al.49 To circumvent many of the complexities and limitations of the current computational and analytical methods, we used an experimental approach.
To begin, we first constructed a flow-focusing droplet generator to fabricate monodisperse MPs of defined size and modulus within the physiological range. Our device could produce consistent droplets at rates upward of 100s kHz from a single nozzle, which is one-to-two orders of magnitude greater than previously reported, single orifice, flow-focusing droplet generators.50 Using these deformable MPs, we showed that in a straight microchannel with a short constriction segment, particle trajectories depended on both size and elasticity, but to different degrees. Our novel, cell-like MPs were better suited for studying this phenomenon than the gold-standard PS particles, which are orders of magnitude stiffer. Results showed that particle displacement in a shear field was strongly dependent on elastic modulus and less so on size, when considering particles with properties within the physiological range of most cells.
In the current work, we examined how our calibration-quality MPs could be used to better study a representative, microfluidic constriction device adapted from Faivre et al.22 Their work incorporated a previous study by Olla,51 which looked at cross-streamline drift (i.e., displacement) within a high shear region. Faivre et al. arrived at the following relation for particle displacement, , due to the constriction:
| (1) |
where is a dimensionless parameter dependent on orientation and shape of the particle, is the length of the constriction, is the particle radius, is the width of the main channel, is the width of the constriction, and is the distance of the particle to the wall within the constriction [Fig. 4(b)]. Thus, while the relation describes how displacement depends on the size of a (spherical) particle and geometry of the constriction, the factor remains unspecified and was proposed to reflect changes in particle shape due to deformation.
By knowing the elastic modulus of our MPs, we are in a position to extend this model to explicitly incorporate that property into the analysis. First, we calculated using Eq. (1) with the measured particle displacements for our cell-like MPs of controlled size and modulus. These calculated values agreed well with those previously reported, which ranged from 0.01 to 0.45 for red blood cells.22,51 When plotting vs particle radius or modulus alone, a discernible trend was only observed for modulus.
To examine the dependence of on elastic modulus , we first defined a non-dimensional elastic modulus , incorporating the quantities that determine the shear stress in the constriction,52
| (2) |
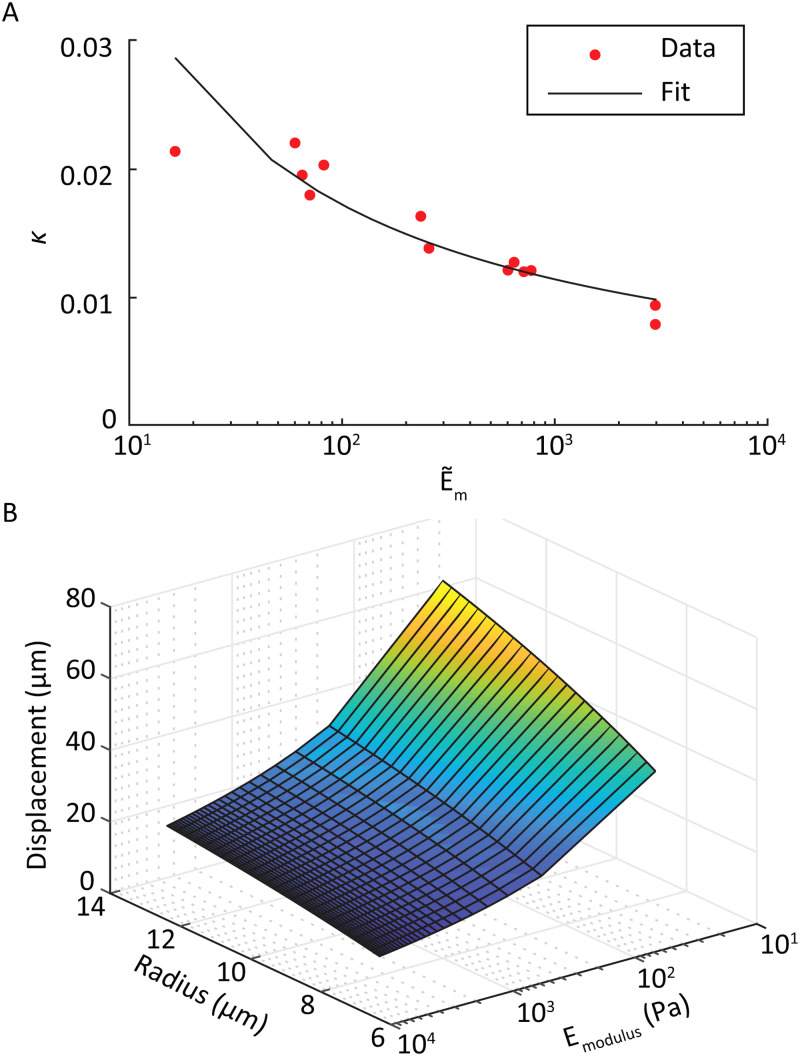
where is the channel height, is the volumetric flow rate, and is the dynamic viscosity of the fluid. Plotting the values in this form and fitting to the measured data [Fig. 10(a)], we found a satisfactory approximation for particle displacement, , as a function of its radius and elastic modulus
| (3) |
with
| (4) |
FIG. 10.
(a) Logarithmic fit for the variable as a function of MP elastic modulus. (b) Surface plot of the particle displacement as a function of both MP radius and elastic modulus.
Optimal fits of experimental data required the inclusion of two dimensionless parameters in Eq. (4). The first incorporates the blockage ratio of the system,53 defined as with being the hydraulic diameter of the constriction. The second, , is the fitted parameter specific to this device, , for the curve shown in Fig. 10(a). Combining Eqs. (3) and (4) results in
| (5) |
The expansion to two independent variables produces an equation that describes a smooth monotonic surface with respect to particle radius and elastic modulus [Fig. 10(b)].
To evaluate the suitability of Eq. (5) for describing the inertial displacement of living cells in this device, we compared the elastic moduli of HepG2 and MG-63 cell types (of known size) predicted using the microfluidic constriction device trajectories to that of measurements using AFM (Table I). We found no statistical difference between the AFM measurement of modulus and that calculated using the calibrated inertial microfluidic device (, Fig. S2 in the supplementary material). As expected, both measurement methodologies showed a significant difference in elastic modulus between the two cell types (). A sensitivity limit of between cell trajectories existed due to hardware constraints for the microfluidic-based measurement of elastic modulus. This translated to a minimum detectable threshold of 20% difference in elastic modulus.
TABLE I.
AFM- and microfluidic-based measurements of elastic moduli for two cell types. Average moduli and standard deviations are reported.
| Cell line | AFM (kPa) | Constriction device (kPa) |
|---|---|---|
| HepG2 | 0.18 ± 0.04 | 0.17 ± 0.02 |
| MG-63 | 0.71 ± 0.12 | 0.64 ± 0.03 |
The strong dependence of particle focusing position on modulus when placed in deformation-inducing shear fields supports the hypothesis that a new calibration-grade particle is needed that deforms similarly to biological samples. The deformable MPs proposed here exhibited similar behavior to that of the human cell lines tested; other phenomena such as tank-treading, which is primarily observed in erythrocytes, are not likely to be replicated using MPs of this type. With research trending toward more high-throughput sample analysis, researchers have often opted for high flow rate fluidic systems. The associated, higher shear will lead to even larger cell deformations. These microscale deformations have been observed previously by others in microfluidic devices18,19,54 and in the nascent field of deformation cytometry.12,52,55 We believe that by using calibration particles of controlled size and modulus, as presented in this work, researchers will have the tools to properly tune novel systems for applications such as cancer diagnostics,15 disease detection,16 and cell sorting.17–19
V. CONCLUSIONS
We measured the effect of deformability as an independent parameter on particle displacement within a microfluidic constriction device using calibration-grade, deformable MPs that replicated cellular physical properties. MPs of similar size and varying elastic moduli (0.05–10 kPa) were flowed into a channel with a well-defined constriction, and particle displacement from the wall was measured. MPs with moduli kPa followed similar trajectories to rigid, PS particles, while MPs with moduli kPa exhibited significant shifts in equilibrium focusing position toward the centerline of the device, with the magnitude of this shift being strongly dependent on MP modulus. Since most human cells in spherical morphology exhibit moduli below 2 kPa, we believe cell-like MPs are more suitable than PS and other rigid materials for calibrating and optimizing devices that transport cells within deformation-inducing shear fields.
SUPPLEMENTARY MATERIAL
See the supplementary material for further description of the droplet generator fabrication methods, cell-like MP formulations for target elastic moduli used within constriction device, performance of the droplet generator within a production-like setting, and proposed cell-like MP fabrication improvements. Additionally, a detailed statistical comparison of radius and elastic modulus of MPs used to calibrate particle trajectories within constriction device is discussed. Last, the statistical analysis of elastic modulus measurements of the two human cell lines (HepG2 and MG-63) using AFM and MP calibrated constriction device is shown.
ACKNOWLEDGMENTS
The authors acknowledge financial support of the National Institute of Health and National Institute of Arthritis and Musculoskeletal and Skin Diseases (No. R01 AR063642), the National Institute of Health (No. P30 GM122732), and the Draper Fellows Program. The authors thank Dr. Nicholas Labriola, Dr. Charles Lissandrello, Dr. Rebecca Christianson, Dr. Jonathan Coppeta, and Dr. Kenneth Kotz for technical guidance as well as Dr. Kirsty McFarland, Dr. Melissa Sprachman, Dr. Heena Mutha, and Dr. Andrew Magyar for their continual help developing the droplet generation portion of this study.
DATA AVAILABILITY
The data that support the findings of this study are available from the corresponding author upon reasonable request.
REFERENCES
- 1.Labriola N. R., Mathiowitz E., and Darling E. M., “Fabricating polyacrylamide microbeads by inverse emulsification to mimic the size and elasticity of living cells,” Biomater. Sci. 5, 41–45 (2016). 10.1039/c6bm00692b [DOI] [PMC free article] [PubMed] [Google Scholar]
- 2.Christopher G. F. and Anna S. L., “Microfluidic methods for generating continuous droplet streams,” J. Phys. D Appl. Phys. 40, R319–R336 (2007). 10.1088/0022-3727/40/19/R01 [DOI] [Google Scholar]
- 3.Xu S., Nie Z., Seo M., Lewis P., Kumacheva E., Stone H. A., Garstecki P., Weibel D. B., Gitlin I., and Whitesides G. M., “Generation of monodisperse particles by using microfluidics: Control over size, shape, and composition,” Angew. Chem. Int. Ed. Engl. 44, 724–8 (2005). 10.1002/anie.200462226 [DOI] [PubMed] [Google Scholar]
- 4.Lvov Y., Ariga K., Onda M., Ichinose I., and Kunitake T., “Alternate assembly of ordered multilayers of SiO and other nanoparticles and polyions,” Langmuir 13, 6195–6203 (1997). 10.1021/la970517x [DOI] [Google Scholar]
- 5.Leong Y. S. and Candau F., “Inverse microemulsion polymerization,” J. Phys. Chem. 86, 2269–2271 (1982). 10.1021/j100210a001 [DOI] [Google Scholar]
- 6.McAllister K., Sazani P., Adam M., Cho M. J., Rubinstein M., Samulski R. J., and DeSimone J. M., “Polymeric nanogels produced via inverse microemulsion polymerization as potential gene and antisense delivery agents,” J. Am. Chem. Soc. 124, 15198–207 (2002). 10.1021/ja027759q [DOI] [PubMed] [Google Scholar]
- 7.Labriola N. R., Azagury A., Gutierrez R., Mathiowitz E., and Darling E. M., “Concise review: Fabrication, customization, and application of cell mimicking microparticles in stem cell science,” Stem. Cells Transl. Med. 7, 232–240 (2018). 10.1002/sctm.17-0207 [DOI] [PMC free article] [PubMed] [Google Scholar]
- 8.Vembadi A., Menachery A., and Qasaimeh M. A., “Cell cytometry: Review and perspective on biotechnological advances,” Front. Bioeng. Biotechnol. 7, 147 (2019). 10.3389/fbioe.2019.00147 [DOI] [PMC free article] [PubMed] [Google Scholar]
- 9.Guo D., Li J., Xie G., Wang Y., and Luo J., “Elastic properties of polystyrene nanospheres evaluated with atomic force microscopy: Size effect and error analysis,” Langmuir 30, 7206–12 (2014). 10.1021/la501485e [DOI] [PubMed] [Google Scholar]
- 10.Darling E. M., Topel M., Zauscher S., Vail T. P., and Guilak F., “Viscoelastic properties of human mesenchymally-derived stem cells and primary osteoblasts, chondrocytes, and adipocytes,” J. Biomech. 41, 454–64 (2008). 10.1016/j.jbiomech.2007.06.019 [DOI] [PMC free article] [PubMed] [Google Scholar]
- 11.Di Carlo D., “A mechanical biomarker of cell state in medicine,” J. Lab. Autom. 17, 32–42 (2012). 10.1177/2211068211431630 [DOI] [PubMed] [Google Scholar]
- 12.Otto O., Rosendahl P., Mietke A., Golfier S., Herold C., Klaue D., Girardo S., Pagliara S., Ekpenyong A., Jacobi A., Wobus M., Topfner N., Keyser U. F., Mansfeld J., Fischer-Friedrich E., and Guck J., “Real-time deformability cytometry: On-the-fly cell mechanical phenotyping,” Nat. Methods 12, 199–202 (2015). 4 p following 202. 10.1038/nmeth.3281 [DOI] [PubMed] [Google Scholar]
- 13.Guzniczak E., Mohammad Zadeh M., Dempsey F., Jimenez M., Bock H., Whyte G., Willoughby N., and Bridle H., “High-throughput assessment of mechanical properties of stem cell derived red blood cells, toward cellular downstream processing,” Sci. Rep. 7, 14457 (2017). 10.1038/s41598-017-14958-w [DOI] [PMC free article] [PubMed] [Google Scholar]
- 14.Rossy J., Laufer J. M., and Legler D. F., “Role of mechanotransduction and tension in T cell function,” Front. Immunol. 9, 2638 (2018). 10.3389/fimmu.2018.02638 [DOI] [PMC free article] [PubMed] [Google Scholar]
- 15.Guck J., Schinkinger S., Lincoln B., Wottawah F., Ebert S., Romeyke M., Lenz D., Erickson H. M., Ananthakrishnan R., Mitchell D., Kas J., Ulvick S., and Bilby C., “Optical deformability as an inherent cell marker for testing malignant transformation and metastatic competence,” Biophys. J. 88, 3689–98 (2005). 10.1529/biophysj.104.045476 [DOI] [PMC free article] [PubMed] [Google Scholar]
- 16.Darling E. M., Zauscher S., and Guilak F., “Viscoelastic properties of zonal articular chondrocytes measured by atomic force microscopy,” Osteoarthr. Cartil. 14, 571–9 (2006). 10.1016/j.joca.2005.12.003 [DOI] [PubMed] [Google Scholar]
- 17.Hou H. W., Bhagat A. A., Chong A. G., Mao P., Tan K. S., Han J., and Lim C. T., “Deformability based cell margination—A simple microfluidic design for malaria-infected erythrocyte separation,” Lab Chip 10, 2605–13 (2010). 10.1039/c003873c [DOI] [PubMed] [Google Scholar]
- 18.Hur S. C., Henderson-MacLennan N. K., McCabe E. R., and Di Carlo D., “Deformability-based cell classification and enrichment using inertial microfluidics,” Lab Chip 11, 912–20 (2011). 10.1039/c0lc00595a [DOI] [PubMed] [Google Scholar]
- 19.Guzniczak E., Otto O., Whyte G., Willoughby N., Jimenez M., and Bridle H., “Deformability-induced lift force in spiral microchannels for cell separation,” Lab Chip 20, 614-625 (2020). 10.1039/c9lc01000a [DOI] [PubMed] [Google Scholar]
- 20.Beech J. P., Holm S. H., Adolfsson K., and Tegenfeldt J. O., “Sorting cells by size, shape and deformability,” Lab Chip 12, 1048–51 (2012). 10.1039/c2lc21083e [DOI] [PubMed] [Google Scholar]
- 21.Guo Q., Duffy S. P., Matthews K., Islamzada E., and Ma H., “Deformability based cell sorting using microfluidic ratchets enabling phenotypic separation of leukocytes directly from whole blood,” Sci. Rep. 7, 6627 (2017). 10.1038/s41598-017-06865-x [DOI] [PMC free article] [PubMed] [Google Scholar]
- 22.Faivre M., Abkarian M., Bickraj K., and Stone H. A., “Geometrical focusing of cells in a microfluidic device: An approach to separate blood plasma,” Biorheology 43, 147–59 (2006). [PubMed] [Google Scholar]
- 23.Stoecklein D. and Di Carlo D., “Nonlinear microfluidics,” Anal. Chem. 91, 296–314 (2019). 10.1021/acs.analchem.8b05042 [DOI] [PubMed] [Google Scholar]
- 24.Di Carlo D., “Inertial microfluidics,” Lab Chip 9, 3038–46 (2009). 10.1039/b912547g [DOI] [PubMed] [Google Scholar]
- 25.Zeng L., Balachandar S., and Fischer P., “Wall-induced forces on a rigid sphere at finite Reynolds number,” J. Fluid Mech. 536, 1–25 (2005). 10.1017/S0022112005004738 [DOI] [Google Scholar]
- 26.Magnaudet J., Takagi S. H. U., and Legendre D., “Drag, deformation and lateral migration of a buoyant drop moving near a wall,” J. Fluid Mech. 476, 115–157 (2003). 10.1017/S0022112002002902 [DOI] [Google Scholar]
- 27.Chabert M. and Viovy J. L., “Microfluidic high-throughput encapsulation and hydrodynamic self-sorting of single cells,” Proc. Natl. Acad. Sci. U.S.A. 105, 3191–3196 (2008). 10.1073/pnas.0708321105 [DOI] [PMC free article] [PubMed] [Google Scholar]
- 28.Tam C. K. W. and Hyman W. A., “Transverse motion of an elastic sphere in a shear field,” J. Fluid Mech. 59, 177–185 (2006). 10.1017/S0022112073001497 [DOI] [Google Scholar]
- 29.Li Y. K., Liu G. T., Xu J. H., Wang K., and Luo G. S., “A microdevice for producing monodispersed droplets under a jetting flow,” RSC Adv. 5, 27356–27364 (2015). 10.1039/c5ra02397a [DOI] [Google Scholar]
- 30.Gupta A., Matharoo H. S., Makkar D., and Kumar R., “Droplet formation via squeezing mechanism in a microfluidic flow-focusing device,” Comput. Fluids 100, 218–226 (2014). 10.1016/j.compfluid.2014.05.023 [DOI] [Google Scholar]
- 31.Lashkaripour A., Rodriguez C., Ortiz L., and Densmore D., “Performance tuning of microfluidic flow-focusing droplet generators,” Lab Chip 19, 1041–1053 (2019). 10.1039/c8lc01253a [DOI] [PubMed] [Google Scholar]
- 32.Coppeta J. R., Mescher M. J., Isenberg B. C., Spencer A. J., Kim E. S., Lever A. R., Mulhern T. J., Prantil-Baun R., Comolli J. C., and Borenstein J. T., “A portable and reconfigurable multi-organ platform for drug development with onboard microfluidic flow control,” Lab Chip 17, 134–144 (2016). 10.1039/C6LC01236A [DOI] [PMC free article] [PubMed] [Google Scholar]
- 33.Mueller A., Lever A., Nguyen T. V., Comolli J., and Fiering J., “Continuous acoustic separation in a thermoplastic microchannel,” J. Micromech. Microeng. 23, 125006 (2013). 10.1088/0960-1317/23/12/125006 [DOI] [Google Scholar]
- 34.Mescher M. J., Swan E. E., Fiering J., Holmboe M. E., Sewell W. F., Kujawa S. G., McKenna M. J., and Borenstein J. T., “Fabrication methods and performance of low-permeability microfluidic components for a miniaturized wearable drug delivery system,” J. Microelectromech. Syst. 18, 501–510 (2009). 10.1109/JMEMS.2009.2015484 [DOI] [PMC free article] [PubMed] [Google Scholar]
- 35.Dubay R., Lissandrello C., Swierk P., Moore N., Doty D., and Fiering J., “Scalable high-throughput acoustophoresis in arrayed plastic microchannels,” Biomicrofluidics 13, 034105 (2019). 10.1063/1.5096190 [DOI] [PMC free article] [PubMed] [Google Scholar]
- 36.Abate A. R., Lee D., Do T., Holtze C., and Weitz D. A., “Glass coating for PDMS microfluidic channels by solgel methods,” Lab Chip 8, 516–8 (2008). 10.1039/B800001H [DOI] [PubMed] [Google Scholar]
- 37.Dimitriadis E. K., Horkay F., Maresca J., Kachar B., and Chadwick R. S., “Determination of elastic moduli of thin layers of soft material using the atomic force microscope,” Biophys. J. 82, 2798–2810 (2002). 10.1016/S0006-3495(02)75620-8 [DOI] [PMC free article] [PubMed] [Google Scholar]
- 38.Zhang Q., Han Y., Wang W.-C., Zhang L., and Chang J., “Preparation of fluorescent polystyrene microspheres by gradual solvent evaporation method,” Eur. Polym. J. 45, 550–556 (2009). 10.1016/j.eurpolymj.2008.11.016 [DOI] [Google Scholar]
- 39.Schneider C. A., Rasband W. S., and Eliceiri K. W., “NIH image to ImageJ: 25 years of image analysis,” Nat. Methods 9, 671–5 (2012). 10.1038/nmeth.2089 [DOI] [PMC free article] [PubMed] [Google Scholar]
- 40.Sternberg S. R., “Biomedical image processing,” Computer 16, 22–34 (1983). 10.1109/MC.1983.1654163 [DOI] [Google Scholar]
- 41.Rosas Rivera L. A., Hubele N. F., and Lawrence F. P., “Cpk index estimation using data transformation,” Comput. Ind. Eng. 29, 55–58 (1995). 10.1016/0360-8352(95)00045-3 [DOI] [Google Scholar]
- 42.T. D. C. Ltd. “Parallel droplet generation: Demonstration of a parallel droplet generation setup for producing water droplets in hexadecane,” Dolomite Microfluidics, version 2.0, available at https://www.dolomite-microfluidics.com/support/downloads/.
- 43.Girardo S., Traber N., Wagner K., Cojoc G., Herold C., Goswami R., Schlussler R., Abuhattum S., Taubenberger A., Reichel F., Mokbel D., Herbig M., Schurmann M., Muller P., Heida T., Jacobi A., Ulbricht E., Thiele J., Werner C., and Guck J., “Standardized microgel beads as elastic cell mechanical probes,” J. Mater. Chem. B 6, 6245–6261 (2018). 10.1039/c8tb01421c [DOI] [PubMed] [Google Scholar]
- 44.Lekka M., Gil D., Pogoda K., Dulinska-Litewka J., Jach R., Gostek J., Klymenko O., Prauzner-Bechcicki S., Stachura Z., Wiltowska-Zuber J., Okon K., and Laidler P., “Cancer cell detection in tissue sections using AFM,” Arch. Biochem. Biophys. 518, 151–6 (2012). 10.1016/j.abb.2011.12.013. [DOI] [PubMed] [Google Scholar]
- 45.Bufi N., Saitakis M., Dogniaux S., Buschinger O., Bohineust A., Richert A., Maurin M., Hivroz C., and Asnacios A., “Human primary immune cells exhibit distinct mechanical properties that are modified by inflammation,” Biophys. J. 108, 2181–90 (2015). 10.1016/j.bpj.2015.03.047 [DOI] [PMC free article] [PubMed] [Google Scholar]
- 46.Di Carlo D., Edd J. F., Humphry K. J., Stone H. A., and Toner M., “Particle segregation and dynamics in confined flows,” Phys. Rev. Lett. 102, 094503 (2009). 10.1103/PhysRevLett.102.094503 [DOI] [PMC free article] [PubMed] [Google Scholar]
- 47.Ho B. P. and Leal L. G., “Inertial migration of rigid spheres in two-dimensional unidirectional flows,” J. Fluid Mech. 65, 365–400 (2006). 10.1017/S0022112074001431 [DOI] [Google Scholar]
- 48.Matas J.-P., Morris J. F., and Guazzelli E., “Lateral force on a rigid sphere in large-inertia laminar pipe flow,” J. Fluid Mech. 621, 59–67 (2009). 10.1017/S0022112008004977 [DOI] [Google Scholar]
- 49.Razavi Bazaz S., Mashhadian A., Ehsani A., Saha S. C., Kruger T., and Ebrahimi Warkiani M., “Computational inertial microfluidics: A review,” Lab Chip 20, 1023–1048 (2020). 10.1039/c9lc01022j [DOI] [PubMed] [Google Scholar]
- 50.Zhu P. and Wang L., “Passive and active droplet generation with microfluidics: A review,” Lab Chip 17, 34–75 (2016). 10.1039/c6lc01018k [DOI] [PubMed] [Google Scholar]
- 51.Olla P., “The lift on a tank-treading ellipsoidal cell in a shear flow,” J. Phys. II 7, 1533–1540 (1997). 10.1051/jp2:1997201 [DOI] [Google Scholar]
- 52.Mietke A., Otto O., Girardo S., Rosendahl P., Taubenberger A., Golfier S., Ulbricht E., Aland S., Guck J., and Fischer-Friedrich E., “Extracting cell stiffness from real-time deformability cytometry: Theory and experiment,” Biophys. J. 109, 2023–36 (2015). 10.1016/j.bpj.2015.09.006 [DOI] [PMC free article] [PubMed] [Google Scholar]
- 53.Karimi A., Yazdi S., and Ardekani A. M., “Hydrodynamic mechanisms of cell and particle trapping in microfluidics,” Biomicrofluidics 7, 21501 (2013). 10.1063/1.4799787 [DOI] [PMC free article] [PubMed] [Google Scholar]
- 54.Gossett D. R., Tse H. T., Lee S. A., Ying Y., Lindgren A. G., Yang O. O., Rao J., Clark A. T., and Di Carlo D., “Hydrodynamic stretching of single cells for large population mechanical phenotyping,” Proc. Natl. Acad. Sci. U.S.A. 109, 7630–5 (2012). 10.1073/pnas.1200107109 [DOI] [PMC free article] [PubMed] [Google Scholar]
- 55.Toepfner N., Herold C., Otto O., Rosendahl P., Jacobi A., Krater M., Stachele J., Menschner L., Herbig M., Ciuffreda L., Ranford-Cartwright L., Grzybek M., Coskun U., Reithuber E., Garriss G., Mellroth P., Henriques-Normark B., Tregay N., Suttorp M., Bornhauser M., Chilvers E. R., Berner R., and Guck J., “Detection of human disease conditions by single-cell morpho-rheological phenotyping of blood,” eLife 7, e29213 (2018). 10.7554/eLife.29213 [DOI] [PMC free article] [PubMed] [Google Scholar]
Associated Data
This section collects any data citations, data availability statements, or supplementary materials included in this article.
Supplementary Materials
See the supplementary material for further description of the droplet generator fabrication methods, cell-like MP formulations for target elastic moduli used within constriction device, performance of the droplet generator within a production-like setting, and proposed cell-like MP fabrication improvements. Additionally, a detailed statistical comparison of radius and elastic modulus of MPs used to calibrate particle trajectories within constriction device is discussed. Last, the statistical analysis of elastic modulus measurements of the two human cell lines (HepG2 and MG-63) using AFM and MP calibrated constriction device is shown.
Data Availability Statement
The data that support the findings of this study are available from the corresponding author upon reasonable request.


