Abstract
A competing-risks model was developed in this study to identify the significant prognostic factors and evaluate the cumulative incidence of cause-specific death in gallbladder adenocarcinoma (GBAC), with the aim of providing guidance on effective clinical treatments.
All patients with GBAC in the Surveillance, Epidemiology, and End Results (SEER) database during 1973 to 2015 were identified. The potential prognostic factors were identified using competing-risks analyses implemented using the R and SAS statistical software packages. We calculated the cumulative incidence function (CIF) for cause-specific death and death from other causes at each time point. The Fine-Gray proportional-subdistribution-hazards model was then applied in univariate and multivariate analyses to test the differences in CIF between different groups and identify independent prognostic factors.
This study included 3836 eligible patients who had been enrolled from 2004 to 2015 in the SEER database. The univariate analysis indicated that age, race, AJCC stage, RS, tumor size, SEER historic stage, grade, surgery, radiotherapy, chemotherapy and adjuvant therapy (RCT, SRT, SCT and SRCT) were significant factors affecting the probability of death due to GBAC. The multivariate analysis indicated that age, race, AJCC stage, RS status, tumor size, grade and SRT were independent prognostic factors affecting GBAC cancer-specific death. A nomogram model was constructed based on multivariate models for death related to GBAC.
We have constructed the first competing-risks nomogram for GBAC. The model was found to perform well. This novel validated prognostic model may facilitate the choosing of beneficial treatment strategies and help when predicting survival.
Keywords: competing-risks model, fine-gray proportional-subdistribution-hazards model, gallbladder adenocarcinoma, prognostic factors, SEER database
1. Introduction
Gallbladder cancer (GBC) is an uncommon malignancy with an annual incidence of only 3 per 100,000 people. However, the 5-year survival rate of GBC is 3% to 5%, which is the lowest among gastrointestinal cancers,[1,2] and this reflects the poor prognosis and absence of effective therapies. The most-common histologic subtype of GBC is adenocarcinoma, while squamous cell carcinoma and adenosquamous cell carcinoma are relatively rare, reportedly accounting for 1.4% to 10.6% of all GBC cases,[3] Surgery is recommended as the first-line therapy for patients with resectable GBC,[4] but the 5-year survival rate is rather low, at approximately 5%. Although there have been many reports on the prognosis of GBC, most studies have focused on overall survival based on the Kaplan-Meier and Cox proportional-hazards methods.[5–8] These conventional methods can handle only one outcome, and so might produce unreliable results when competing risks are present.[9] The application of competing-risks methods based on subdistribution hazards is recommended in this situation. Cancer patients are generally always exposed to multiple possible events, with only one event finally occurring.[10] Events other than the one of interest are called competing risk events. Traditional survival analysis treats competing events as censored events, and this situation can be improved by performing a competing-risks analysis.
A nomogram is a convenient graphical representation of a mathematical model that combines various important factors to predict a specific endpoint.[11] As a statistical predictive model, the nomogram model has been widely adopted as a useful tool for predicting survival from cancers.[12–14] The value of a characteristic on the nomogram graph represents a score, and the total score is mapped onto the survival probability.
The Surveillance, Epidemiology, and End Results (SEER) Program of the National Cancer Institute provides data on cancer incidence and survival and covers approximately 30% of the total United States population.[15] This program provides complete patient data – including demographic, clinical and follow-up data – that are updated annually by the National Center for Health Statistics.
In this study we conducted a competing-risk analysis of gallbladder adenocarcinoma (GBAC) patients included in the SEER database using the cumulative incidence function (CIF) rather than the Kaplan-Meier survival function when estimating the crude incidence of endpoint events.[16,17] A competing-risks nomogram model to predict the long-term probability of cancer-specific death for individual GBAC patients and a nomogram model to predict cancer-specific death were constructed and validated.
2. Patients and methods
2.1. Study patients
This study extracted data on patients with GBAC who had been enrolled in the SEER database from 2004 to 2015 using the SEER∗Stat software (version 8.3.6). The study cohort consisted of patients with the following histology codes of the third revision of the International Classification of Diseases for Oncology (ICD-O-3): 8140, 8144, 8210, 8211, 8255, 8260, 8261, 8262, 8263, 8310, 8323, 8470, 8480, 8481, 8560, 8570, 8574, and 8576. The ICD-O-3 site code used was “C23.9-Gallbladder.” The following exclusion criteria were applied: (1) presence of another primary cancer, (2) being younger than 18 years at the diagnosis, (3) no pathological diagnosis, and (4) missing or incomplete information about survival, follow-up period, cause of death, or other relevant characteristics. The specific enrollment process is shown in Figure 1.
Figure 1.
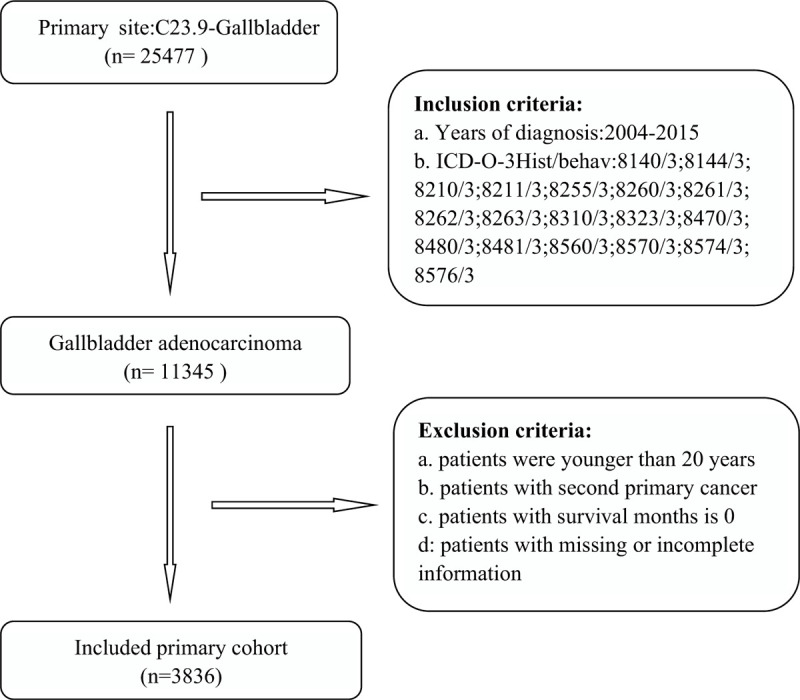
The inclusion and exclusion process of study sample.
Seven-tenths of the patients were randomly selected to form the training cohort for developing the predictive competing-risks model, and the remaining patients were selected as an internal validation cohort. Institutional review board approval and informed consent did not need to be obtained since SEER research data are publicly available and all patient data are de-identified. All authors signed an authorization form and received permission from the SEER program to access and use the data set. The analysis of the SEER patients used de-identified summary-level data and did not require ethical approval.
2.2. Data selection
The demographic and clinical variables extracted from the SEER database included age at diagnosis, year of diagnosis, sex, race, marital status, AJCC stage, radiation sequence (RS) with surgery, tumor size, SEER historic stage, grade, surgery status, radiation status, chemotherapy status, adjuvant therapy information, follow-up information, and cause of death. Age was classified into 21 to 60 years and 61 to 104 years. The year of diagnosis was classified into 2004 to 2007, 2008 to 2011, and 2012 to 2015. Race was classified into white, black, and others. sex was classified into male and female. Marital status was classified into married, unmarried, and other. AJCC stage was classified in stages I, II and III/IV. The RS status was classified into having and not undergoing an RS with surgery. Tumor size was classified into <2 cm, 2 to 5 cm, and >5 cm. SEER historic stage was classified into localized, regional, and distant. Grade was classified into grades I, II, and III/IV. Surgery and radiotherapy were classified into receiving or not receiving the therapy. Chemotherapy was classified into receiving and not receiving/unknown. Adjuvant therapy including radio-chemotherapy (RCT), surgery-radiotherapy (SRT), surgery-chemotherapy (SCT), surgery-radio-chemotherapy (SRCT). It was all classified into present and absent. Cause-specific death was the primary endpoint. Consistent with the COD code, we classified the cause of death into cancer-specific death and death from other causes. The outcomes were divided into alive, DOG and DOC. DOG were defined as following criteria: Dead = attributable to this cancer dx; and COD to site record = gallbladder; DOC were defined as the criteria: Dead of other cause.
2.3. Statistical analysis
The subdistribution hazard function is defined as the instantaneous probability of the occurrence of a given event in patients who have not experienced that type of event previously.[18] The CIF describes the cumulative probability of the occurrence of a given event when also considering competing events.[19] Cause-specific death and other cause of death were the two failure events in the present competing-risks setting.[11] The CIF k(t) = Pr (T ≤ t, D = k) expresses the probability of event k occurring before time t and other types of events.[20] The Fine-Gray model is designed to fit the cumulative incidence of events of interest.[21]
The CIF was used in the present study to determine the probability of each event, and Gray's test was used to estimate the differences in CIFs between groups.[22] The Fine-Gray proportional-subdistribution-hazards model was then applied in the univariate and multivariate analyses to test for differences in the CIF between different groups and identify independent prognostic factors.[23] The subdistribution hazard ratio (sdHR) and its associated 95% confidence interval (CI) were calculated. The concordance index (C-index) was used to measure the discrimination ability of the model. Calibration plots were used to compare the probabilities predicted by the model with the actual probabilities.[24] Furthermore, Fine-Gray proportional-hazards regression was performed to predict the 1-, 3-, and 5-year probabilities of two competing death outcomes.[25] We also compared the results from a Cox regression model with those from the Fine-Gray model. Decision curve analysis was used to estimate the clinical usefulness and net benefit. All statistical analyses were performed using SAS (version 9.4, SPSS, Chicago, IL, USA) and R (version 3.5.0, https://www.r-project.org/) statistical software. The R packages “survival,” “cmprsk,” “rms,” “mstate,” “survism,” “statmod,” and “eha” was used to construct the model, and the “pec” and “riskregression” packages were used to evaluate the model performance. All statistical tests were two-sided, with P < .05 considered to be indicative of statistical significance.
3. Results
3.1. Demographic and clinical characteristics of the patients at diagnosis
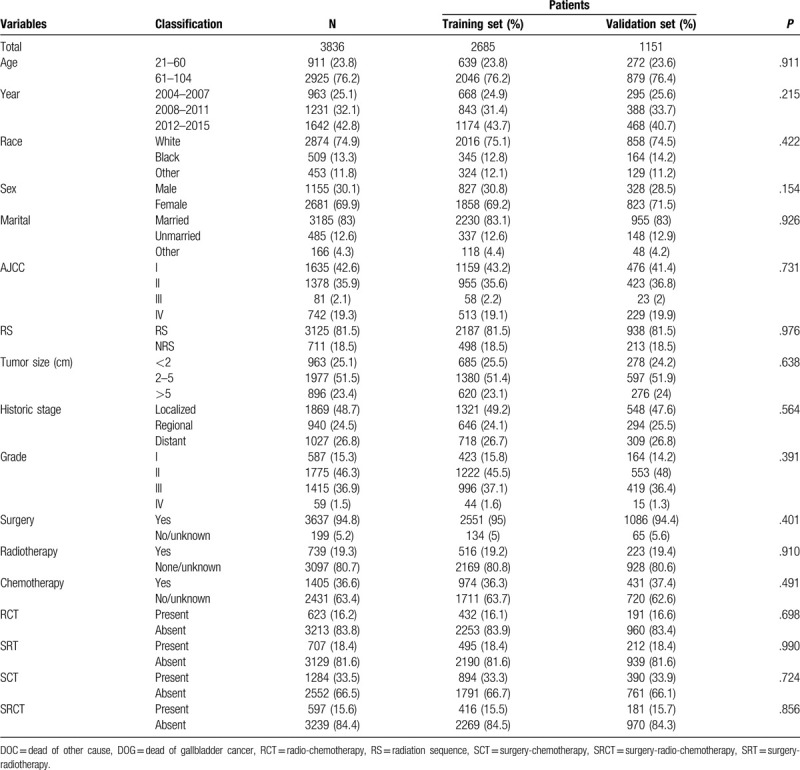
This study enrolled 3836 eligible patients whose baseline characteristics are listed in Table 1. Patients were similar with respect to all clinicopathological characteristics between the training set and validation set in this study.[13] The patients were divided into 2685 in the training cohort and 1151 in the validation cohort. The median age across the entire study population was 62.5 years (range = 21–104 years), with 76.3% (2925) of the patients being older than 60 years. Most of the patients were female (n = 2681, 69.9%), white (n = 2874, 74.9%), and married (n = 3185, 83%), and were at AJCC stage I (n = 1635, 42.6%), SEER localized historic stage (n = 1869, 48.7%), grade II (n = 1775, 46.3%), and RS with surgery (n = 3125, 81.5%). Regarding tumor size, 2 to 5 cm was the most common (n = 1977, 51.5%), followed by <2 cm (n = 963, 25.1%) and >5 cm (n = 896, 23.4%). Most of the patients had received surgical treatment (n = 3697, 94.8%), while 739 (19.3%) had received radiotherapy and 1045 (36.6%) had received chemotherapy. Received adjuvant therapy with patients for RCT, SRT, SCT, SRCT is 623 (16.2%), 707 (18.4%), 1284 (33.5%), 5979 (15.6%), respectively. The median follow-up duration was 16 months (range = 1–154 months). There were 2689 patient deaths during the follow-up period: 1441 cancer-specific deaths and 1248 competing mortalities. The DOG patients comprised 421 males and 1020 females, while the DOC group comprised 408 males and 840 females.
Table 1.
Baseline characteristics of patients with gallbladder adenocarcinoma.
3.2. Univariate analysis of the prognosis of gallbladder adenocarcinoma
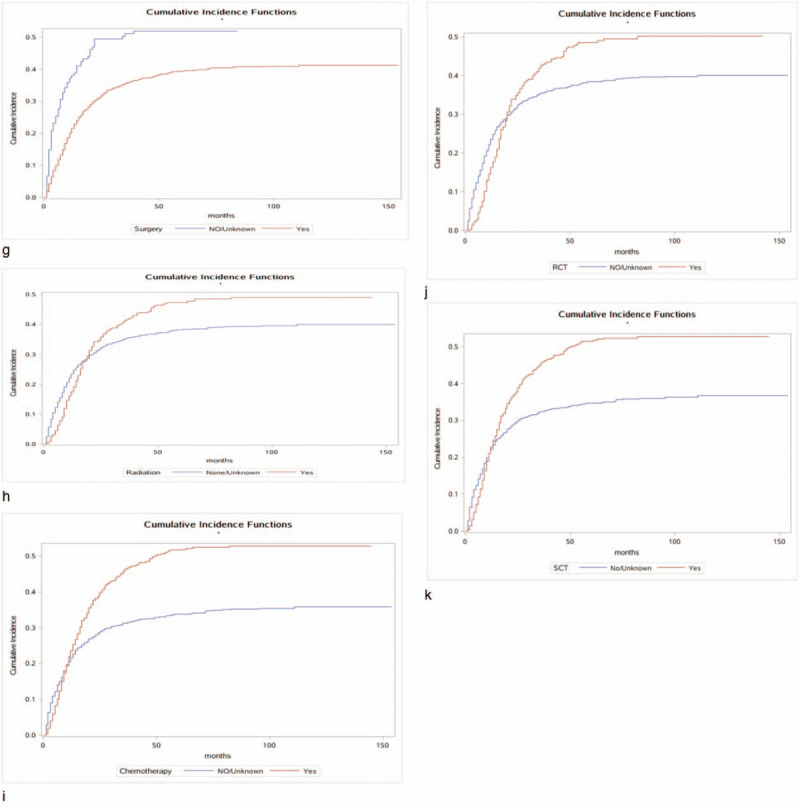
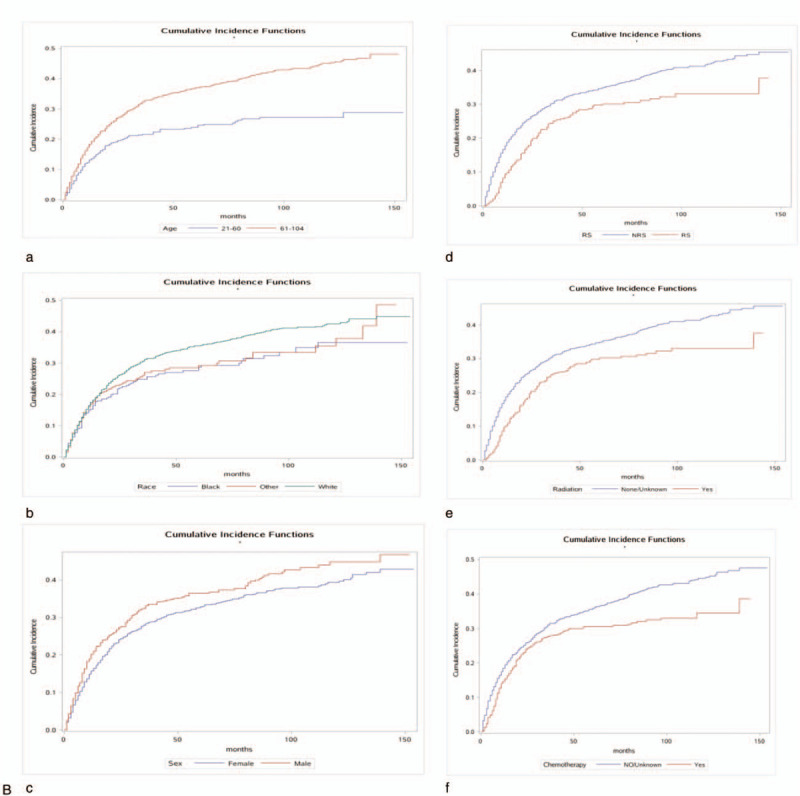
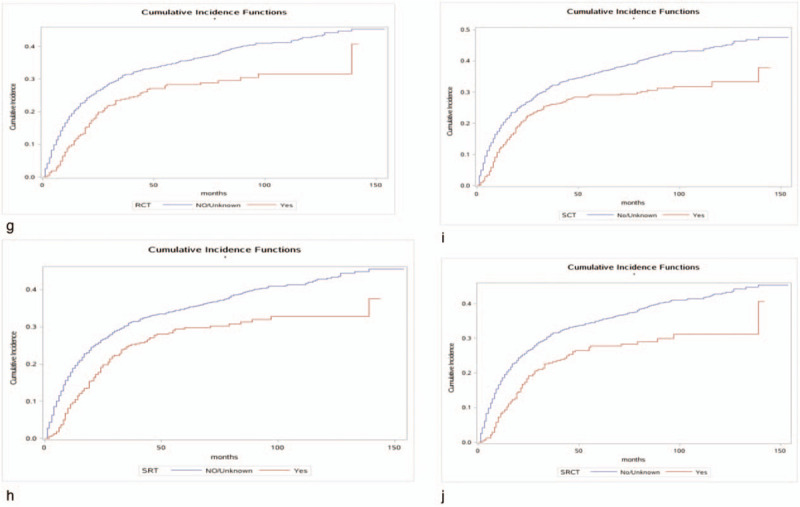
The 1-, 3-, and 5-year cancer-specific deaths and non-cancer-specific deaths stratified by age at diagnosis, year of diagnosis, race, sex, marital status, AJCC stage, RS with surgery, tumor size, SEER historic stage, grade, surgery, radiotherapy status, chemotherapy status and adjuvant therapy (RCT, SRT, SCT, and SCRT) are summarized in Table 2 . Across the entire study population, the 1-, 3-, and 5-year cancer-specific death rates were 22.2%, 36.7%, and 40.0%, respectively; the corresponding non-cancer-specific death rates were 16.7%, 28.8%, and 33.5%. The corresponding CIF curves are shown in Figure 2 . According to the results of univariate analysis, patients with characteristics of advanced age, black race, advanced AJCC stage, NRS status, larger tumor, SEER distant historic stage, advanced grade, no surgical treatment alone, received radiotherapy alone, receiving chemotherapy alone, RCT absent, SRT present, SCT present and SCRT present were associated with high cumulative incidence rates of DOG. Year of diagnosis, sex and marital status were not significantly related to the prognosis of DOG outcomes. Meanwhile, the cumulative incidence rates of DOC were higher in patients with advanced age, 2004 to 2007 year, white race, male sex, advanced AJCC stage, RS status, not receiving radiotherapy, not receiving chemotherapy alone and absent adjuvant therapy (RCT, SRT, SCT, SRCT). No significant results were detected for marital status, tumor size, grade, SEER historic stage, or surgical treatment in the CIF of DOC.
Table 2.
Univariate analysis of prognostic factors in patients with gallbladder adenocarcinoma.

Figure 2.
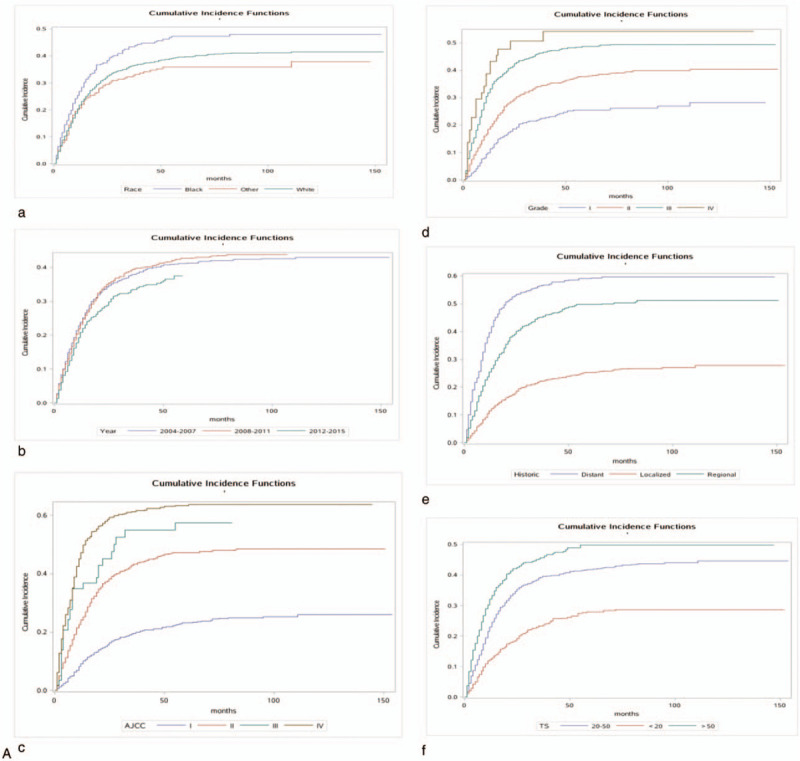
Cumulative incidence estimates of death according to patient characteristics: A (a–k) indicates cause-specific death; B (a–j) indicates other causes of death.
3.3. Multivariate analysis of the prognosis of gallbladder adenocarcinoma
The proportional-subdistribution-hazard model of the Fine-Gray method was used for multivariate analyses of DOG and DOC; the results are presented in Table 3 . After adjusting for the variables that were significant in the univariate analysis by the CIF, the multivariate analysis found that age, race, AJCC stage, RS, tumor size, grade and SRT can significantly affect the cancer-specific death in patients with GBAC. A worse prognosis was associated with an age at diagnosis of 60 to 104 years (sdHR = 1.213 vs 21–60 years, 95% CI = 1.046–1.407, P = .011), whiterace (sdHR = 0.825 vs black, 95% CI = 0.687–0.992, P = .040), AJCC stage IV (sdHR = 3.662 vs AJCC stage I, 95% CI = 2.482–5.403, P < .001), smaller tumor size (sdHR = 0.753 for <2 cm vs 2–5 cm, 95% CI = 0.630–0.898, P = .002), grade IV (sdHR = 1.838 vs grade I, 95% CI = 1.117–3.024, P = .017) and SRT present (sdHR = 14350.310 vs absent, 95% CI = 2943.143–69969.850, P < .001). After adjustment, the prognosis was not significantly affected by sex, SEER historic stage, surgery, chemotherapy, radiotherapy, RCT, SCT and SRCT in DOG. However, the multivariate analysis found that age, AJCC stage, chemotherapy and SCT, could significantly affect the non-cancer-specific death rate in patients with GBAC. We also compared the results from a Cox regression model with those from the Fine-Gray model, the results are also presented in Table 3 .
Table 2 (Continued).
Univariate analysis of prognostic factors in patients with gallbladder adenocarcinoma.
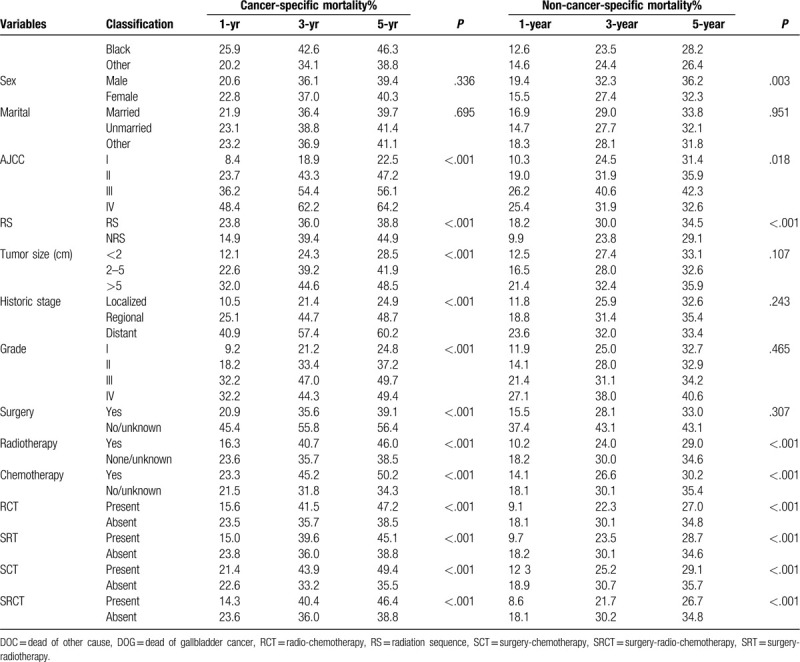
Table 3.
Hazard models of probabilities of death for patients with gallbladder adenocarcinoma.
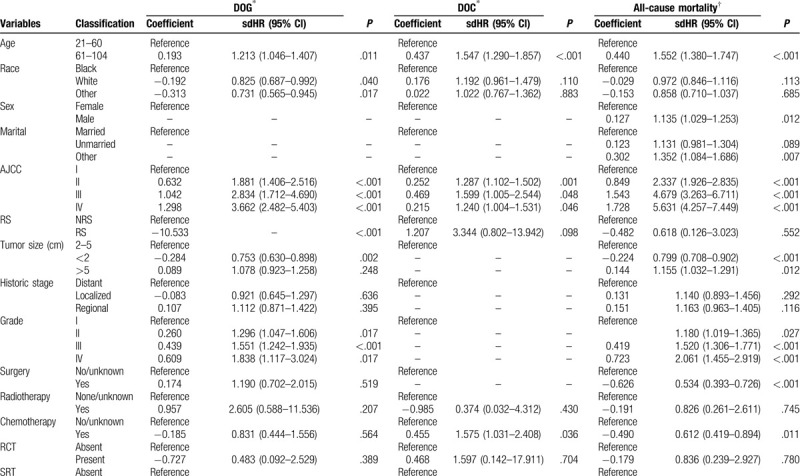
Table 3 (Continued).
Hazard models of probabilities of death for patients with gallbladder adenocarcinoma.

3.4. Construction and validation of the nomogram
All of the independent predictors of DOG, DOC and OD (overall death) in the entire study population were included in the nomogram, respectively. Figure 3 illustrates the predictive nomogram established for the 1-, 3-, and 5-year cumulative death probabilities in the training cohort. The discrimination performance of the Fine-Gray model was evaluated using the C-index. Models showed good accuracy with c-index of 0.712 for the cause-specific mortality model, 0.699 for the competing mortality model, and 0.719 for the overall death model, which suggests a relatively good model discriminative ability. In addition, the calibration plots in Figure 4 demonstrate the good concordance between the predicted and actual outcomes, with all of the calibration curves being close to the standard curves. Finally, decision curve analysis was performed to evaluate the net benefit of the Fine-Gray model. The results shown in Figure 5 demonstrate that the net benefits obtained from the application of the DOG, DOC, and OD model. Above all, the nomogram had a good model discriminative capacity. The established competing-risks nomogram performed well in both internal and external validations.
Figure 2 (Continued).
Cumulative incidence estimates of death according to patient characteristics: A (a–k) indicates cause-specific death; B (a–j) indicates other causes of death.
Figure 2 (Continued).
Cumulative incidence estimates of death according to patient characteristics: A (a–k) indicates cause-specific death; B (a–j) indicates other causes of death.
Figure 2 (Continued).
Cumulative incidence estimates of death according to patient characteristics: A (a–k) indicates cause-specific death; B (a–j) indicates other causes of death.
Figure 3.
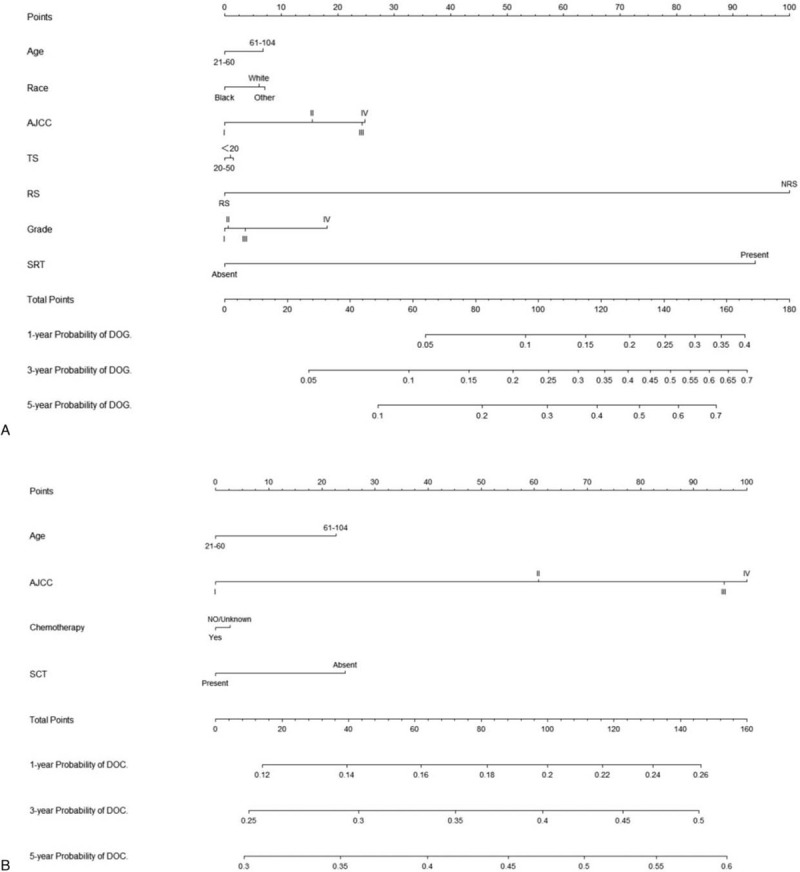
Nomogram for predicting 1-, 3- and 5-year probabilities of DOG, DOC, and OD in patients with gallbladder adenocarcinoma. (A) DOG cause-specific death, (B) other cause-specific death, and (C) overall death.
Figure 3 (Continued).
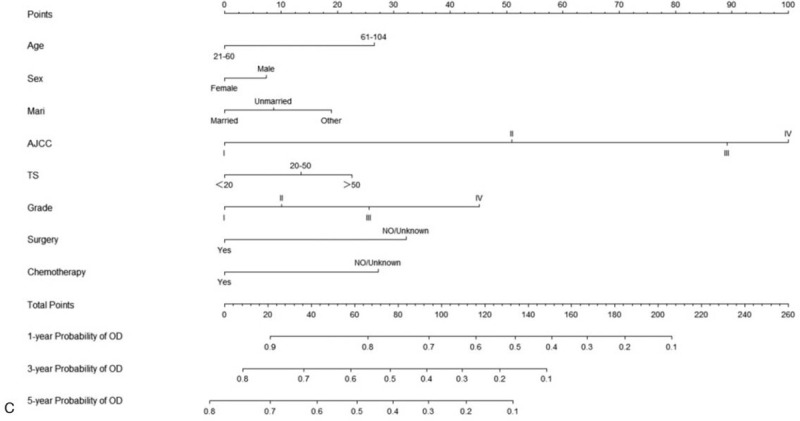
Nomogram for predicting 1-, 3- and 5-year probabilities of DOG, DOC, and OD in patients with gallbladder adenocarcinoma. (A) DOG cause-specific death, (B) other cause-specific death, and (C) overall death.
Figure 4.
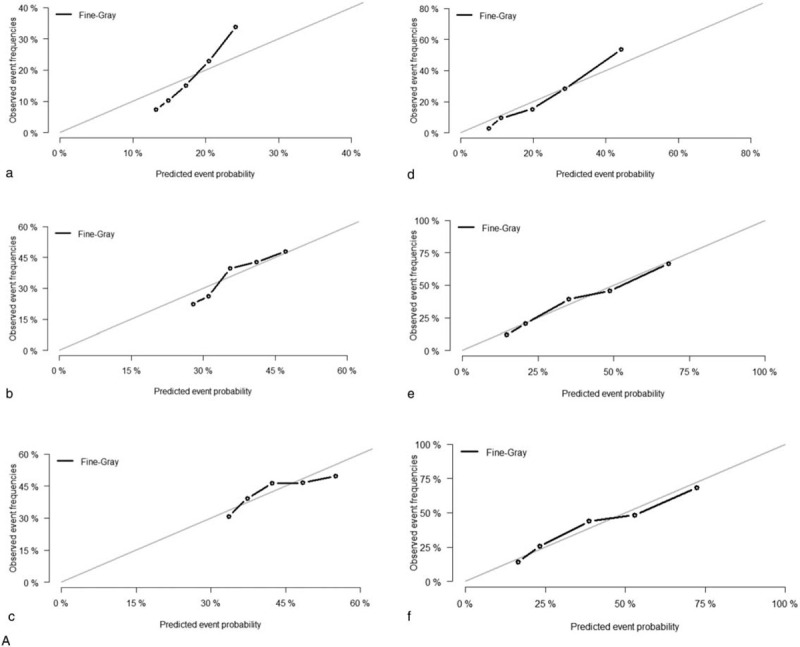
Calibration plots of the nomogram for 1-, 3- and 5-year mortality prediction of the training set (a, b, c) and validation set (d, e, f). X-axis represents the nomogram-predicted probability of death; Y-axis represents the actual cause-specific mortality probability. (A) DOG cause-specific death, (B) other cause-specific death, and (C) overall death.
Figure 4 (Continued).
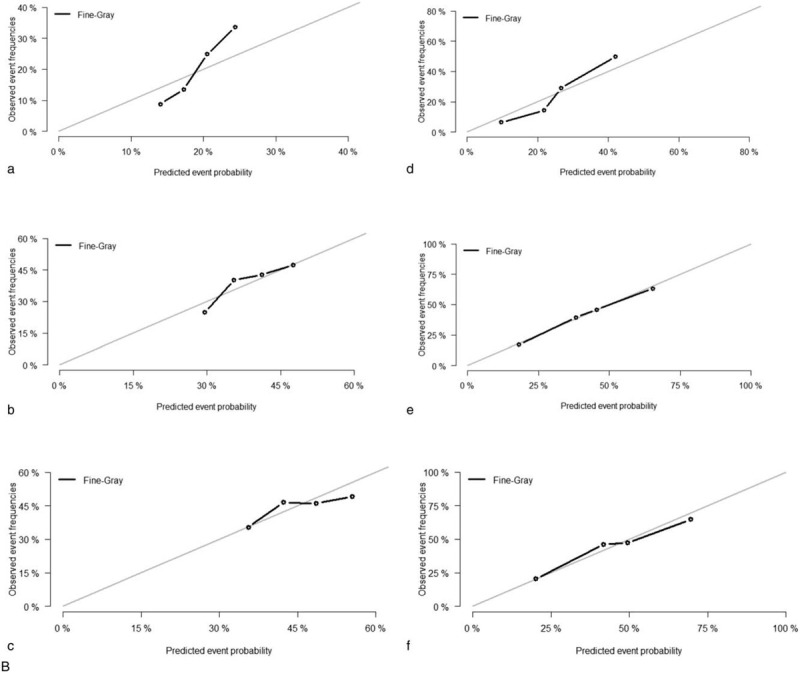
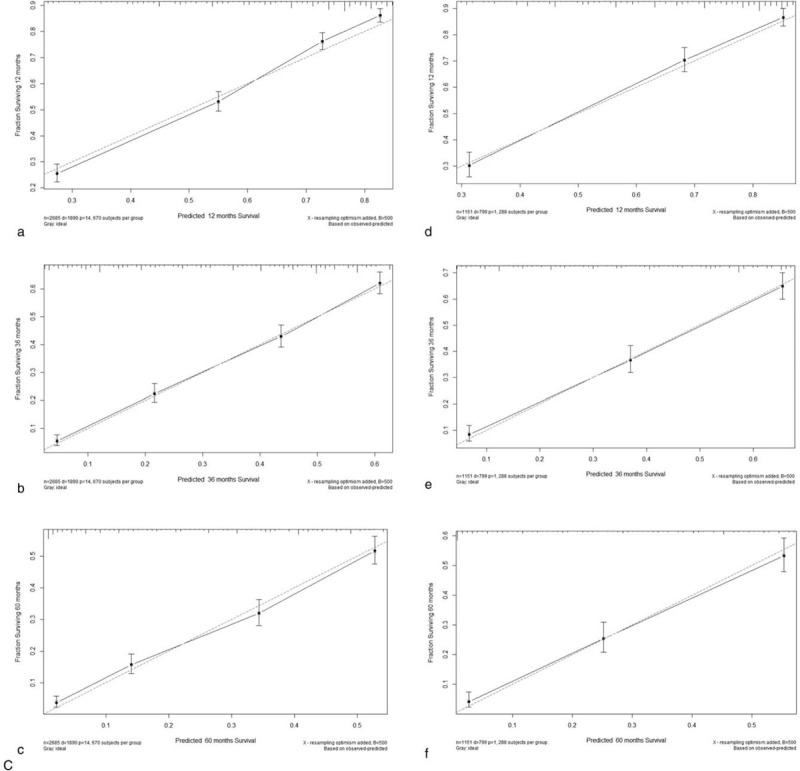
Calibration plots of the nomogram for 1-, 3- and 5-year mortality prediction of the training set (a, b, c) and validation set (d, e, f). X-axis represents the nomogram-predicted probability of death; Y-axis represents the actual cause-specific mortality probability. (A) DOG cause-specific death, (B) other cause-specific death, and (C) overall death.
Figure 5.
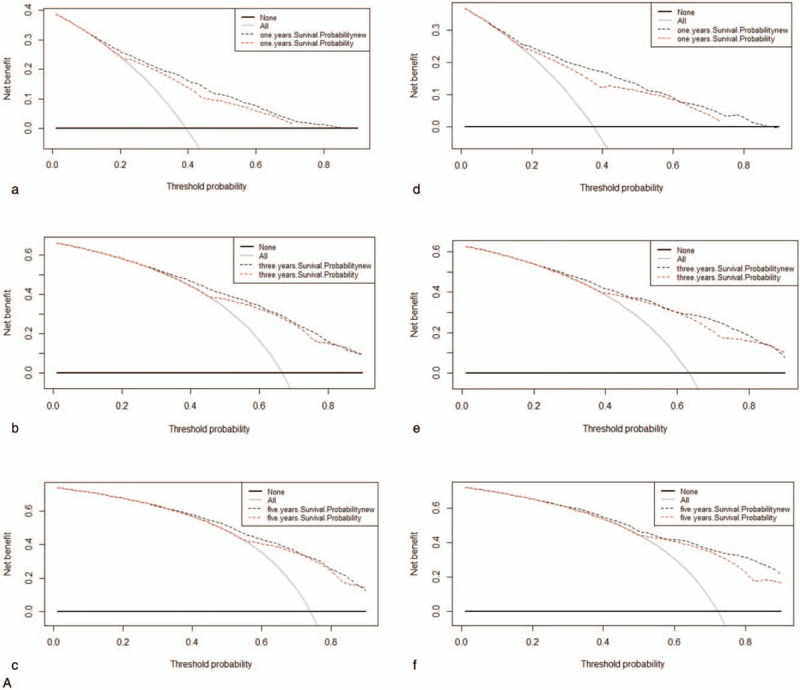
Decision curves for nomogram to predict mortality of GBAC in the training cohort (a, b, c) and in the validation cohort (d, e, f). (A) DOG cause-specific death, (B) other cause-specific death, and (C) overall death.
Figure 5 (Continued).
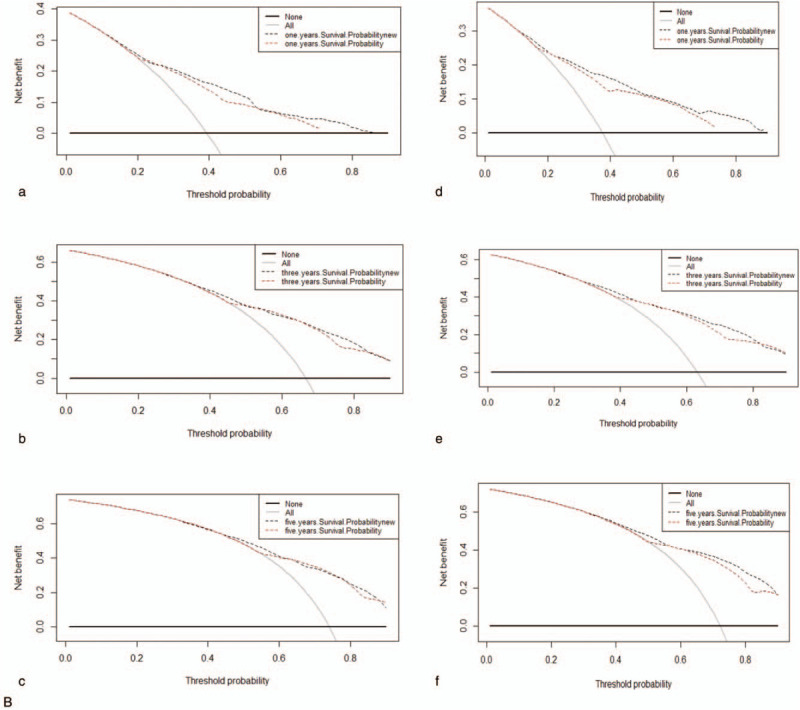
Decision curves for nomogram to predict mortality of GBAC in the training cohort (a, b, c) and in the validation cohort (d, e, f). (A) DOG cause-specific death, (B) other cause-specific death, and (C) overall death.
Figure 5 (Continued).
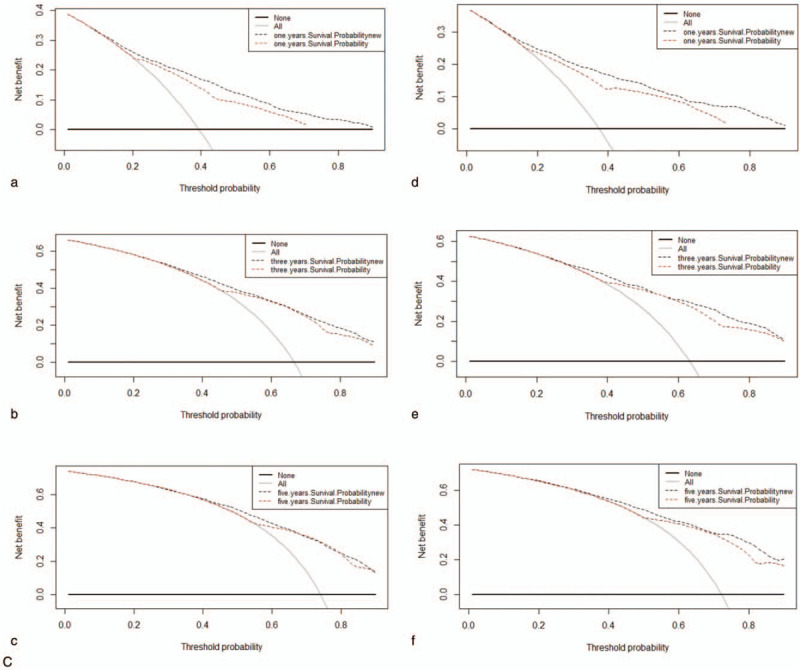
Decision curves for nomogram to predict mortality of GBAC in the training cohort (a, b, c) and in the validation cohort (d, e, f). (A) DOG cause-specific death, (B) other cause-specific death, and (C) overall death.
4. Discussion
GBC is an aggressive malignancy associated with multiple etiologies and high mortality rates.[1,26] There have been some studies of the prognosis status of gallbladder carcinoma, but many of the survival analyses have focused on only a single survival end point[27,28] and so have ignored competing events that would lead to inaccurate survival evaluations, especially among older patients.[29] The present study estimated the probability of death for 3836 patients with GBAC who had been enrolled in the SEER database between 2004 and 2015, and calculated the 1-, 3-, and 5-year CIFs for GBAC-specific mortality. We found that 1248 of 2689 patients died from other causes, comprising 46% of the deaths, and hence this was taken as censored data based on the common method of survival analysis. A concise nomogram based on a competing-risks model was constructed to predict the probability of GBAC-specific death. Most of the patients who died were older, white, married, female, grade II, AJCC stage I or II, AJCC stage T2, N0, or M0, and had SEER localized historic stage.
We identified age, race, AJCC stage, RS, tumor size, histological grade and SRT as independent predictors for GBAC-specific death. Age has been identified as an important prognostic marker for cause-specific survival in several studies,[30,31–34] although the precise mechanism remains unclear. The present multivariate analyses showed that being older was an independent risk factor for DOG and DOC, indicating that older patients have worse survival and are at a greater risk of cancer-specific death. This might be due to aging impairing the immune response, increasing oxidative stress, shortening telomeres, and causing the accumulation of senescent cells.[33,34] This conclusion is similar to that of other studies.[35–38] Our study also found that the risk of death is significantly higher among black patients with GBC compared with white patients (sdHR = 0.793, P = .012). Race is another known risk factor for GBAC, with high incidence in Japan, Chile, South America, and India.[39] This conclusion is similar to that of previous studies.[40] Other independent prognostic factors for cause-specific mortality – including AJCC stage, RS, tumor size, histological grade and SRT – were all independent factors in the present study, which is consistent with the findings of several previous studies.[10,35,37,41–44] The present patients with advanced AJCC stage had a higher risk of death compared to those at AJCC stage I, as did those with advanced histological grade and larger tumors.
The Cox regression model also underestimates the risk of the grade. The Fine-Gray model revealed that grade II (sdHR = 1.296, P = .017) and grade III (sdHR = 1.551, 9, P < .001) were risk factors for death in GBAC patients compared with grade I. However, in the Cox regression, we observe grade II (sdHR = 1.180, P = .027) and grade III (sdHR = 1.520, 9, P < .001). The HR for grade IV was >1 in both the Fine-Gray model and the Cox regression model. The Cox regression model also underestimates the risk of the treatment information, the risk of surgery (sdHR = 0.534, P < .001), the risk of radiotherapy (sdHR = 0.826, P = .745), the risk of chemotherapy (sdHR = 0.612, P < .011), the risk of SRT (sdHR = 1.666, P = .506). And we did not observe statistical significance for RCT, SRT, SCT and SRCT. However, the results of univariate analysis showed that surgical treatment, radiotherapy, chemotherapy and adjuvant therapy (RCT, SRT, SCT and SRCT) were significant prognostic factors. The NCCN currently recommends that radical repeat surgery be undertaken in patients with T1b, T2, and T3 patients with GBAC.[45] Surgery and radiotherapy alone as risk factors for cause-specific death that was inconsistent with previous studies. In addition, chemotherapy alone and RCT as protective factors for cause-specific death in our study. It was consistent with previous studies.[44] Considering the significant heterogeneity and paradoxical conclusions of previous studies, it is still difficult to reach a conclusion regarding the role of postoperative adjuvant treatments in GBC.[46]
Competing risk events are common in clinical studies, especially in oncology researches.[47] In survival analysis, a patient may be faced with multiple events, and be affected by only one of them. Once the final outcome occurs, the other potential events can no longer take place.[48] However, in the widely used Kaplan-Meier methods and Cox regression models, once the event of interest is confirmed, the other events will be regarded as censored observations.[49] The traditional method of survival calculation therefore increases the crude incidence of the event of interest, and overestimates its risk. With the increasing concern about the effects of competing causes of death on prognoses, some researchers have recently developed competing-risks nomograms for soft-tissue sarcoma, breast cancer, prostate cancer, renal cell carcinoma, and thyroid cancer, but one for GABC has been lacking.[50–55] By using a competing-risk model to avoid this error in the statistical analysis, the present study aimed to identify superior prognostic factors for GBAC and provide more-accurate estimates of the cumulative incidence of dying from cancer-specific causes or other causes. In a setting with competing risks, death from other causes were not censored, instead being treated as a competing-risk failure event. The CIF reflects the mortality patterns that are actually observed, and so provides an unbiased estimate of the probability of failure.[54,55] To our knowledge, the present study is the first attempt to construct a competing-risks nomogram based on the proportional-subdistribution-hazard approach to predict cause-specific death in GBAC in a general population.
One strength of this study is that the sample included sufficient histologically confirmed GABC patients from a population-based data set. The SEER database provides a large sample for exploring risk factors and constructing an accurate predictive model. Furthermore, the nomogram developed in our study appeared to exhibit a good discrimination ability and a satisfying clinical net benefit using variables that can be easily obtained from routine medical records, thereby allowing clinicians to expediently predict the risks associated with GBAC.
While this was a large population-based study, it inevitably also had some limitations. First, the use of chemotherapy and information on the quality of surgical care and pathological examinations are not included in the SEER database. Second, the SEER GBC database does not provide data on adjuvant therapy, comorbidities, or recurrence rates.[24] Third, there is no guarantee that the cause of death is recorded correctly in the SEER database, which could decrease the reliability of the conclusions drawn herein. Finally, despite being a user-friendly tool for helping doctors to make clinical decisions, our nomogram did not include all possible prognostic factors and will not always provide a precise prognosis in clinical practice for individual patients.
5. Conclusion
In conclusion, this is the first study to apply CIFs to cause-specific deaths and competing-risk deaths for GBC with a competing-risks analyses using the SEER database. The probabilities of cancer-specific death, competing-risks death and overall death were evaluated. Our nomogram for estimating the 1-, 3-, and 5-year probabilities of gallbladder adenocarcinoma death in patients showed relatively good performance and may be considered a practical tool for predicting the prognosis of this disease. However, further external validation of the nomogram is still needed.
Acknowledgments
We thank the staff members of the National Cancer Institute and their colleagues across the United States and at Information Management Services, Inc, who have been involved with the Surveillance, Epidemiology, and End Results (SEER) Program.
Author contributions
Conceptualization: Didi Han, Jin Yang.
Data curation: Didi Han, Fengshuo Xu.
Formal analysis: Fengshuo Xu, Ling Bai, Jun Lyu.
Investigation: Yuan-long Wei, Rahel Elishilia Kaaya.
Methodology: Jun Lyu.
Software: Qiao Huang, Ling Bai, Jun Lyu.
Supervision: Rahel Elishilia Kaaya, Jun Lyu.
Writing – original draft: Didi Han, Jin Yang.
Writing – review & editing: ShengPeng Wang, Jun Lyu.
Footnotes
Abbreviations: CI = confidence interval, CIF = cumulative incidence function, C-index = concordance index, DOC = dead of other cause, DOG = dead of gallbladder cancer, GBAC = gallbladder adenocarcinomas, GBC = gallbladder cancer, Mari = marital status, RCT = radio-chemotherapy, RS = radiation sequence, SCT = surgery-chemotherapy, sdHR = subdistribution hazard ratio, SEER = Surveillance, Epidemiology, and End Results, SRCT = surgery-radio-chemotherapy, SRT = surgery-radiotherapy, TS = tumor size.
How to cite this article: Han D, Yang J, Xu F, Huang Q, Bai L, Wei Yl, Kaaya RE, Wang S, Lyu J. Prognostic factors in patients with gallbladder adenocarcinoma identified using competing-risks analysis: a study of cases in the SEER database. Medicine. 2020;99:31(e21322).
DDH and JY contributed equally to this study.
The study was supported by The National Social Science Foundation of China (grant/award No. 16BGL183).
The authors have no conflicts of interest to disclose.
The datasets generated during and/or analyzed during the current study are available from the corresponding author on reasonable request.
References
- [1].Lazcano-Ponce EC, Miquel JF, Muñoz N, et al. Epidemiology and molecular pathology of gallbladder cancer. CA Cancer J Clin 2001;51:349–64. [DOI] [PubMed] [Google Scholar]
- [2].Kapoor VK, McMichael AJ. Gallbladder cancer: an ‘Indian’ disease. Natl Med J India 2003;16:209–13. [PubMed] [Google Scholar]
- [3].Roa JC, Tapia O, Cakir A, et al. Squamous cell and adenosquamous carcinomas of the gallbladder: clinicopathological analysis of 34 cases identified in 606 carcinomas. Mod Pathol 2011;24:1069–78. [DOI] [PubMed] [Google Scholar]
- [4].Kondo S, Takada T, Miyazaki M, et al. Guidelines for the management of biliary tract and ampullary carcinomas: surgical treatment. J Hepatobiliary Pancreat Surg 2008;15:41–54. [DOI] [PMC free article] [PubMed] [Google Scholar]
- [5].Väisänen JA, Alho O, Koivunen PT, et al. Cause-specific mortality in patients with head and neck cancer: Long-term follow-up of a population-based cohort from 1986 to 2012 accounting for competing risks. Oral Oncol 2018;79:20–6. [DOI] [PubMed] [Google Scholar]
- [6].Zhang W, Hong HJ, Chen Y. Establishment of a gallbladder cancer-specific survival model to predict prognosis in non-metastatic gallbladder cancer patients after surgical resection. Dig Dis Sci 2018;63:2251–8. [DOI] [PubMed] [Google Scholar]
- [7].Aloia TA, Járufe N, Javle M, et al. Gallbladder cancer: expert consensus statement. HPB (Oxford) 2015;17:681–90. [DOI] [PMC free article] [PubMed] [Google Scholar]
- [8].Chen Z, Gao W, Pu L, et al. Impact of insurance status on the survival of gallbladder cancer patients. Oncotarget 2017;8:51663–74. [DOI] [PMC free article] [PubMed] [Google Scholar]
- [9].Zhou H, Zhang Y, Qiu Z, et al. Nomogram to predict cause-specific mortality in patients with surgically resected stage i non-small-cell lung cancer: a competing risk analysis. Clinical Lung Cancer 2018;19:e195–203. [DOI] [PubMed] [Google Scholar]
- [10].Dignam JJ, Zhang Q, Kocherginsky M. The use and interpretation of competing risks regression models. Clin Cancer Res 2012;18:2301–8. [DOI] [PMC free article] [PubMed] [Google Scholar]
- [11].Shen W, Sakamoto N, Yang L. Cause-specific mortality prediction model for patients with basaloid squamous cell carcinomas of the head and neck: a competing risk analysis. J Cancer 2018;9:4009–17. [DOI] [PMC free article] [PubMed] [Google Scholar]
- [12].He C, Lao X, Lin X. Transarterial chemoembolization combined with recombinant human adenovirus type 5 H101 prolongs overall survival of patients with intermediate to advanced hepatocellular carcinoma: a prognostic nomogram study. Chinese J Cancer 2017;36:59. [DOI] [PMC free article] [PubMed] [Google Scholar]
- [13].He C, Zhang Y, Cai Z, et al. Overall survival and cancer-specific survival in patients with surgically resected pancreatic head adenocarcinoma: A competing risk nomogram analysis. J Cancer 2018;9:3156–67. [DOI] [PMC free article] [PubMed] [Google Scholar]
- [14].He C, Mao Y, Wang J, et al. Nomograms predict long-term survival for patients with periampullary adenocarcinoma after pancreatoduodenectomy. BMC Cancer 2018;18:327. [DOI] [PMC free article] [PubMed] [Google Scholar]
- [15].Hayat MJ, Howlader N, Reichman ME, et al. Cancer statistics, trends, and multiple primary cancer analyses from the Surveillance, Epidemiology, and End Results (SEER) Program. Oncologist 2007;12:20–37. [DOI] [PubMed] [Google Scholar]
- [16].Austin PC, Lee DS, Fine JP. Introduction to the analysis of survival data in the presence of competing risks. Circulation 2016;133:601–9. [DOI] [PMC free article] [PubMed] [Google Scholar]
- [17].van Walraven C, McAlister FA. Competing risk bias was common in Kaplan-Meier risk estimates published in prominent medical journals. J Clin Epidemiol 2016;69:170–3. [DOI] [PubMed] [Google Scholar]
- [18].Scrucca L, Santucci A, Aversa F. Regression modeling of competing risk using R: an in depth guide for clinicians. Bone Marrow Transplant 2010;45:1388–95. [DOI] [PubMed] [Google Scholar]
- [19].Austin PC, Fine JP. Practical recommendations for reporting Fine-Gray model analyses for competing risk data. Stat Med 2017;36:4391–400. [DOI] [PMC free article] [PubMed] [Google Scholar]
- [20].Haller B, Schmidt G, Ulm K. Applying competing risks regression models: an overview. Lifetime Data Anal 2013;19:33–58. [DOI] [PubMed] [Google Scholar]
- [21].Berger M, Schmid M, Welchowski T, et al. Subdistribution hazard models for competing risks in discrete time. Biostatistics 2020;21:449–66. [DOI] [PubMed] [Google Scholar]
- [22].Dignam JJ, Kocherginsky MN. Choice and interpretation of statistical tests used when competing risks are present. J Clin Oncol 2008;26:4027–34. [DOI] [PMC free article] [PubMed] [Google Scholar]
- [23].Zhang X, Yang J, Huang Q, et al. Prognostic factors in patients with gastric adenocarcinoma using competing-risk analysis: a study of cases in the SEER database. Scand J Gastroenterol 2019;54:1015–21. [DOI] [PubMed] [Google Scholar]
- [24].Li Z, Du S, Feng W, et al. Competing risks and cause-specific mortality in patients with pancreatic neuroendocrine tumors. Eur J Gastroenterol Hepatol 2019;31:749–55. [DOI] [PubMed] [Google Scholar]
- [25].He C, Zhang Y, Cai Z, et al. The impact of surgery in metastatic pancreatic neuroendocrine tumors: a competing risk analysis. Endocr Connect 2019;8:239–51. [DOI] [PMC free article] [PubMed] [Google Scholar]
- [26].Randi G, Franceschi S, La Vecchia C. Gallbladder cancer worldwide: geographical distribution and risk factors. Int J Cancer 2006;118:1591–602. [DOI] [PubMed] [Google Scholar]
- [27].Miao D, Song W, Qian J, et al. Development and validation of a nomogram for predicting overall survival in pancreatic neuroendocrine tumors. Transl Oncol 2018;11:1097–103. [DOI] [PMC free article] [PubMed] [Google Scholar]
- [28].Ruzzenente A, Bagante F, Bertuzzo F, et al. A novel nomogram to predict the prognosis of patients undergoing liver resection for neuroendocrine liver metastasis: an analysis of the Italian Neuroendocrine Liver Metastasis Database. J Gastrointest Surg 2017;21:41–8. [DOI] [PubMed] [Google Scholar]
- [29].Norris CM, Ghali WA, Saunders LD, et al. Ordinal regression model and the linear regression model were superior to the logistic regression models. J Clinical Epidemiol 2006;59:448–56. [DOI] [PubMed] [Google Scholar]
- [30].Shen W, Sakamoto N, Yang L. Cancer-specific mortality and competing mortality in patients with head and neck squamous cell carcinoma: a competing risk analysis. Ann Surg Oncol 2015;22:264–71. [DOI] [PubMed] [Google Scholar]
- [31].Skillington SA, Kallogjeri D, Lewis JSJ, et al. prognostic importance of comorbidity and the association between comorbidity and p16 in oropharyngeal squamous cell carcinoma. JAMA Otolaryngol Head Neck Surg 2016;142:568–75. [DOI] [PMC free article] [PubMed] [Google Scholar]
- [32].Wray CJ, Phatak UR, Robinson EK, et al. The effect of age on race-related breast cancer survival disparities. Ann Surg Oncol 2013;20:2541–7. [DOI] [PubMed] [Google Scholar]
- [33].Fulop T, Larbi A, Kotb R, et al. Aging, immunity, and cancer. Discov Med 2011;11:537–50. [PubMed] [Google Scholar]
- [34].Hoeijmakers JHJ. DNA damage, aging, and cancer. N Engl J Med 2009;361:1475–85. [DOI] [PubMed] [Google Scholar]
- [35].Jaruvongvanich V, Yang JD, Peeraphatdit T, et al. The incidence rates and survival of gallbladder cancer in the USA. Eur J Cancer Prev 2019;28:1–9. [DOI] [PubMed] [Google Scholar]
- [36].Li X, Liu Y, Wang Y, et al. The influence of marital status on survival of gallbladder cancer patients: a population-based study. Sci Rep 2017;7:5322. [DOI] [PMC free article] [PubMed] [Google Scholar]
- [37].Wang SJ, Lemieux A, Kalpathy-Cramer J, et al. Nomogram for predicting the benefit of adjuvant chemoradiotherapy for resected gallbladder cancer. J Clin Oncol 2011;29:4627–32. [DOI] [PMC free article] [PubMed] [Google Scholar]
- [38].He C, Cai Z, Zhang Y, et al. Prognostic model to predict cancer-specific survival for patients with gallbladder carcinoma after surgery: a population-based analysis. Front Oncol 2019;9:1329. [DOI] [PMC free article] [PubMed] [Google Scholar]
- [39].Misra S, Chaturvedi A, Misra N C, et al. Carcinoma of the gallbladder. Lancet Oncol 2003;4:167–76. [DOI] [PubMed] [Google Scholar]
- [40].Zhang L, Chen Z, Fukuma M, et al. Prognostic significance of race and tumor size in carcinosarcoma of gallbladder: a meta-analysis of 68 cases. Int J Clin Exp Pathol 2008;1:75–83. [PMC free article] [PubMed] [Google Scholar]
- [41].Bai D, Chen P, Qian J, et al. Effect of marital status on the survival of patients with gallbladder cancer treated with surgical resection: a population-based study. Oncotarget 2017;8:26404–13. [DOI] [PMC free article] [PubMed] [Google Scholar]
- [42].Edge SB, Compton CC. The American Joint Committee on Cancer: the 7th edition of the AJCC cancer staging manual and the future of TNM. Ann Surg Oncol 2010;17:1471–4. [DOI] [PubMed] [Google Scholar]
- [43].Singh SK, Talwar R, Kannan N, et al. Patterns of presentation, treatment, and survival rates of gallbladder cancer: a Prospective Study at a Tertiary Care Centre. J Gastroint Cancer 2018;49:268–74. [DOI] [PubMed] [Google Scholar]
- [44].Kim TH, Woo SM, Lee WJ, et al. Benefit of adjuvant chemoradiotherapy in resected gallbladder carcinoma. Sci Rep 2019;9:11770. [DOI] [PMC free article] [PubMed] [Google Scholar]
- [45].Scrucca L, Santucci A, Aversa F. Competing risk analysis using R: an easy guide for clinicians. Bone Marrow Transplant 2007;40:381–7. [DOI] [PubMed] [Google Scholar]
- [46].Yifan T, Zheyong L, Miaoqin C, et al. A predictive model for survival of gallbladder adenocarcinoma. Surg Oncol 2018;27:365–72. [DOI] [PubMed] [Google Scholar]
- [47].Sun W, Qiu Z, Tan W, et al. The influence of marital status on survival in patients with oral tongue squamous cell carcinoma. Oncotarget 2017;8:82092–102. [DOI] [PMC free article] [PubMed] [Google Scholar]
- [48].Kattan MW, Heller G, Brennan MF. A competing-risks nomogram for sarcoma-specific death following local recurrence. Stat Med 2003;22:3515–25. [DOI] [PubMed] [Google Scholar]
- [49].Kutikov A, Egleston BL, Wong Y, et al. Evaluating overall survival and competing risks of death in patients with localized renal cell carcinoma using a comprehensive nomogram. J Clin Oncol 2010;28:311–7. [DOI] [PMC free article] [PubMed] [Google Scholar]
- [50].Yang L, Shen W, Sakamoto N. Population-based study evaluating and predicting the probability of death resulting from thyroid cancer and other causes among patients with thyroid cancer. J Clin Oncol 2013;31:468–74. [DOI] [PubMed] [Google Scholar]
- [51].Brockman JA, Alanee S, Vickers AJ, et al. Nomogram predicting prostate cancer-specific mortality for men with biochemical recurrence after radical prostatectomy. Eur Urol 2015;67:1160–7. [DOI] [PMC free article] [PubMed] [Google Scholar]
- [52].Shen W, Sakamoto N, Yang L. Melanoma-specific mortality and competing mortality in patients with non-metastatic malignant melanoma: a population-based analysis. BMC Cancer 2016;16:413. [DOI] [PMC free article] [PubMed] [Google Scholar]
- [53].Sun W, Jiang Y, Liu Y, et al. Nomograms to estimate long-term overall survival and breast cancer-specific survival of patients with luminal breast cancer. Oncotarget 2016;7:20496–506. [DOI] [PMC free article] [PubMed] [Google Scholar]
- [54].Cronin KA, Feuer EJ. Cumulative cause-specific mortality for cancer patients in the presence of other causes: a crude analogue of relative survival. Stat Med 2000;19:1729–40. [DOI] [PubMed] [Google Scholar]
- [55].Schairer C, Mink PJ, Carroll L, et al. Probabilities of death from breast cancer and other causes among female breast cancer patients. J Natl Cancer Inst 2004;96:1311–21. [DOI] [PubMed] [Google Scholar]


