

Abstract
Geographical variability of cancer burden was almost exclusively estimated for common cancers. Since rare cancers (RC) have become an area of priority for basic and clinical research and public health organizations, this paper provides, using a common methodology, a detailed comparison of incidence and survival for RC in the US and Europe. We estimated incidence and net survival of 199 malignant RC from data of 2 580 000 patients collected by 18 US‐SEER and 94 European registries, diagnosed within the most recent common period 2000‐2007. RC were defined according to the criterion of crude annual incidence rates <6/100 000. In total, 196 RC were classified as rare in both populations. Of these, 43 had incidence rates significantly different by at least 0.2 per 100 000:34 higher in the US and 9 higher in Europe. Five‐year net survival for all RC combined significantly differed: 54% in the US and 48% in Europe. Survival for 62 RC was significantly higher in the US vs 6 higher in Europe. Differences were not concentrated in a particular cancer family, and were mostly relevant for cases diagnosed >65+ years of age. Use of standardized methods evidenced that incidence and survival rate of majority of RC were higher in the United States compared to Europe. Possible reasons for such differences, requiring further studies, include distribution of risk factors, ability to diagnose RC, different registration practices, and use of updated International Classification of Diseases for Oncology.
Keywords: 5 years net survival, differences, Europe, incidence, rare cancers, USA
Plot of crude incidence rates of rare and common cancers in Europe (y‐axis) vs the US (x‐axis) shows that most cancers were rare (crude incidence <6/100.000, low left square) in both population. Two cancers (thyroid carcinoma and Diffuse B lymphoma) classified as rare in the European population, however, were common in the US (low right square). In contrast, breast invasive lobular carcinoma was common in Europe and rare in the US (high left square).
1. INTRODUCTION
Patients diagnosed with rate cancers (RC) are disadvantaged with respect to those diagnosed with common cancers. Due to their rarity, diagnosis of RC is often delayed, clinical research is difficult, clinical management is often complex and hard outside a few specialized centers. Two recent papers described the burden of RC in the US 1 and Europe 2 and estimated that a significant proportion, 20%‐24% of all patients diagnosed with cancer, are rare. Both papers defined rarity using an annual incidence rate cut‐off <6/100 000, and they used the same list of clinically relevant and histologically defined RC. The list was developed by the Surveillance of RC in Europe (RARECARE) group, which consists of pathologists, hematologists, other clinicians, and epidemiologists. Inferior clinical outcomes of rare vs common cancers were reported in both papers, partially explained by the differential distribution of stage at diagnosis between rare and common cancers as reported in the US. 1 The European paper reported a low level of centralization for RC patients treatment. 2
Rare cancers have become an area of priority for basic and clinical research, and public health organizations. The most relevant initiatives in Europe are the European Community‐supported Joint Action on RC (JARC), 3 whose major goal is to include RC in national cancer plans, and the development of the European Reference Network (ERN) 4 on RC, aimed at facilitating consultation for diagnosis and treatment of RC and at promoting research. In the US, the National Clinical Trials Network launched in 2014 provides, with focus on RC and minorities, infrastructure for NCI‐funded treatment, screening, and diagnosis trials to improve the lives of patients with cancer (https://www.cancer.gov/research/areas/clinical‐trials/nctn).
Recently, the definition of cancer entities was revised 5 according to the 4th version of the WHO classification of tumors publication, following the new WHO Blue Books (http://whobluebooks.iarc.fr/). This new definition was applied to the European data and the Surveillance, Epidemiology, and End Results (SEER) data. 6
Although the two cited studies 1 , 2 reported similar general patterns of RC, they were not powered to identify specific differences in US and Europe because they were conducted independently using different definitions, diagnosis period, and methods. The aim of this paper was to use the revised list of RC and a common methodology to provide a more in‐depth comparison of incidence and survival for RC in the US vs Europe. These comparisons have the potential to highlight important differences and improve our understanding of RC in both locations.
2. MATERIAL AND METHODS
2.1. Cases
We analyzed incidence and survival data collected in 18 SEER registries 6 and in 94 European registries included in the RARECAREnet website. 5 Only population‐based registries were considered. They are aimed at collecting all the cases diagnosed in the reference population by merging all the available demographical, clinical, pathological, and laboratory information, and are bound to code data according to internationally agreed protocols. In addition, CRs follow incident cases for vital status, mainly by linking cancer registry database with the mortality database of the National Statistical Office. Cause of death is collected by SEER registries but not by all European registries. We included all malignant cancers diagnosed during the period 2000‐2007. This period was chosen because it is the most recent period for which European data are available. Different primary RC in a same patients were included in the analysis but only the first primary of a given tumor was considered.
2.2. Methods
Rare cancers entities were defined according to the updated RARECAREnet list (Table S1), slightly revised using topography and morphology codes from the third edition of the International Classification of Diseases for Oncology (ICD‐O‐3) (https://apps.who.int/iris/handle/) and the fourth version of the WHO classification of tumors (http://whobluebooks.iarc.fr/). Cancers that satisfied the RC definition criteria (ie crude incidence rates <6/100 000/y) in SEER and European data were identified, and only those that were rare in both datasets were selected to conduct more detailed comparisons.
US and European data were collected using common protocols worldwide agreed within the community of population based cancer registriestrs 7 , but they might differ according to the compliance to such protocols. As for data quality indicators, the percentage over all cases of those detected from death certificate only were 1.0% in US vs 1.6% in EU, while the proportion of RC censored alive with zero survival time was 0.2% in both datasets. Finally, the proportion of all cases with not otherwise specified (NOS) morphology codes was 3.2% and 9.6% for solid tumors (M8000‐8001, 8800‐8801), and 7.1% and 13.5% for hematological tumors (M 9590‐9591, 9760, 9800‐9801, 9820, 9860) in the US and Europe, respectively.
Incidence was calculated as the ratio between the number of all new cases diagnosed with a given tumor and the number of person‐years lived in the reference population during the considered period. Age‐adjusted incidence rates (ASR, USA 2000 standard population) were compared between SEER and EU in terms of absolute differences and using the z‐test for statistical significance.
We estimated cancer‐specific survival at 5‐year from diagnosis by the net survival (NS) indicator, based on the excess mortality from all causes of patients with respect to age and sex comparable general population groups. We calculated NS by the Pohar‐Perme method, 8 the standard method to provide unbiased survival comparisons between populations subjected to different non‐cancer mortality risks. Survival comparisons used the absolute difference between US and EU NS.
Incidence and survival comparisons by age at diagnosis groups are provided using funnel plots, 9 which are useful to visualize the distribution of a large number of estimates (here, large number of entities). For incidence, the dots represent the ratio (RR) between the ASR in the US divided by that in Europe, and the cone‐shaped area delimited RRs that are not significant by the 3‐standard deviations criterion, a threshold normally used 9 , 10 in funnel plot analysis of many statistical units, corresponding to 99.8% confidence limits. For survival, dots represent the difference of 5‐year NS in the US minus 5‐year NS in Europe, and are again represented together with the 3‐standard deviation confidence limits. All the analyses were carried out by SEER*Stat 4.0 software.
3. RESULTS
3.1. Incidence
The crude annual incidence rate for all RC together was slightly but significantly lower in the US (114/100 000) than Europe (118/100 000) (Table 1). However, the European population was older (17% vs 22% aged 0‐14 and 16% vs 11% aged 65+), so the ranking reversed when comparing ASR (118 vs 101), with the US significantly higher than Europe. Age‐specific incidence rates were lower in EU than in US for the older age classes, so the age distribution of RC cases was similar between the two population. Rare and common cancers in the two populations are represented in Figure 1, which plots crude incidence rates estimated in Eutope (y‐axis) vs the US (x‐axis). According to the RC definition (crude incidence <6/100 000), two cancers (thyroid carcinoma and diffuse B lymphoma) classified as rare in the European population, however, were common in the US (Figure 1, low right square). In contrast, breast invasive lobular carcinoma was common in Europe and rare in the US (Figure 1, high left square). Table 1 shows that incidence of thyroid carcinoma and diffuse B cell lymphoma was, respectively, 80% and 55% higher in the US compared with Europe. Breast invasive lobular carcinoma had almost 40% lower incidence in the US than in Europe. From this point forward, we only considered entities that were rare in both datasets, and we excluded thyroid carcinoma, diffuse B lymphoma and breast lobular carcinoma.
TABLE 1.
Comparison between rare cancers (RC) in Europe and the US (2000‐2007 diagnoses). US and European populations, RC proportions, and rate ratio (a). Number of incidence cases (N), incidence rates standard errors (SE) and incidence rate ratios (b); 5‐y net‐survivals (NS) and 5‐y absolute survival differences (c)
| (a) Age and sex | SEER | EU | SEER/EU rate ratio | ||||
|---|---|---|---|---|---|---|---|
| Population (%) | Rate | RC cases (%) | Population (%) | Rate | RC cases (%) | ||
| 00‐14 y | 22 | 13.9 | 3 | 17 | 11.8 | 2 | 1.18 |
| 15‐24 y | 14 | 18.8 | 2 | 13 | 19.5 | 2 | 0.96 |
| 25‐44 y | 29 | 48.2 | 12 | 29 | 49.0 | 12 | 0.98 |
| 45‐54 y | 14 | 128.6 | 16 | 14 | 120.3 | 14 | 1.07 |
| 55‐64 y | 9 | 241.1 | 20 | 11 | 213.2 | 21 | 1.13 |
| 65‐74 y | 6 | 408.5 | 21 | 9 | 323.5 | 24 | 1.26 |
| 75+ y | 5 | 541.9 | 26 | 7 | 408.8 | 25 | 1.33 |
| Male | 49 | 110.4 | 48 | 49 | 120.1 | 50 | 0.92 |
| Female | 51 | 117.6 | 52 | 51 | 114.9 | 50 | 1.02 |
| (b) Incidence comparisons | Count | Rate | SE | Count | Rate | SE | SEER/EU rate ratio |
|---|---|---|---|---|---|---|---|
| All rare cancers (crude) | 741 658 | 114.1 | 0.13 | 1 840 137 | 117.5 | 0.09 | 0.97 |
| All rare cancers (stand) | 741 658 | 118.3 | 0.14 | 1 840 137 | 100.7 | 0.07 | 1.17 |
| Incidence discordances | |||||||
| Invasive lobular carcinoma of breast a | 36 623 | 5.63 | 0.03 | 121 455 | 7.75 | 0.02 | 0.73 |
| Carcinoma of thyroid gland b | 59 218 | 9.11 | 0.04 | 79 420 | 5.07 | 0.02 | 1.80 |
| Diffuse B lymphoma b | 43 414 | 6.68 | 0.03 | 67 645 | 4.32 | 0.02 | 1.55 |
| (c) Survival comparisons | Count | 5‐y surv (%) | SE (%) | Count | 5‐y surv (%) | SE (%) | SEER‐EU 5‐y survival difference (%) |
|---|---|---|---|---|---|---|---|
| Cancers rare in each dataset | 722 170 | 53.6 | 0.1 | 1 787 618 | 48.2 | 0.1 | 5.4 |
| Invasive lobular carcinoma of breast a | 36 044 | 90.8 | 0.3 | 120 973 | 85.8 | 0.1 | 5.0 |
| Carcinoma of thyroid gland b | 58 573 | 96.1 | 0.2 | 78 533 | 90.1 | 0.2 | 6.0 |
| Diffuse B lymphoma b | 43 199 | 56.3 | 0.3 | 67 907 | 52.6 | 0.3 | 3.7 |
| Cancers rare in both datasets | 686 274 | 51.6 | 0.1 | 1 643 618 | 46.0 | 0.1 | 5.6 |
Population and RC cases columns show age‐ and sex‐specific percentages of the total population and overall cases. Rates are per 100 000 and age‐adjusted to the USA 2000 standard population.
Common in EU.
Common in SEER.
FIGURE 1.
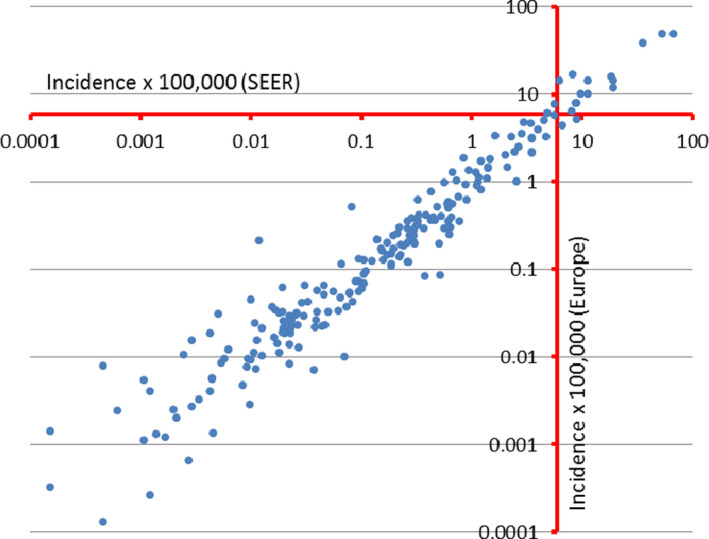
Crude annual incidence rates for cancer entities in Europe (y‐axis) and the US (x‐axis)
Among a total of 196 entities rare in both countries, we reported in Table 2 those with incidence rates significantly different in the two populations by an (arbitrarily chosen) absolute difference of at least 0.2 per 100 000. Most of them (34 out of 43 entities) had higher incidence in the US compared to Europe. Lower incidence in the US compared to Europe was observed for nine entities, including squamous cell carcinoma of larynx, esophagus, and cervix uteri, and esophageal adenocarcinoma (Table 2). Also accounting for the small number of cases through the precision level, differences in incidence appear to be minor for tumors occurring in patients aged <25 years (Figures S1‐S5).
TABLE 2.
ASR of rare cancers with ASR statistically different between Europe and the US, and absolute difference >0.2. Number of cases (N), standard error (SE), 5‐year net survival (NS), incidence and survival absolute difference between the European and the US, also reported
| Cancers | US‐SEER | EUROPE | Incidence difference | Survival difference (%) | |||||
|---|---|---|---|---|---|---|---|---|---|
| N | ASR (SE) | NS (%) | N | ASR (SE) | NS (%) | ||||
| Head and neck | Epithelial tumor of major salivary glands | 7550 | 1.21 (0.014) | 69 | 15 067 | 0.82 (0.007) | 60 | 0.384 | 9 |
| SCC of hypopharynx | 4396 | 0.7 (0.011) | 29 | 19 828 | 1.06 (0.008) | 25 | −0.358 | 4 | |
| SCC of larynx | 22 337 | 3.57 (0.024) | 60 | 72 210 | 3.77 (0.014) | 60 | −0.209 | −1 | |
| SCC of oropharynx | 22 816 | 3.55 (0.024) | 56 | 49 004 | 2.65 (0.012) | 41 | 0.895 | 15 | |
| Rare digestive | SCC of esophagus | 10 801 | 1.75 (0.017) | 14 | 52 597 | 2.74 (0.012) | 11 | −0.995 | 3 |
| Adenocarcinoma of esophagus | 15 049 | 2.43 (0.02) | 18 | 51 138 | 2.66 (0.012) | 13 | −0.238 | 5 | |
| SCC anal canal | 7993 | 1.26 (0.014) | 68 | 12 691 | 0.69 (0.006) | 62 | 0.569 | 6 | |
| Hepatocellular carcinoma of liver and IBT | 30 828 | 4.88 (0.028) | 15 | 50 461 | 2.6 (0.012) | 14 | 2.290 | 1 | |
| Adenocarcinoma of extrahepatic biliary tract | 9315 | 1.52 (0.016) | 16 | 22 507 | 1.16 (0.008) | 19 | 0.359 | −3 | |
| Rare thoracic | Adenosquamous carcinoma of lung | 3738 | 0.61 (0.01) | 28 | 4607 | 0.24 (0.004) | 22 | 0.376 | 6 |
| Large cell carcinoma of lung | 13 178 | 2.15 (0.019) | 14 | 31 589 | 1.63 (0.009) | 10 | 0.513 | 4 | |
| Mesothelioma of pleura and pericardium | 5534 | 0.92 (0.012) | 5 | 28 676 | 1.46 (0.009) | 4 | −0.544 | 0 | |
| Rare female genital | Special types of adenocarcinoma of breast | 23 213 | 3.72 (0.025) | 98 | 48 290 | 2.62 (0.012) | 95 | 1.100 | 3 |
| Serous (papillary) carcinoma of corpus uteri | 3427 | 0.56 (0.01) | 45 | 1317 | 0.07 (0.002) | 40 | 0.492 | 5 | |
| Mullerian mixed tumor of corpus uteri | 3509 | 0.57 (0.01) | 38 | 6293 | 0.32 (0.004) | 36 | 0.247 | 2 | |
| SCC of cervix uteri | 19 443 | 3.03 (0.022) | 69 | 74 103 | 4.37 (0.016) | 66 | −1.338 | 2 | |
| Mucinous adenocarcinoma of ovary | 2820 | 0.44 (0.008) | 57 | 12 066 | 0.67 (0.006) | 60 | −0.227 | −3 | |
| Primary peritoneal serous/papillary carcinoma of ovary | 2478 | 0.4 (0.008) | 30 | 1280 | 0.07 (0.002) | 21 | 0.337 | 8 | |
| Rare male genital and urogenital | Infiltrating duct carcinoma of prostate | 535 | 0.09 (0.004) | 84 | 8064 | 0.4 (0.005) | 78 | −0.315 | 6 |
| Seminomatous testicular cancer | 9730 | 1.49 (0.015) | 98 | 28 516 | 1.81 (0.011) | 97 | −0.320 | 1 | |
| Transitional cell carcinoma of pelvis and ureter | 9186 | 1.52 (0.016) | 48 | 21 975 | 1.13 (0.008) | 51 | 0.395 | −3 | |
| Rare skin | Adnexal carcinoma of skin | 3969 | 0.64 (0.01) | 91 | 5534 | 0.3 (0.004) | 83 | 0.347 | 8 |
| Sarcomas | STS of limbs | 8983 | 1.42 (0.015) | 74 | 17 186 | 0.96 (0.007) | 67 | 0.459 | 7 |
| STS of superficial trunk | 4075 | 0.65 (0.01) | 55 | 7807 | 0.43 (0.005) | 48 | 0.217 | 7 | |
| STS of skin | 4202 | 0.66 (0.01) | 91 | 4734 | 0.28 (0.004) | 90 | 0.389 | 1 | |
| Gastrointestinal stromal sarcoma | 4034 | 0.64 (0.01) | 72 | 4706 | 0.25 (0.004) | 72 | 0.394 | 0 | |
| Kaposi s sarcoma | 4115 | 0.65 (0.01) | 67 | 3893 | 0.23 (0.004) | 79 | 0.423 | −12 | |
| Rare neuroendocrine | Well diff. not funct. endocrine carcinoma of GEP | 16 683 | 2.62 (0.02) | 84 | 15 852 | 0.86 (0.007) | 71 | 1.763 | 13 |
| Poorly differentiated endocrine carcinoma | 4984 | 0.8 (0.011) | 33 | 10 421 | 0.55 (0.005) | 35 | 0.244 | −2 | |
| Typical and atypical carcinoid of the lung | 4321 | 0.69 (0.011) | 87 | 6160 | 0.34 (0.004) | 81 | 0.349 | 7 | |
| Neuroendocrine carcinoma of skin | 3312 | 0.55 (0.01) | 54 | 3026 | 0.16 (0.003) | 55 | 0.388 | −1 | |
| Neuroendocrine carcinoma of other sites | 7265 | 1.17 (0.014) | 24 | 14 120 | 0.75 (0.006) | 24 | 0.427 | 1 | |
| CNS | Astrocytic tumors of CNS | 29 997 | 4.75 (0.028) | 18 | 78 005 | 4.31 (0.016) | 15 | 0.444 | 3 |
| Rare hemathologic | Hodgkin lymphoma, classical | 17 333 | 2.67 (0.02) | 81 | 38 588 | 2.37 (0.012) | 81 | 0.305 | 0 |
| Precursor B/T lymphoblastic leuk/lymphoma | 13 827 | 2.14 (0.018) | 60 | 22 795 | 1.57 (0.011) | 58 | 0.568 | 2 | |
| T cutaneous lymphoma | 5088 | 0.81 (0.011) | 84 | 5526 | 0.3 (0.004) | 81 | 0.506 | 3 | |
| Other T cell lymphomas and NK cell neoplasms | 5903 | 0.94 (0.012) | 40 | 9656 | 0.53 (0.005) | 39 | 0.406 | 1 | |
| Plasmacytoma/multiple myeloma | 36 867 | 5.99 (0.031) | 38 | 89 440 | 4.65 (0.016) | 34 | 1.340 | 4 | |
| Mantle cell lymphoma | 4407 | 0.71 (0.011) | 50 | 8748 | 0.45 (0.005) | 42 | 0.262 | 7 | |
| Acute myeloid leukemia | 26 247 | 4.25 (0.026) | 16 | 60 891 | 3.33 (0.014) | 17 | 0.919 | 0 | |
| Chronic myeloid leukemia | 7694 | 1.22 (0.014) | 65 | 17 473 | 0.97 (0.007) | 53 | 0.256 | 12 | |
| Other myeloproliferative neoplasms | 16 073 | 2.59 (0.021) | 80 | 33 954 | 1.82 (0.01) | 73 | 0.774 | 7 | |
| Other myelodysplastic syndromes | 22 887 | 3.8 (0.025) | 40 | 33 542 | 1.79 (0.01) | 31 | 2.011 | 9 | |
Abbreviations: ASR, age‐adjusted incidence rates; GEP, gastroenteropancreatic tract; IBT, intrahepatic biliary tract; NS, net survival; SCC, squamous cell carcinoma; SE, standard error; STS, Soft tissue sarcoma.
3.2. Survival
Five‐year NS for all RC combined significantly differed: 54% in the US and 48% in Europe (Table 1). Figure 2 shows a funnel plot representing 5‐year NS differences in the US vs Europe and the 3‐standard deviations control limits for 187 entities with at least 5 cases in each population. For most entities, the dots representing NS lie between the 3‐standard errors confidence bounds. Survival was higher in the US for 62 and higher in Europe for 6 entities that fall respectively above and below the limits. Entities with differences in survival were not concentrated in a particular cancer family. Table 3 lists 47 outlier entities with estimated differences >5% in absolute value. Prostate transitional carcinoma, sarcoma of Kaposi, and visceral sarcoma had significantly better survival in Europe. However, most entities (44) had better survival in the US, with the most important differences (>15%) estimated for example for head and neck salivary gland type tumor, lung salivary gland type tumor, chordoma, eye and adnexa adenocarcinoma, CNS oligodendroglial tumors, and histiocytic malignancies.
FIGURE 2.
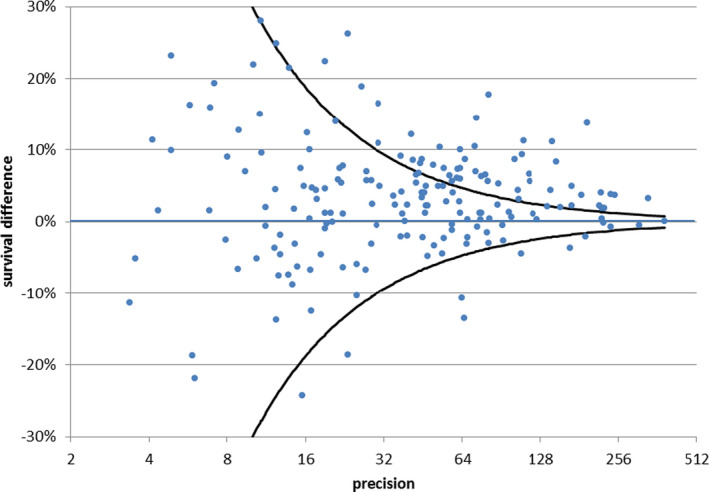
Difference between 5‐y net survival (NS) for rare cancers (RC) in US and Europe, period of follow‐up 2000‐2007. Funnel plot in which each dot represents a single RC, the y‐axis displays the estimated difference in 5‐y NS, and the x‐axis the corresponding precision in terms of the inverse of its SE. Three‐SE confidence bounds are represented by two symmetrical lines progressively approaching the y = 0 line with increasing x values. Dots lying above or below the area between them correspond respectively to tumors with 99.8% significantly higher or lower NS
TABLE 3.
5‐y net survival of rare cancers with net survival statistically different between Europe and the US. Number of cases (N), Net survival and corresponding standarad errors (SE), age standardized incidence rates (ASR), and absolute survival and incidence differences between Europe and the US, also reported
| Cancers | US‐SEER | Europe | Survival difference (%) | Incidence difference | |||||
|---|---|---|---|---|---|---|---|---|---|
| N | Net Surv (SE) | ASR | N | Net Surv (SE) | ASR | ||||
| Head and neck | SCC of nasopharynx | 3038 | 55.6 (1.12) | 0.473 | 5589 | 48.1 (0.8) | 0.316 | 8 | 0.157 |
| Epithelial tumor of major salivary glands | 7493 | 69.3 (0.8) | 1.206 | 14 717 | 60.1 (0.58) | 0.822 | 9 | 0.384 | |
| Salivary gland type tumor of head and neck | 2962 | 82.2 (1.1) | 0.471 | 6684 | 66.6 (0.81) | 0.367 | 16 | 0.105 | |
| SCC of oropharynx | 22 571 | 55.6 (0.43) | 3.548 | 48 584 | 41.1 (0.27) | 2.653 | 15 | 0.895 | |
| SCC of oral cavity | 17 959 | 53.8 (0.52) | 2.947 | 54 229 | 48 (0.28) | 2.957 | 6 | −0.011 | |
| Rare digestive | SCC of rectum | 1209 | 59.6 (1.88) | 0.192 | 1777 | 46.5 (1.54) | 0.094 | 13 | 0.098 |
| SCC of anal canal | 7954 | 67.9 (0.73) | 1.258 | 12 847 | 62.2 (0.6) | 0.688 | 6 | 0.569 | |
| Intraductal papillary mucinous carcinoma of pancreas | 119 | 57.6 (6.29) | 0.019 | 171 | 31.4 (4.9) | 0.009 | 26 | 0.011 | |
| Rare thoracix | Adenosquamous carcinoma of lung | 3718 | 28.1 (0.97) | 0.612 | 4566 | 21.8 (0.76) | 0.236 | 6 | 0.376 |
| Salivary gland type tumor of lung | 261 | 66.5 (3.84) | 0.041 | 880 | 39.7 (1.94) | 0.049 | 27 | −0.007 | |
| Rare female genital | Metaplastic carcinoma of breast | 1708 | 70.6 (1.69) | 0.272 | 1897 | 63.6 (1.62) | 0.103 | 7 | 0.170 |
| Adenocarcinoma of cervix uteri | 5771 | 73.7 (0.72) | 0.905 | 14 221 | 66.6 (0.47) | 0.837 | 7 | 0.067 | |
| Clear cell adenocarcinoma of ovary | 2022 | 66.2 (1.31) | 0.311 | 4761 | 55.5 (0.88) | 0.258 | 11 | 0.054 | |
| Primary peritoneal serous/papillary carcinoma of ovary | 2474 | 29.7 (1.23) | 0.402 | 1280 | 21.4 (1.55) | 0.066 | 8 | 0.337 | |
| Adenocarcinoma of falloppian tube | 1296 | 68.4 (1.82) | 0.207 | 2690 | 58.8 (1.26) | 0.140 | 10 | 0.066 | |
| Malignant/immature teratoma of ovary | 508 | 93.6 (1.21) | 0.077 | 829 | 83.1 (1.47) | 0.053 | 11 | 0.024 | |
| Germ cell tumor of ovary | 620 | 92.6 (1.13) | 0.094 | 1143 | 86.5 (1.12) | 0.077 | 6 | 0.017 | |
| SCC of vulva and vagina | 7852 | 68.5 (0.8) | 1.283 | 26 271 | 59.5 (0.48) | 1.415 | 9 | −0.133 | |
| Adenocarcinoma of vulva and vagina | 607 | 55.9 (2.65) | 0.097 | 1115 | 45.9 (1.92) | 0.060 | 10 | 0.037 | |
| Rare male genital and urogenital | Transitional cell carcinoma of prostate | 125 | 33.8 (5.96) | 0.021 | 941 | 56.6 (2.41) | 0.049 | −23 | −0.028 |
| Epithelial tumor of eye and adnexa | Adenocarcinoma of eye and adnexa | 112 | 75.2 (5.76) | 0.018 | 218 | 52.8 (4.33) | 0.012 | 22 | 0.006 |
| Mesothelioma | Mesothelioma of peritoneum and tunica vaginalis | 618 | 21.1 (2.05) | 0.100 | 1999 | 12.7 (0.93) | 0.107 | 8 | −0.007 |
| Rare melanomas | Malignant melanoma of uvea | 3194 | 82.3 (1.16) | 0.508 | 8024 | 70.7 (0.77) | 0.311 | 12 | 0.075 |
| Rare skin | Adnexal carcinoma of skin | 3864 | 91 (1.26) | 0.643 | 5503 | 83.4 (1.25) | 0.296 | 8 | 0.347 |
| Embrional | Neuroblastoma and ganglioneuroblastoma | 1441 | 73.8 (1.31) | 0.220 | 2135 | 68 (1.09) | 0.178 | 6 | 0.042 |
| Sarcomas | STS of limbs | 8934 | 73.7 (0.69) | 1.420 | 17 101 | 67.1 (0.51) | 0.961 | 7 | 0.459 |
| STS of superficial trunk | 4056 | 54.9 (1.03) | 0.647 | 7717 | 47.7 (0.73) | 0.430 | 7 | 0.217 | |
| STS of viscera | 1845 | 32.1 (1.33) | 0.299 | 5856 | 42.1 (0.8) | 0.318 | −10 | −0.019 | |
| STS of retroperitoneum and peritoneum | 2127 | 45 (1.38) | 0.342 | 4851 | 38.2 (0.86) | 0.264 | 7 | 0.078 | |
| STS of pelvis | 2000 | 55.3 (1.44) | 0.318 | 3008 | 47.3 (1.13) | 0.169 | 8 | 0.149 | |
| Ewing's sarcoma of soft tissue | 690 | 54.1 (2.08) | 0.106 | 1079 | 44.8 (1.69) | 0.071 | 9 | 0.035 | |
| Osteogenic sarcoma | 1933 | 58.2 (1.28) | 0.298 | 3757 | 50.6 (0.93) | 0.249 | 8 | 0.048 | |
| Chondrogenic sarcoma | 1720 | 77.6 (1.35) | 0.270 | 4521 | 69.4 (0.89) | 0.263 | 8 | 0.007 | |
| Notochordal sarcoma, chordoma | 573 | 76.9 (2.59) | 0.091 | 1127 | 59.3 (1.97) | 0.064 | 18 | 0.027 | |
| Kaposi's sarcoma | 4055 | 67.1 (1.04) | 0.649 | 3830 | 78.8 (1.12) | 0.226 | −12 | 0.423 | |
| Rare neuroendocrine | Well diff not functioning endocrine carcinoma of GEP | 16 439 | 84 (0.47) | 2.625 | 15 656 | 71.4 (0.51) | 0.862 | 13 | 1.763 |
| Well diff functioning endocrine carcinoma of GEP | 150 | 83.6 (4.33) | 0.024 | 407 | 60.3 (2.97) | 0.023 | 23 | 0.001 | |
| Typical and atypical carcinoid of the lung | 4274 | 87.4 (0.88) | 0.689 | 6058 | 80.6 (0.69) | 0.340 | 7 | 0.349 | |
| CNS | Oligodendroglial tumors of CNS | 2909 | 69.7 (0.99) | 0.451 | 6124 | 51.5 (0.74) | 0.365 | 18 | 0.086 |
| Ependymal tumors of CNS | 1591 | 82.1 (1.21) | 0.246 | 3185 | 72.7 (0.91) | 0.204 | 9 | 0.042 | |
| Neuronal and mixed neuronal‐glial tumors | 55 | 78 (6.13) | 0.008 | 74 | 49.4 (6.86) | 0.005 | 29 | 0.004 | |
| Rare hemathologic | Malignant meningiomas | 889 | 64.7 (2.12) | 0.146 | 3117 | 55.8 (1.14) | 0.183 | 9 | −0.036 |
| Mantle cell lymphoma | 4389 | 49.9 (1.08) | 0.715 | 8797 | 42.4 (0.73) | 0.453 | 7 | 0.262 | |
| Chronic myeloid leukemia | 7560 | 65.3 (0.75) | 1.223 | 16599 | 53.2 (0.5) | 0.967 | 12 | 0.256 | |
| Other myeloproliferative neoplasms | 15 861 | 80 (0.58) | 2.591 | 33 599 | 73.4 (0.4) | 1.817 | 7 | 0.774 | |
| Other myelodysplastic syndrome | 22 437 | 40.1 (0.54) | 3.797 | 32 576 | 30.7 (0.39) | 1.786 | 9 | 2.011 | |
| Histiocytic malignancies | 211 | 81.6 (3.06) | 0.033 | 645 | 62.5 (2.28) | 0.043 | 19 | −0.011 | |
Abbreviations: CNS, central nervous system; GEP, gastroenteropancreatic tract; SCC, squamous cell carcinoma; SE, standard errors; STS, soft tissue sarcoma.
Five‐year NS differences by age are represented, vs precision of estimates, in funnel plots, (Figures S6‐S9). The number of significant differences increased by age group. CNS oligodendroglial tumors were the only entity with significant survival differences for childhood cancers (<15 years), and only four RC differed in the adolescent and young adult aged 15‐24 years. The highest number of survival differences significantly higher in the US than European population, was found for cases aged at diagnosis >65 years.
Tables 2 and 3 also report, for the entities with most relevant differences in incidence and survival, their respective estimates of survival and incidence. The same data are also shown in Tables S2 and S3 with European incidence and survival indicators disentangled by European geographical region (North, UK & Ireland, Center, South and East). Overall, no major relation was found between the two indicators for the entities selected in the two tables. Only 14 cancers are listed in both tables. Kaposi sarcoma had higher incidence (0.6 vs 0.2) and lower survival (67 vs 79) in the US compared to Europe. The other 13 entities had both quantities higher in the US. Particularly striking incidence differences were estimated for well differentiated not functioning endocrine carcinoma of GEP (2.6 vs 0.9) and for other myelodysplastic syndromes (3.8 vs 1.8), to which correspond a survival advantage of 13 and 9 percentage points, respectively.
4. DISCUSSION
This first comparative analysis shows that both incidence and survival of RC, diagnosed during the period 2000‐2007, significantly differed between Europe and the US. We have to remind that, while health care is under the competence of single European countries, policy on rare disease (and rare cancers) is coordinated by EU. Important programs have been introduced in Europe, such as European Joint Actions on rare cancers, 3 the establishment of European Reference Networks, and of cross‐border care directive. 4 Furthermore, a universalist public health system is common to all European countries. This paper was aimed at giving baseline comparison data between Europe as a whole and a big country as US, differently organized with respect to health care system, policy plans and with large health care disparities.
Age‐adjusted incidence for all RC cancers combined was significantly higher (+17%) in the US than in Europe and almost half of the analyzed RC had higher incidence rates in the US. Possible reasons for such differences include the distribution of risk factors, “artificial” factors such as overdiagnosis, differences in the ability to diagnose RC, and different registration practices and use of classification codes in the two populations. In Figure S10, we show the major risk factors associated with increased risks for those RC that had significant differences in age‐adjusted incidence between the two populations and listed in Table 2. Below, we highlight the most important associations and provide insights on the differences where possible.
Tobacco is associated with increased risk for most of the epithelial RC and leukemias. 11 , 12 , 13 , 14 Although smoking prevalence is now slightly higher in Europe than the US, 15 the incidence of many epithelial cancers and of leukemia, is higher in the US compared to Europe. However, prevalence of smoking has reduced more rapidly in the US than Europe, starting from similar rates in 1980.
Alcohol consumption is mainly related to the epithelial tumors of head and neck, liver, and esophagus, 11 , 16 however the consumption was higher at the beginning of this century and remains slightly higher in many of the major European countries (the UK, Germany, France Italy and the Netherlands). 17 Actually, rates for esophageal and all the head and neck cancers, except the oropharyngeal cancer, are higher in Europe than in the US.
The occurrence of RC of the cervix, stomach, liver, oropharynx, nasopharynx, anogenital sites, lymphomas, and Kaposi sarcoma is related to specific infectious agents. 11 , 16 A recent study showed that the attributable fractions of cancer cases related to the infections were slightly higher in Europe compared to the US. 18
Obesity is more prevalent in the US. Obesity/overweight is a risk factor for the epithelial tumors of the esophagus and extrahepatic biliary tract (EBT). Also, a fraction of pancreas, liver, kidney, corpus uteri, breast, ovary, and colorectal cancers are related to obesity, so rare entities of these cancer sites are likely associated with obesity as well. 16
According to the International Agency for Research on Cancer (IARC) monographs and a review by Charbothel, 19 many RC are consistently linked to occupational factors. However, it is difficult to estimate the prevalence of individuals exposed to occupational risk factors.
Access to effective screening, which is mostly organized in Europe and opportunistic in the US, can affect the incidence of cervix cancer and RC of the breast, colon and rectum. Screening initially increases the number of cases that are at an early stage at presentation and have high survival, and it subsequently leads to a decrease in incidence, perhaps followed by a stabilization. A different intensity of investigations for skin, kidney, prostate, and lung cancers could also affect the incidence of rare lesions in these cancer sites. Overdiagnosis leads to increased incidence and survival.
The incidence of gastrointestinal stromal tumor (GIST), large cell carcinoma of lung, neuroendocrine tumors, and many hematologic malignancies may be influenced by sounder pathological diagnosis and/or prompter and more correct adoption by registries of new entity codes in the ICD‐O‐3 coding procedures. We also know that the availability of tests for a correct diagnosis may be less in some European countries, such as in eastern Europe. 2 Furthermore, a center of expertise with the option of a pathologic second opinion may be less available in some small European countries. Most tumors with higher incidence in the US than in Europe have recently been subject to classification changes; therefore, we can infer that part of the difference is explained by better tumor classification in the US by both pathologists and registrars.
Five‐year NS for all RC together was higher in the US than Europe. Many of the factors described above for incidence may also explain variations in survival, 16 since different risk factors can generate biologically different diseases with different prognoses. This is the case for epithelial oropharyngeal cancer and squamous cell carcinoma of anogenital sites; a different proportion of tumors caused by HPV, characterized by less aggressive lesions, may have influenced the survival gap. A 2014 study showed that the proportion of HPV‐positive oropharynx cancers is higher in the US than in the European populations. 20 The high prevalence of HIV‐infected individuals in the US, related to high AIDS rates, may explain the worse outcomes for the more aggressive form of Kaposi sarcoma in the US. 21
Early stage at presentation increases therapy effectiveness and consequently improves survival. Timely access to new drugs (eg for chronic myeloid leukemia and other hematological malignancies), updated treatment protocols, and multimodality treatment influence survival. All these factors may be differentially available, creating disparities between countries. Although data are lacking on the patterns of care for the two populations and among the European countries, they may explain the higher survival for leukemia, especially CML, in the US compared to Europe. Overall, the organization of management of RC (centralization, hospital volume, second opinion, multidisciplinary approach, clinical research, network, etc) is crucial for improving the outcome, especially for patients with RC. Also, new diagnostic approaches relevant for improving problematic diagnoses, as those for many RC, can be differently available in the two regions, as well as the availability of more effective and expensive treatment protocols.
Incidence and survival are higher in the US than Europe 22 , 23 not only for rare but also for common cancers. The two regions also differ in health system organization: universalistic in Europe vs private in the US, and we cannot exclude the possibility that more intensive investigations in the US population produce higher cancer incidence and higher incidence of early‐stage cases, leading to a more favorable outcome. Furthermore, investments, management, and health care plans are different between European countries, even with universalistic provision of care. In all EUROCARE studies, age‐adjusted 5‐year survival varied markedly between Nordic and Central, and Eastern countries; this has also been shown for RC combined, even after adjusting by case mix. 24 Eastern European countries had lower survival, and also lower incidence, for many RC (Tables S2 and S3), but they only contributed by 15% of the considered cases and 17% of the total amount of person‐years. Removal of Eastern European countries only slightly changed (not shown in tables) the incidence and survival differences between EU and US.
The two datasets considered in this analysis have been consistently used in previous comparative population based international studies. 22 , 23 Such studies were, however, mainly addressing common cancers. A reliable epidemiological description of RC entities requires a low proportion of cases detected by death certificates and of cases with NOS morphology, as different and high proportions of unknown morphology codes can affect the quality of comparison. In our study, the proportions of DCO was negligible in both datasets, while those of NOS were higher in Europe than in US. A SEER based study has shown that breast cancers with missing information on biomarkers had poorer prognosis than those with reported information. 25 It may be plausible that tumors coded as NOS are more likely to be rare or of more complex diagnosis and poor prognosis. Thus, a higher proportion of NOS morphologic groups is indicative of incidence underestimation for some RC.
The European database includes 94 registries, and even with great standardization efforts, thanks to the European Network of Cancer Registries (ENCR), and to centralized quality checks by the EUROCARE and RARECAREnet groups, one cannot eliminate a certain level of heterogeneity in registration among the European registries, which may be greater than in the 18 US registries considered.
The study period considered in this paper is not recent, because of challenges in obtaining more updated data from the European registries. However, by using the same period of diagnosis, we provide more accurate comparisons than previous papers. 1 , 2 Finally, clinical information on stage and treatment is incompletely collected by many European registries, which precludes a more extensive comparison.
Centralization and networking, the most appropriate answers to the issues pertaining to RC, were not optimal in Europe during the period of our analisys, 2 but we know about ameliorative efforts in the national organization plans, in the majority of the studied countries. 2 An opportunity to improve survival (and possibly reduce incidence) in Europe, however too recent to have impacted on the results of this paper, comes from the implementation of the ERNs. The Joint Action of Rare Cancers, the major European initiative aimed at prioritizing RC in the agendas of the European Member States, ended in 2019.
The role of population based cancer registries still remains crucial to describe the real world impact of cancer and to evaluate progresses made. Their results have to be as much as possible uniformed at the European level in timeliness and in quality. This study suggests an important role for registration/classification practices, which should be enabled to keep up with advances in cancer research, codifying with more precision the cancer's topography, morphology, stage, and possibly other prognostic factors. We benefited from the RARECARE definition of RC. The corresponding list will be made available soon, and a variable in the SEER*Stat software will provide the means to conduct further studies on RC entities in the US.
In conclusion, we have shown using standardized methods that differences exist on incidence and survival of RC in the US and Europe. We provided some interpretation for incidence and survival differences. Our findings suggest opportunities for further research to understand the burden of RC and to spur greater international collaboration on the study of RC, with the goal of greater awareness, knowledge and therefore providing inputs in their prevention, diagnosis and treatment. We, also, provided basic information for the organization of clinical studies. In RC research, the larger is the collaboration the greater the chance to make progress.
CONFLICT OF INTEREST
None.
AUTHOR CONTRIBUTIONS
Laura Botta contributed to conceptualization, data curation, formal analysis, methodology, software, visualization, writing – original draft and writing – review and editing. Riccardo Capocaccia contributed to conceptualization, data curation, formal analysis, methodology, funding acquisition, software, writing – original draft, and writing – review and editing. Annalisa Trama contributed to data curation, project administration, and writing – review and editing. Alice Bernasconi contributed to data curation and writing – review and editing. Elad Sharon contributed to writing – review and editing. Gemma Gatta contributed to conceptualization, data curation, methodology, funding acquisition, project administration, writing – original draft, and writing – review and editing. Angela Mariotto contributed to conceptualization, methodology, funding acquisition, project administration, writing – original draft, and writing – review and editing.
Supporting information
Supplementary Material
Supplementary Material
ACKNOWLEDGMENTS
We thank Otto Visser, Maria Jose Bento, Francesca Bella for their important comments and Lucia Buratti for technical support.
Botta L, Gatta G, Trama A, et al; RARECAREnet working group . Incidence and survival of rare cancers in the US and Europe. Cancer Med. 2020;9:5632–5642. 10.1002/cam4.3137
Laura Botta and Gemma Gatta are co‐first authors.
Funding information
This work was supported by the NIH Project title “Surveillance of Rare Cancers” in the Surveillance, Epidemiology, and End Results Program (SEER), Contract Award n. HHSN261201700656P and the European Union's Health Programme (2014‐2020) [grant no. 724161]. Project title “Joint Action on rare Cancers” – JARC.
[Correction added on 23 June 2020, after first online publication: The affiliation of the corresponding author, Riccardo Capocaccia, has been corrected in this version.]
DATA AVAILABILITY STATEMENT
The US data that support the findings of this study are openly available in “SEER” database at www.seer.cancer.gov. The European data that support the findings of this study are available on request from the corresponding author, conditional to the agreement of the contributing cancer registries. The data are not publicly available due to privacy restrictions.
REFERENCES
- 1. DeSantis CE, Kramer JL, Jemal A. The burden of rare cancers in the United States. CA Cancer J Clin. 2017;67(4):261‐272. [DOI] [PubMed] [Google Scholar]
- 2. Gatta G, Capocaccia R, Botta L, et al. Burden and centralised treatment in Europe of rare tumours: results of RARECAREnet‐a population‐based study. Lancet Oncol. 2017;18(8):1022e39. [DOI] [PubMed] [Google Scholar]
- 3. Joint Action on Rare Cancers Launch . European Cancer Patient Coalition. http://ecpc.org/Documents/Projects/RARECAREnet. Accessed April 1, 2019.
- 4. European Parliament and the Council of the European Union . Directive 2011/24/EU of the European Parliament and of the Council of 9 March 2011 on the application of patients’ rights in cross‐border healthcare. Official Journal of the European Union n° L 88/45 of 4.4.2011.
- 5. http://www.rarecarenet.eu/rarecarenet/index.php/cancerlis Accessed September 10, 2019.
- 6. Surveillance, Epidemiology, and End Results (SEER) Program . SEER*Stat Database: Incidence–SEER 18 Regs Research Data + Hurricane Katrina Impacted Louisiana Cases, Nov. 2016 Sub (1973‐2014 varying)–Linked To County Attributes‐Total US, 1969‐2016 Counties. National Cancer Institute, Division of Cancer Control and Population Sciences, Surveillance Research Program, Surveillance Systems Branch; 2016.
- 7. Jensen OM, Parkin DM, MacLennan R, Muir CS, Skeet RG. (editors). Cancer Registration: Principles and Methods, chapters 5–7. IARC Scientific Publication No. 95. ISBN‐13 978–92‐832‐1195‐2.
- 8. Perme MP, Stare J, Esteve J. On estimation in relative survival. Biometrics. 2012;68:113‐120. [DOI] [PubMed] [Google Scholar]
- 9. Quaresma M, Coleman MP, Rachet B. Funnel plots for population‐based cancer survival: principles, methods and applications. Stat Med. 2014;33:1070‐1080. [DOI] [PubMed] [Google Scholar]
- 10. Spiegelhalter DJ. Funnel plots for comparing institutional performance. Stat Med. 2005;24(8):1185‐1202. [DOI] [PubMed] [Google Scholar]
- 11. IARC . List of Classifications by cancer sites with sufficient or limited evidence in humans, Volumes 1 to 108*. 2013. http://monographs.iarc.fr/ENG/Classification/Table4.pdf Accessed November 30, 2019.
- 12. Leoncini E, Carioli G, La Vecchia C, Boccia S, Rindi G. Risk factors for neuroendocrine neoplasms: a systematic review and meta‐analysis. Ann Oncol. 2016;27:68‐81. [DOI] [PubMed] [Google Scholar]
- 13. Welton ML, Sharkey FE, Kahlenberg MS. The epidemiology of anal cancer. Surg Oncol Clin North Am. 2004;13:263‐275. [DOI] [PubMed] [Google Scholar]
- 14. Sawabe M, Ito H, Takahara T, et al. Heterogeneous impact of smoking on major salivary gland cancer according to histopathological subtype: a case‐control study. Cancer. 2018;124(1):118‐124. [DOI] [PubMed] [Google Scholar]
- 15. Our world in data . Smoking by Hannah Richie and Max Roser. https://ourworldindata.org/smoking. Accessed April 1, 2019.
- 16. WCRF/American Institute for Cancer Research . Diet, Nutrition and Physical Activity and Cancer: a global perspective. Continuous Update Project Expert Report 2018. https://www.wcrf.org/dietandcancer Accessed November 30, 2019.
- 17. Our world in data . Alcohol Consumption by Hannah Richie and Max Roser. https://ourworldindata.org/alcohol‐consumption. Accessed April 1, 2019.
- 18. Plummer M, de Martel C, Vignat J, et al. Global burden of cancers attributable to infections in 2012: a synthetic analysis Lancet Glob. Health. 2016;4:e609‐e616. [DOI] [PubMed] [Google Scholar]
- 19. Charbotel B, Fervers B, Droz JP. Occupational exposures in rare cancers: a critical review of the literature. Crit Rev Oncol Hematol. 2014;90(2):99‐134. [DOI] [PubMed] [Google Scholar]
- 20. Combes JD, Chen AA, Franceschi S. Prevalence of human papillomavirus in cancer of the oropharynx by gender. Cancer Epidemiol Biomarkers Prev. 2014;23(12):2954‐2958. [DOI] [PubMed] [Google Scholar]
- 21. Armstrong AW, Lam KH, Chase EP. Epidemiology and Infection; Epidemiology Of Classic And AIDS‐related Kaposi's sarcoma in the USA: incidence, survival, and geographical distribution from 1975 to 2005. Epidemiol Infect. 2013;141(1):200‐206. [DOI] [PMC free article] [PubMed] [Google Scholar]
- 22. Torre LA, Bray F, Siegel RL, et al. Global cancer statistics. 2012. CA Cancer J Clin. 2015;65(2):87‐108. [DOI] [PubMed] [Google Scholar]
- 23. Allemani C, Matsuda T, Di Carlo V, et al. Global surveillance of trends in cancer survival 2000–14 (CONCORD‐ 3): analysis of individual records for 37 513 025 patients diagnosed with one of 18 cancers from 322 population‐based registries in 71 countries. Global Surveillance of Trends in Cancer Survival 2000–14 (CONCORD‐3): analysis of individual records for 37 513 025 patients diagnosed with one of 18 cancers from 322 population‐based registries in 71 Countries. Lancet. 2018;391(10125):1023‐1075. [DOI] [PMC free article] [PubMed] [Google Scholar]
- 24. Gatta G, Trama A, Capocaccia R, et al.; RARECARENet Working Group . Epidemiology of Rare Cancers and inequalities in oncologic outcomes. Eur J Surg Oncol. 2019;45(1):3‐11. [DOI] [PubMed] [Google Scholar]
- 25. Howlader N, Cronin KA, Kurian AW, Andridge R. Differences in breast cancer survival by molecular subtypes in the United States. Cancer Epidemiol Biomarkers Prev. 2018;27(6):619‐626. [DOI] [PubMed] [Google Scholar]
Associated Data
This section collects any data citations, data availability statements, or supplementary materials included in this article.
Supplementary Materials
Supplementary Material
Supplementary Material
Data Availability Statement
The US data that support the findings of this study are openly available in “SEER” database at www.seer.cancer.gov. The European data that support the findings of this study are available on request from the corresponding author, conditional to the agreement of the contributing cancer registries. The data are not publicly available due to privacy restrictions.