Abstract
Background
Galangin has been extensively studied as the antitumor agent in various cancers. However, the effect of galangin in hepatocellular carcinoma (HCC) remains elusive.
Methods
Using RNA sequencing, the differential expression of lncRNA in human HCC cell line with highly metastatic potential (MHCC97H) cells treated with galangin was investigated. Furthermore, H19 expression pattern was also determined in MHCC97H cells following treatment with galangin. In addition, knockdown and overexpression of H19 was performed to analyze the effect of the expression pattern of H19 on cell apoptosis, cell cycle, migration, and invasion in HCC cells. Moreover, the in vivo effect of galangin on tumor development was also determined in nude mice. In order to analyze loss expression of H19 in vivo, clustered regularly interspaced short palindromic repeats/Cas9 (CRISPR/Cas9) was used.
Results
Total of 50 lncRNAs were significantly differentially expressed in MHCC97H cells treated with galangin. Besides, the expression of H19 was markedly reduced following treatment with galangin in MHCC97H cells. Compared to the Control group, the galangin‐treated group inhibited cell migration and invasion. Knockdown of H19 expression showed increased cell apoptosis and decreased invasion. In addition, RNA‐seq data also identified 161 mRNA which was significantly differentially expressed following treatment with galangin. To further determine the underlying mechanism, p53 protein was analyzed. Notably, the results indicated that knockdown of H19 and miR675 induced the expression of p53, eventually promoting cell apoptosis in MHCC97H cells. These results indicated that galangin promoted cell apoptosis through reduced the expression of H19 and miR675 in MHCC97H cells. The in vivo result showed that compared to the Con, tumor growth was remarkably suppressed with loss expression of H19.
Conclusion
Our data suggested that galangin has a crucial role in hepatocarcinogenesis through regulating the expression pattern of H19.
Keywords: cell apoptosis, galangin, gene expression, H19, RNA‐seq
Amount 50 lncRNAs were differentially expressed in galangin‐treated by RNA‐Seq. H19 induced cell apoptosis through p53 protein after galangin treatment. Target knock out H19 expression using CRISPR/Cas9.
1. INTRODUCTION
HCC is the most cause of cancer deaths which was malignancy in liver. Long non‐coding RNAs (lncRNAs) have been identified as an effective modulator of carcinogenesis; besides, abnormal expression of lncRNAs has been related to the initiation, progression, and metastasis in HCC. 1 , 2 Indeed, lncRNA H19, a paternally imprinted gene, is recognized to have a key role in the carcinogenic process. 3 In recent years, altered expression of H19 has been demonstrated in various cancers including bladder cancer 4 and nasopharyngeal carcinoma. 5 miR675, microRNA embedded in the first exon 1 of H19, has shown to exert an oncogenic role in liver cancers. 6 , 7 Moreover, increasing evidence indicated that H19 regulates the level of miR675; thus, H19 can regulate a number of biological processes through miR675. Besides, studies have also suggested that the H19/miR675 axis may contribute to carcinogenesis through the oncogenic function of miR675. 8 , 9 However, aberrant expression of H19 and miR675 can influence tumor cell behavior in HCC to remain elusive.
Galangin, a natural dietary flavonoid, is derived primarily from honey and root of Alpinia officinarum Hance (Zingiberaceae), which exhibits antimicrobial, antiperoxidative, anti‐inflammatory, and antitumor properties and is extensively used as a traditional medicine in China. 10 Recently, galangin has been shown to have role in treating various cancer including HCC. 11 Accumulating evidence suggested that galangin exerts antitumor effects through induction of cell apoptosis, inhibition of cell migration in kidney tumor. 12 Moreover, galangin could inhibit the growth of human breast cancer cells MCF7 and induce cell apoptosis. 13 A recent study also indicated that the anticancer activity of galangin regulated p53 expression in nasopharyngeal carcinoma (NPC) cells. 14 Moreover, galangin could induce cell apoptosis via Caspase‐3 in retinoblastoma. 15 These studies suggested that galangin has a crucial role in cell apoptosis.
Indeed, the major factor of liver cancer was metastasis. MHCC97H and HCC‐LM3 were both from HCC cell line with high metastatic potential (MHCC97). 16 Our study focussed on migration and invasion of HCC cells. Moreover, MHCC97H and HCC‐LM3 were suitable for the analysis of the expression of genes and proteins. Thus, MHCC97H and HCC‐LM3 were selected. As herbal medicines, galangin (3,5,7‐trihydroxyflavone) was a potential drug for the treatment of HCC. 17 There is evidence that galangin has benefits to reduce the risk of cancer. 18 Previous report indicated that abnormal epigenetic modification and the expression of cancer‐related genes might contribute to HCC progression. 19 For the treatment of HCC, screening of miRNA or lncRNA biomarkers is gradually becoming the hottest issues. In the present study, RNA sequencing was performed to analyze the differential expression of lncRNA. Furthermore, the expression of H19 was determined in MHCC97H cells following treatment with galangin. The effect of knockdown and overexpression of H19 on cell apoptosis, growth, cycle, migration, and invasion was also evaluated. Considering of CRISPR/Cas9 system is highly efficient for gene editing 20 ; thus, the effect of H19 knock out (KO) on tumor development was also evaluated in vivo in nude mice. Our findings suggested that galangin has a significant role in hepatocarcinogenesis through regulating the expression of H19.
2. MATERIALS AND METHODS
2.1. Cell culture and drug treatment
Human HCC cell lines (MHCC97H, MHCC97L, and HCC‐LM3) were obtained from Liver Cancer Institute (Zhongshan Hospital, Fudan University). 21 The cells were incubated in Dulbecco's modified Eagle's medium (DMEM; Gibco)—high glucose supplemented with 10% fetal bovine serum (FBS; Gibco) in a humidified atmosphere of 5% CO2 at 37°C. Prior to treatment, the cells were grown to 80%‐90% confluence. Then, MHCC97H and HCC‐LM3 cells (2 × 10⁵ cells/mL) were treated with galangin (50 μmol/L, Sigma, Purity ≥ 95%) for 48 hours.
2.2. RNA isolation and RNA‐seq analysis
MHCC97H cells were grown to 80%‐90% confluence; subsequently treated with galangin (50 μmol/L) for 48 hours. Total RNA of MHCC97H cells was extracted with TRIzol Reagent (Invitrogen). rRNA removal and subsequent purification were performed and with RiboZero Magnetic Gold Kit according to the instructions. RNA‐seq was carried out at the Sequencing and Non‐Coding RNA Program at the Sangon Biotech (Shanghai) on the HiSeq2500 (Illumina). Using HISAT2, RSeQC, BEDTools, and Qualimap, the reads were aligned and calculated the RPKM (reads per kilobase per million) values. The data submitted to Gene Expression Omnibus (GEO) dataset (GSE142680).
2.3. Knockdown and overexpression of H19 and miR675
Synthetic RNA oligonucleotides targeting H19 was obtained from RiboBio (Guangzhou). The siRNA target sequence was GCGGGTCTGTTTCTTTACT. pcDNA3.1‐H19 was procured from GenePharma (Shanghai, China). miR675‐3p mimics and inhibitor were obtained from RiboBio (Guangzhou).
The CRISPR/Cas9 plasmids were obtained from Addgene (px458). Protocols for sgRNA design and the procedures required for the in vitro transcription have been described previously. 20 The sgRNA‐oligo sequences are listed in Table S1.
MHCC97H cells were transfected with si‐H19, pcDNA3.1‐H19, miR675‐3p‐mimics, miR675‐3p‐inhibitor, H19‐KO for 48 hours, respectively. Control cells were transfected with nonspecific or scrambled siRNA.
2.4. Gene expression analysis
Total RNA was isolated from MHCC97H, MHCC97L, HCC‐LM3 cells, and tumor samples using the TRNzol reagent (TIANGEN) and cDNA was synthesized using the FastKing RT Kit (TIANGEN) according to the instructions. Quantitative real‐time PCR (qPCR) was performed to measure gene expression with the SuperReal PreMix Plus (TIANGEN) on the BIO‐RAD iQ5 Multicolor Real‐Time PCR Detection System. The qPCR cycle profile was performed at 95°C for 15 minutes, followed by 40 cycles of denaturation at 95°C for 10 seconds, annealing at 60°C for 20 seconds. The GAPDH was used as an internal reference and the relative gene expression as fold change was calculated using the 2−ΔΔCT method. The primer sequences are listed in Table S2.
2.5. Methylation pattern of H19 DMR
The bisulfite sequencing PCR amplification was performed as described previously. 22 Briefly, the genomic DNA of MHCC97H, MHCC97L, and HCC‐LM3 cells was isolated using the TIANamp Genomic DNA Kit (TIANGEN) and subjected to the CpGenome™ Turbo Bisulfite Modification Kit (Millipore) according to the instructions. Nested PCR was performed for the amplification of the H19 differentially methylated regions (DMRs). The primer sequences are listed in Table S3.
2.6. Gene sequence analysis
The sequences of miR675 and H19 exon1 are listed in Table S4 which obtained from http://asia.ensembl.org/index.html. The methylation sequence was analyzed using BiQ Analyzer software (http://biq‐analyzer.bioinf.mpi‐inf.mpg.de/tools/MethylationDiagrams/index.php).
2.7. Cell migration and invasion
The migration of the cells was assessed using a wound‐healing assay. Briefly, at 48‐h post‐transfection, 5 × 10⁵ cells were cultured. A scraped line was established with a 10 μL pipette tip and the remaining cells were cultured in serum‐free medium. After 12, 24, 48, and 72 hours at 37°C, cellular migration toward the scratched area was photographed using an inverted microscope.
Invasion assays were performed with Matrigel (BD Biosciences, USA). Briefly, cell transfectants were serum starved for 24 hours in DMEM containing 0.1% FBS. Subsequently, 3 × 10⁴ cells were added to the upper chamber of each well coated with 20 μL Matrigel, 0.5 mL of 10% FBS‐containing medium was added to the lower chamber. After incubation for 24 hours, cells that invaded to the lower membrane of the chamber were fixed with 4% paraformaldehyde, stained with 0.2% crystal violet dye (Solarbio). Then, the cells counted in five randomly selected fields (at × 200 magnification) under an inverted microscope. The average cell number per view was calculated. All experiments were performed in triplicate.
2.8. Cell counting kit‐8 assay
Cell viability was assessed with Cell Counting Kit‐8 (CCK‐8) assay kit (Dojindo, Kumamoto, Japan) as described previously. 23 Briefly, cells were seeded at a density of 4 × 10³ cells/well. Following different treatments, 10 μL of CCK‐8 solution was added to each well. The cells were incubated for 30 minutes. The cell viability was revealed by the absorbance (OD), which was measured at 450 nm using a microplate reader (Infinite M200, TECAN).
2.9. Cell cycle and apoptosis analysis
To analyze the cell cycle, PI staining was performed. In brief, MHCC97H cells (1 × 10⁶ cells/mL) were treated with galangin, si‐H19, or pcDNA3.1‐H19 for 48 hours. The cells were washed using PBS and then fixed with 70% ethanol for 24 hours. These cells were incubated with PI and RNase A for 30 minutes and the fluorescence of the cells was quantified by flow cytometry (BD Biosciences) using a PI signal detector (BD AccuriTM C6).
The cell apoptosis analysis was performed as previously described. 24 Briefly, MHCC97H cells were treated with galangin, si‐H19, or pcDNA3.1‐H19 for 48 hours and then washing twice using PBS. The harvested cells (1 × 10⁶ cells/mL) were incubated with a mixture of Annexin V‐FITC/PI for 30 minutes following the manufacturer's protocol. A FITC signal detector and a PI signal detector (BD Accuri C6) were used to quantify the fluorescence of the cells by flow cytometry (BD Biosciences).
2.10. Western blot analysis
The proteins were extracted from cell lines (1 × 10⁶ cells) in ice‐cold protein extraction buffer (Novagen, Madison, WI, USA) with 2 × SDS lysis buffer supplemented with protease inhibitors cocktail. BCA protein assay kit (TIANGEN) was used to quantify the concentrations of the protein. For western blot assay, proteins were separated by 10% sodium dodecyl sulfate‐polyacrylamide gel electrophoresis (SDS‐PAGE) followed by transfer onto a polyvinylidene difluoride (PVDF) membrane. Subsequently, membranes were blocked with 5% non‐fat milk in Tris‐buffered saline with Tween‐20 (TBS‐T; 0.1% Tween‐20 in TBS) and probed with primary antibodies against anti‐p53 (Bioworld, BS9809M) and anti‐GAPDH (Affinity, AF7021), respectively, each at a dilution of 1:2000 in 5% blocking buffer overnight at 4°C. Subsequently, the membranes were washed twice using TBS‐T and incubated with horseradish peroxidase (HRP)‐conjugated secondary antibodies (anti‐mouse or anti‐rabbit, Boster) for 1 hour at room temperature. The target bands of proteins were visualized using ECL Super Signal software (Pierce).
2.11. Nude mice xenograft assay
The animals were cared for in accordance with the Guide for the care and use of laboratory animals in China. All experimental procedures were approved by the Animal Care and Use Committee of Jilin University (Grant No. SY201907008). In all, 30 female nude mice (6‐week old) were procured from the Laboratory Animal Center, Jilin University. The mice were randomly divided into six groups (N = 5). Con, pcDNA3.1‐H19, and H19‐KO cells (3 × 10 5 cells) were injected subcutaneously into the left flank areas of mice. The mice tumors were observed after 11 days. The mice were used for experiments when their tumor volumes were approximately 40‐60 mm3. The galangin group was administrated with galangin (Sigma) by daily gavage at 20 mg/kg for 14 days. The Con group was given equal quantities of saline. The length (L) and width (W) were recorded and the tumor volumes were calculated as (L × W 2/2). The mice were housed in laboratory cages under controlled laboratory conditions, at 24°C under a 12‐hour light/dark cycles. Animals were provided ad libitum access to standard rodent food and tap water. All the mice were healthy and had no infection during the experimental period. All surgical procedures were carried out under aseptic conditions.
2.12. Statistical analysis
All data are presented as mean ± SD using GraphPad Prism 5.0 (GraphPad Software, Inc). The Student t tests (Unpaired t test) were used to analyze the data. A P‐value of < .05 was considered statistically significant.
3. RESULTS
3.1. Analysis of lncRNAs expression profiles by high‐throughput RNA‐seq
To analyze the lncRNA expression pattern after treatment with galangin in MHCC97H cells, RNA‐Seq was performed with Illumina Hiseq. A total of 800 lncRNAs were identified using the software programs CPC2, CNCI, PFAM, and PLEK (Figure 1A). Compared to the Control group, 50 lncRNAs were differentially expressed in galangin‐treated group (Figure 1B). The heatmap and Kyoto Encyclopedia of Genes and Genomes (KEGG) pathways revealed that the differentially expressed lncRNAs have role in cell growth and death (Figure 1C,D). Furthermore, we focused on the seven lncRNAs (PFKL, TPD52, ERGIC3, CFL1, CARS, IARS, and H19), which were related to cancer development (Figure 1E). To further detect the expression of these genes, qPCR was used in MHCC97H and HCC‐LM3 cells. The result showed only the expression of H19 was reduced after galangin treatment in both MHCC97H and HCC‐LM3 cells (Figure 1F).
FIGURE 1.
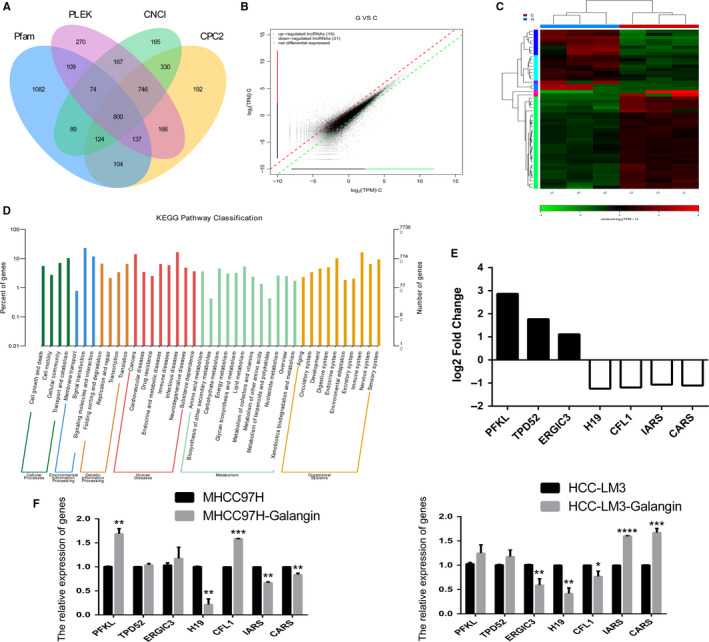
LncRNAs expression profile by RNA‐seq. Screen lncRNAs using the software of CPC2, CNCI, Pfam, and PLEK (A). Identification of different expressed lncRNAs (B). The heatmap was drawn to show the differentially expressed lncRNAs (C). KEGG pathway of the differentially expressed lncRNAs (D). The expression of log2 fold change in lncRNAs (E). Relative expression of PFKL, TPD52, ERGIC3, CFL1, CARS, IARS, and H19 was analyzed by qPCR after galangin treatment in MHCC97H and HCC‐LM3 cells (F). C, indicated Control group. G, indicated galangin treatment group. The data are represented as the mean ± SD (n = 3). *(P < .05), **(P < .01), ***(P < .005), and ****(P < .001) indicate statistically significant differences
3.2. Galangin induces cell apoptosis and suppresses cell migration and invasion
qPCR results suggested that H19 was significantly overexpressed in MHCC97H as compared to L02 cells (Figure 2A). L02 cells derived from normal human liver tissue. To further confirm the expression pattern of H19, MHCC97L and HCC‐LM3 cells were also analyzed. qRT‐PCR and BSP results identified the aberrant expression of H19 and hypo‐methylation pattern of H19 DMR in MHCC97H, MHCC97L, and HCC‐LM3 cells (Figure S1). To determine if treatment with galangin affected the MHCC97H cell growth, CCK8 assay was carried out. As illustrated in Figure 2B, treatment with 100 and 150 μmol/L of galangin exhibited toxic effects on MHCC97H cells. Thus, 50 μmol/L of galangin was selected for qPCR analysis. The qPCR findings revealed reduced expression of H19 after treatment with galangin (Figure 2C). Moreover, galangin could induce significant cell apoptosis in MHCC97H cells compared with the control cells (Figure 2D,E). Flow cytometry analysis showed reduced S phase cells in galangin‐treated cells (Figure S2). Furthermore, treatment with galangin inhibited the cell migration (Figure 3A,B) and invasion (Figure 3C,D) of MHCC97H cells, indicating that galangin can serve as a potential antitumor agent.
FIGURE 2.
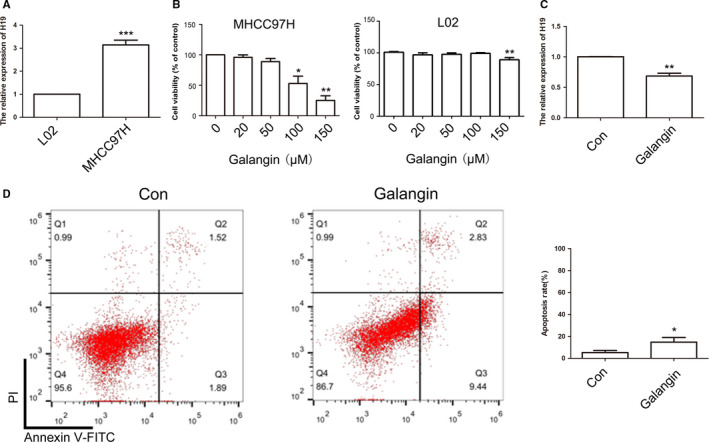
Analysis of H19 expression and cell apoptosis after galangin treatment. Relative expression of H19 between L02 and MHCC97H cells (A). The cell growth was analyzed by CCK8 assay (B). Relative expression of H19 was analyzed by qPCR after galangin treatment in MHCC97H cells (C). The cell apoptosis was analyzed between Con and galangin group (D). Statistical analysis of the percentage of cell apoptosis (E). The data are represented as the mean ± SD (n = 3). *(P < .05), **(P < .01), and ***(P < .005) indicate statistically significant differences
FIGURE 3.
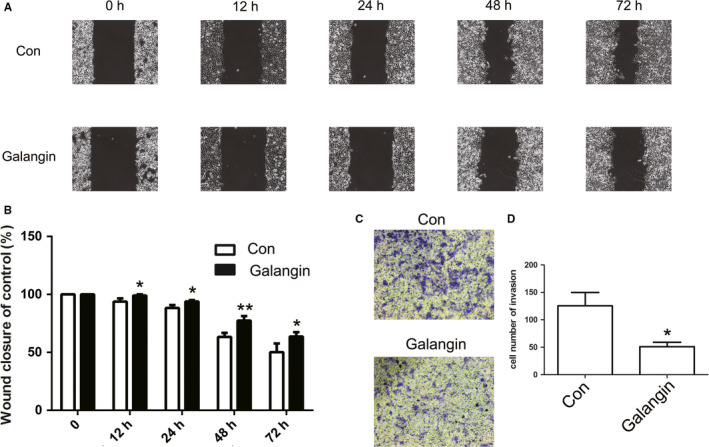
Analysis of cell migration and invasion after galangin treatment. The cell migration was analyzed between Con and galangin group (A). Statistical analysis of the percentage of cell migration (B). The cell invasion was analyzed (C). Statistical analysis of the percentage of cell invasion (D). The data are represented as the mean ± SD (n = 3). *(P < .05) and **(P < .01) indicate statistically significant differences
3.3. Effects of knockdown and overexpression of H19 on cell apoptosis
To further analyze the effect of the expression pattern of H19 on cell apoptosis, HCC cells were transfected with si‐H19 or pcDNA3.1‐H19 expression vector. The qPCR results revealed reduced expression of H19 in the siRNA‐treated group, while overexpression was observed in the pcDNA3.1‐H19 expression group (Figure 4A). CCK8 assay indicated that H19 expression could not alter the cell growth (Figure 4B). However, cell apoptosis results indicated that reduced expression of H19 induced marked cell death in MHCC97H cells (Figure 4C,D). Besides, H19 expression did not alter the cell cycle (Figure S3). These data suggested that H19 expression exhibits crucial roles in cell apoptosis. To further investigate the effect of H19 expression pattern in MHCC97H cells, cell migration and invasion were analyzed. Cell migration result indicated that compared to the control group, knockdown or overexpression of H19 did not show any alteration (Figure 5A‐C). However, the cell invasion result showed that reduced expression of H19 could suppress the invasive potential of MHCC97H cells (Figure 6A‐D).
FIGURE 4.
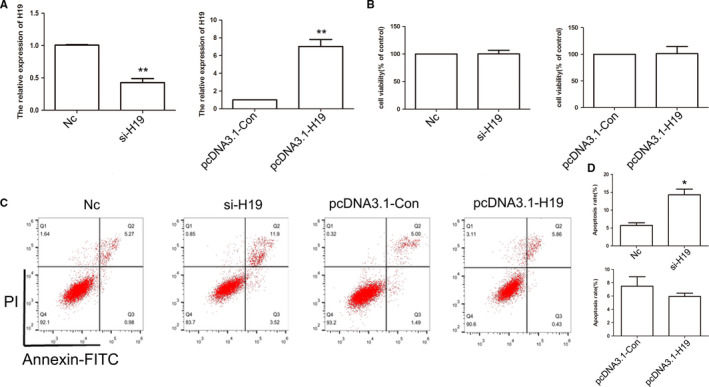
Analysis of H19 expression pattern in MHCC97H cells. Relative expression of H19 in Nc, si‐H19, pcDNA3.1‐Con, and pcDNA3.1‐H19 group using qPCR (A). The cell growth was analyzed by CCK8 assay (B). The cell apoptosis was analyzed after si‐H19 and pcDNA3.1‐H19 transfected (C). Statistical analysis of percentage of cell apoptosis (D). The data are represented as the mean ± SD (n = 3). *(P < .05) and **(P < .01) indicate statistically significant differences
FIGURE 5.
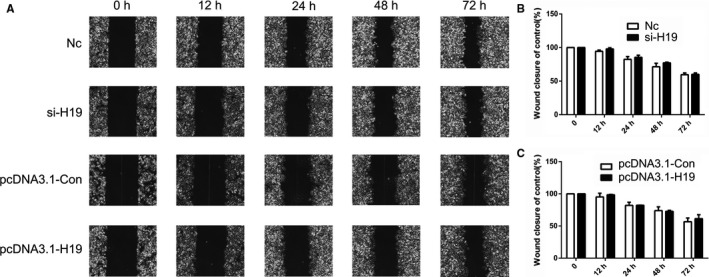
Analysis of cell migration after knockdown and overexpression of H19. The cell migration was analyzed in Nc, si‐H19, pcDNA3.1‐Con, and pcDNA3.1‐H19 group (A). Statistical analysis of the percentage of cell migration (B and C). The data are represented as the mean ± SD (n = 3)
FIGURE 6.
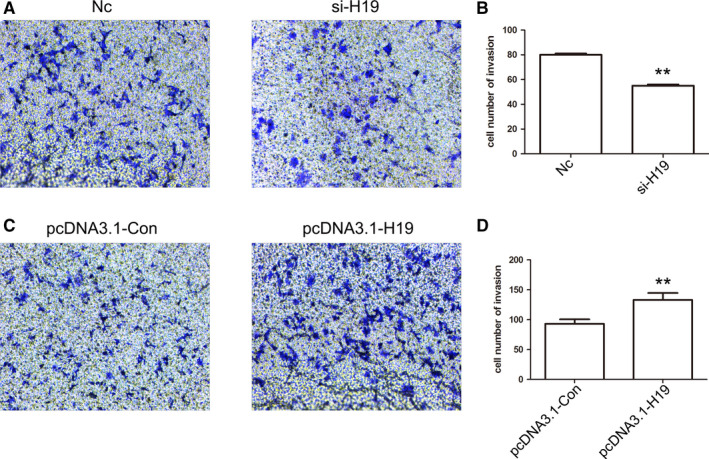
Analysis of cell invasion after knockdown and overexpression of H19. The cell invasion was analyzed in Nc, si‐H19, pcDNA3.1‐Con, and pcDNA3.1‐H19 group (A and C). Statistical analysis of the percentage of cell migration (B and D). The data are represented as the mean ± SD (n = 3). **(P < .01) indicate statistically significant differences
3.4. H19/miR675‐mediated cell apoptosis through p53 protein
RNA‐Seq data showed that compared to the control group, 161 mRNA were differentially expressed in galangin‐treated group (Figure 7A). Analysis of cell apoptosis signaling pathway revealed that mRNA of TP53‐ and p53‐related genes (CDIP1, FOS, and CREB3L3) were significantly differentially expressed following treatment with galangin (Figure 7B). Moreover, miR675‐3p, which locus in H19 exon 1 as potential targeting of p53, was investigated (Figure 7C). qPCR result suggested that reduced expression of H19 increased TP53 expression (Figure 7D). Furthermore, increased expression of TP53 was observed after transfection with miR675 inhibitor (Figure 7E,F). Moreover, the expression of TP53 was increased by treatment with galangin after transfection with pcDNA3.1‐H19 or miR675 mimics (Figure 7G). Western blot analysis further confirmed our qPCR data (Figure 7H). Taken together, these results indicated that p53 protein was regulated by the H19/miR675 axis.
FIGURE 7.
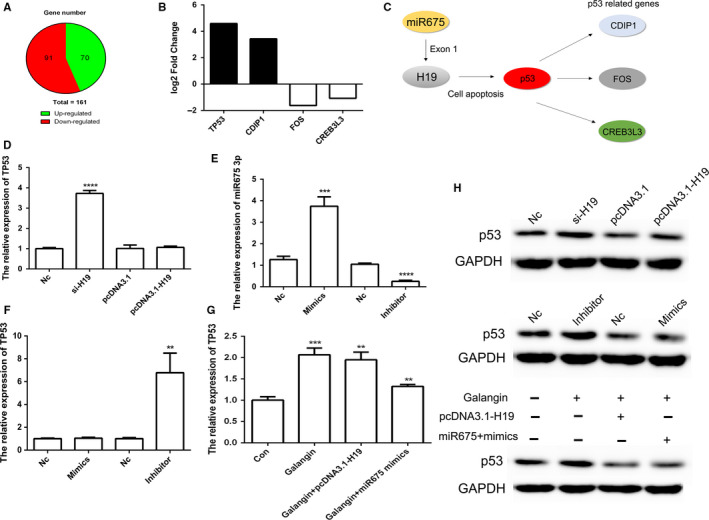
The expression pattern of H19 and miR675‐3p in cell apoptosis. Screen of different expressed mRNA (A). The expression of log2 fold change in p53 and p53‐related genes (B). Schematic representations of H19 and miR675 in p53 signaling pathway (C). The relative expression of TP53 in Nc, si‐H19, pcDNA3.1‐Con, and pcDNA3.1‐H19 group (D). The relative expression of miR675‐3p (E). The relative expression of TP53 in Nc, miR675‐3p mimics and inhibitor group (F). The relative expression of TP53 after galangin treatment (G). Analysis of the expression of p53 protein using Western blot (H). The data are represented as the mean ± SD (n = 3). **(P < .01), ***(P < .005), and ****(P < .001) indicate statistically significant differences
3.5. Galangin inhibited tumor growth in vivo
To confirm the galangin‐meditated H19 expression in vivo, nude mice xenograft was used. After 11 days, the mice were treated with galangin (20 mg/kg) or an equal volume of saline for 14 days. The results indicated that galangin had a significant inhibitory effect on tumor growth (Figure 8A,B). qPCR results revealed that treatment with galangin could significantly inhibit the expression of H19 in vivo (Figure 8C). In order to analyze loss expression of H19 in MHCC97H cells, two sgRNAs targeting the exon1 of H19 were designed (Figure 8D). qPCR result suggested that H19 expression was reduced in H19 KO cells (Figure 8E). To analyze the effect of the expression pattern of H19 in vivo, the H19 KO cells were injected into nude mice. The results demonstrated that inhibited tumor growth was observed after injected H19 KO cells compared with control group. Moreover, galangin treatment could inhibit tumor growth in H19 overexpression group (Figure 8F‐G). These findings indicated that H19 which can be regulated by galangin might have an important role in the development of cancer.
FIGURE 8.
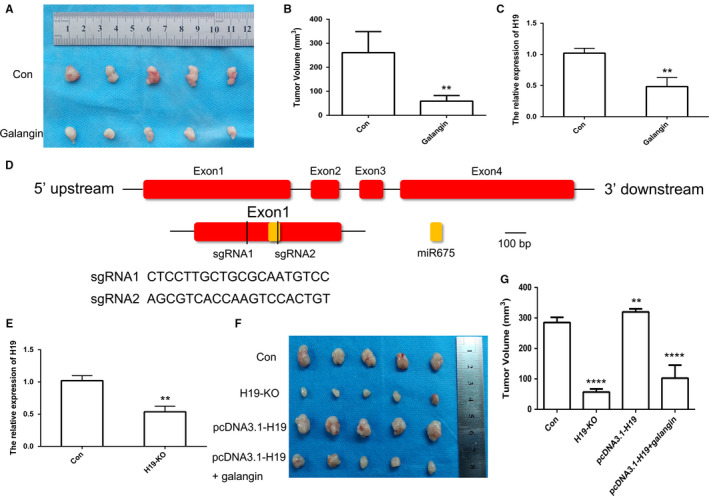
CRISPR/Cas9‐mediated gene targeting of H19. Morphological observation of mouse HCC tumor tissue (A). Analysis of tumor volume (B). The expression pattern of H19 in tumor of mice after galangin treatment (C). Schematic diagram of sgRNA targeting the H19 gene loci (D). The expression of H19 using qPCR (E). The tumor morphology (F) and volume (G). Red indicated exon of H19. Yellow indicated miR675. **(P < .01) and ****(P < .001) indicate statistically significant differences
4. DISCUSSION
In recent years, lncRNAs have received increased attention as a novel and crucial player in various cellular processes. Aberrant expression of lncRNAs was associated with cancer development. As potential biomarkers of cancer, lncRNA regulated tumor suppressors or oncogenes through binding to DNA, RNA, or proteins. 25 Moreover, RNA‐Seq data have revealed subsets of lncRNA whose expression patterns were found to be substantially associated with malignancy in several types of cancer including HCC. In this context, previous studies have revealed that TPTEP1, a lncRNA, exhibits a crucial role in HCC by RNA‐seq analysis. 26 Indeed, many lncRNAs, such as LINCO1138 and lncAKHE, have been found to participate in the development of HCC. 27 , 28 In this study, using RNA‐seq analysis, we investigated the differential expression of lncRNAs following treatment with galangin in MHCC97H cells. The total of 50 lncRNAs were identified which were differentially significant expressed. Furthermore, we analyzed cancer‐related lncRNAs in the data and our analysis revealed that compared to L02 cells, H19 expression was dramatically increased in MHCC97H and HCC‐LM3 cells. The H19 expression was mediated by DNA methylation. 29 Consistently, our data further indicated the aberrant methylation status of H19 DMR in HCC cells.
Considering of HCC is a multistage process which involved with epigenetic modification and the expression of lncRNAs, novel therapeutic drug and biomarkers are still urgently needed. Numerous genes and proteins which control cell proliferation, invasion, and metastatic formation have role in HCC pathogenesis. Chemoprevention is to treat cancer with nontoxic natural or synthetic chemicals, such as galangin. 30 Chemoprevention has ability to regulate numerous gene and protein expressions with molecular targets and antitumor effects. Galangin as natural bioflavonoid primarily extracted from Chinese medicinal herb has been reported to have a role in oxidative stress and inflammation through regulating the gene expression of cellular signaling pathways. 31 Moreover, galangin has been recently proven to be an effective drug for the treatment of HCC which induced cell apoptosis. 11 However, there is little evidence on galangin regulating the expression of H19. Our data indicated that the expression of H19 was regulated by galangin indicating that galangin might be involved in cell apoptosis through regulating the expression of H19 in MHCC97H cells. Previous reports also suggested that galangin could induce apoptosis via endoplasmic reticulum stress in PLC/PRF/5 cells. 32 Our results confirmed that galangin significantly induced cell apoptosis in MHCC97H cells. Furthermore, the effect of treatment with galangin was analyzed in vivo and results indicated that tumor growth was markedly inhibited upon treatment with galangin. Previous reports also suggested that reduced H19 expression was associated with tumor development. 33 Our in vivo result confirmed that H19 expression was noticeably suppressed after treatment with galangin. There is evidence that galangin could induce cell apoptosis through regulating the expression of p53 protein which is in accordance with our data in HCC cells. 14 These results indicated that galangin has the ability to regulate H19 expression which might induce cell apoptosis through p53 protein.
Furthermore, previous studies have also shown that H19 expression has role in cell growth and invasion. 34 Recent study suggested that knockdown of H19 expression which regulated the CDC42/PAK1 pathway could inhibit cell growth, migration, invasion, and promote apoptosis through miR‐15b in HCC cells and tissues. 2 Moreover, reduced expression of H19 could induce cell apoptosis in HCC cells and other cancer cells. 1 , 35 Apparently, our result also suggested knockdown of H19 expression induced apoptosis which further confirmed the previous findings. These results indicated that reduced expression of H19 significantly promoted apoptosis in MHCC97H cells. Accumulating studies have also confirmed that migration and invasion of HCC were crucial in the prognosis of patients with HCC. 36 , 37 The previous report also revealed that lncRNAs, such as HOXD‐AS1 and EIF3J‐AS1, play a role in migration and invasion of HCC. 38 , 39 Consistently, our result also revealed that H19 expression was associated with invasion in MHCC97H cells.
RNA‐seq data revealed a total of 161 mRNA were differentially expressed after treatment with galangin. Of these, only TP53‐ and p53‐related genes (CDIP1, FOS, and CREB3L3) were associated with cell apoptosis. 40 Increasing reports also suggested the expression of miR675 and H19 had role in cell apoptosis through p53 protein in cancer cells. 41 , 42 , 43 To confirm the putative function of H19 and miR675 in cell apoptosis, overexpression and knockout of H19 and miR675 were performed. Previous report suggested that CRISPR/Cas9 system was useful for gene editing in gastric cancer cells. 44 Results of our study revealed that H19 KO via CRISPR/Cas9 system could inhibit tumor growth. The result indicated that reduced expression of miR675 and H19 promoted apoptosis through up‐regulating the protein expression of p53.
5. CONCLUSION
In this study, a total of 50 lncRNAs and 161 mRNA were identified to be differentially expressed in MHCC97H cells following treatment with galangin. The findings also demonstrated that H19 expression is reduced by galangin in MHCC97H cells. Furthermore, knockdown of H19 and miR675 induced the protein expression of p53, eventually promoting cell apoptosis. Collectively, our data suggested that galangin has role in hepatocarcinogenesis through regulating expression pattern of H19.
CONFLICTS OF INTEREST
No potential conflict of interest was reported by the authors.
AUTHORS’ CONTRIBUTION
Dongxu Wang designed the experiments and wrote the manuscript. Xiaowei Zhong, Siyi Huang, and Chengshun Li performed cell experiment and gene expression analysis. Qunyan Yao, Da Liu, and Dianfeng Liu contributed reagents and materials. Ziping Jiang carried out animal experiment. Qinglong Jin analyzed the data and prepared figures. All authors reviewed the manuscript.
Supporting information
Fig S1
Fig S2
Fig S3
Table S1‐S4
ACKNOWLEDGMENTS
This work was supported by the National Natural Science Foundation of China under Grant 81803680, the China Postdoctoral Science Foundation under Grant 2018T110250 and 2016M601384, the Fundamental Research Funds for the Central Universities under Grant 2019JCKT‐70, the Natural Science Foundation under Grant 2018SCZWSZX‐045, the Jilin Education Department Program under Grant JJKH20200950KJ, and the Jilin Scientific and Technological Development Program under Grant 20190103071JH, 20180101254JC and 20170623093‐TC.
Zhong X, Huang S, Liu D, et al. Galangin promotes cell apoptosis through suppression of H19 expression in hepatocellular carcinoma cells. Cancer Med. 2020;9:5546–5557. 10.1002/cam4.3195
Xiaowei Zhong, Siyi Huang, and Dianfeng Liu contributed equally to this work.
Contributor Information
Qunyan Yao, Email: yao.qunyan@zs-hospital.sh.cn.
Dongxu Wang, Email: wang_dong_xu@jlu.edu.cn.
DATA AVAILABILITY STATEMENT
The data that support the findings of this study are available from the corresponding author upon reasonable request.
REFERENCES
- 1. Ge L, Wang Q, Hu S, Yang X. Rs217727 polymorphism in H19 promotes cell apoptosis by regulating the expressions of H19 and the activation of its downstream signaling pathway. J Cell Physiol. 2019;234(5):7279‐7291. [DOI] [PubMed] [Google Scholar]
- 2. Zhou Y, Fan RG, Qin CL, Jia J, Wu XD, Zha WZ. LncRNA‐H19 activates CDC42/PAK1 pathway to promote cell proliferation, migration and invasion by targeting miR‐15b in hepatocellular carcinoma. Genomics. 2019;111(6):1862‐1872. [DOI] [PubMed] [Google Scholar]
- 3. Schwarzenbach H. Biological and clinical relevance of H19 in colorectal cancer patients. EBioMedicine. 2016;13:9‐10. [DOI] [PMC free article] [PubMed] [Google Scholar]
- 4. Hua Q, Lv X, Gu X, et al. Genetic variants in lncRNA H19 are associated with the risk of bladder cancer in a Chinese population. Mutagenesis. 2016;31(5):531‐538. [DOI] [PubMed] [Google Scholar]
- 5. Zhang K, Luo Z, Zhang YI, et al. Circulating lncRNA H19 in plasma as a novel biomarker for breast cancer. Cancer Biomark. 2016;17(2):187‐194. [DOI] [PubMed] [Google Scholar]
- 6. Hao Y, Crenshaw T, Moulton T, Newcomb E, Tycko B. Tumour‐suppressor activity of H19 RNA. Nature. 1993;365(6448):764‐767. [DOI] [PubMed] [Google Scholar]
- 7. Li H, Li J, Jia S, et al. miR675 upregulates long noncoding RNA H19 through activating EGR1 in human liver cancer. Oncotarget. 2015;6(31):31958‐31984. [DOI] [PMC free article] [PubMed] [Google Scholar]
- 8. Ding K, Liao Y, Gong D, Zhao X, Ji W. Effect of long non‐coding RNA H19 on oxidative stress and chemotherapy resistance of CD133+ cancer stem cells via the MAPK/ERK signaling pathway in hepatocellular carcinoma. Biochem Biophys Res Commun. 2018;502(2):194‐201. [DOI] [PubMed] [Google Scholar]
- 9. Li X, Wang H, Yao B, Xu W, Chen J, Zhou X. lncRNA H19/miR‐675 axis regulates cardiomyocyte apoptosis by targeting VDAC1 in diabetic cardiomyopathy. Sci Rep. 2016;6:36340. [DOI] [PMC free article] [PubMed] [Google Scholar]
- 10. Heo MY, Sohn SJ, Au WW. Anti‐genotoxicity of galangin as a cancer chemopreventive agent candidate. Mutat Res‐Rev Mutat. 2001;488(2):135‐150. [DOI] [PubMed] [Google Scholar]
- 11. Fang D, Xiong Z, Xu J, Yin J, Luo R. Chemopreventive mechanisms of galangin against hepatocellular carcinoma: a review. Biomed Pharmacother. 2019;109:2054‐2061. [DOI] [PubMed] [Google Scholar]
- 12. Zhu Y, Rao Q, Zhang XH, Zhou XJ. Galangin induced antitumor effects in human kidney tumor cells mediated via mitochondrial mediated apoptosis, inhibition of cell migration and invasion and targeting PI3K/AKT/mTOR signalling pathway. J Buon. 2018;23(3):795‐799. [PubMed] [Google Scholar]
- 13. Liu D, You PT, Luo Y, Yang M, Liu YW. Galangin induces apoptosis in MCF‐7 human breast cancer cells through mitochondrial pathway and phosphatidylinositol 3‐kinase/Akt inhibition. Pharmacology. 2018;102(1–2):58‐66. [DOI] [PubMed] [Google Scholar]
- 14. Lee CC, Lin ML, Meng MH, Chen SS. Galangin induces p53‐independent S‐phase arrest and apoptosis in human nasopharyngeal carcinoma cells through inhibiting PI3K‐AKT signaling pathway. Anticancer Res. 2018;38(3):1377‐1389. [DOI] [PubMed] [Google Scholar]
- 15. Zou WW, Xu SP. Galangin inhibits the cell progression and induces cell apoptosis through activating PTEN and Caspase‐3 pathways in retinoblastoma. Biomed Pharmacother. 2018;97:851‐863. [DOI] [PubMed] [Google Scholar]
- 16. Tang Z‐Y, Ye S‐L, Liu Y‐K, et al. A decade's studies on metastasis of hepatocellular carcinoma. J Cancer Res Clin Oncol. 2004;130(4):187‐196. [DOI] [PubMed] [Google Scholar]
- 17. Zhang HT, Luo H, Wu J, et al. Galangin induces apoptosis of hepatocellular carcinoma cells via the mitochondrial pathway. World J Gastroenterol. 2010;16(27):3377‐3384. [DOI] [PMC free article] [PubMed] [Google Scholar]
- 18. Chen D, Li D, Xu X‐B, et al. Galangin inhibits epithelial‐mesenchymal transition and angiogenesis by downregulating CD44 in glioma. Journal of Cancer. 2019;10(19):4499‐4508. [DOI] [PMC free article] [PubMed] [Google Scholar]
- 19. Wei L, Wang X, Lv L, et al. The emerging role of microRNAs and long noncoding RNAs in drug resistance of hepatocellular carcinoma. Mol Cancer. 2019;18(1):147. [DOI] [PMC free article] [PubMed] [Google Scholar]
- 20. Cong L, Ran FA, Cox D, et al. Multiplex genome engineering using CRISPR/Cas systems. Science. 2013;339(6121):819‐823. [DOI] [PMC free article] [PubMed] [Google Scholar]
- 21. Li Y, Tang Z, Ye S, et al. Establishment of a hepatocellular carcinoma cell line with unique metastatic characteristics through in vivo selection and screening for metastasis‐related genes through cDNA microarray. J Cancer Res Clin Oncol. 2003;129(1):43‐51. [DOI] [PubMed] [Google Scholar]
- 22. Clark SJ, Harrison J, Paul CL, Frommer M. High sensitivity mapping of methylated cytosines. Nucleic Acids Res. 1994;22(15):2990‐2997. [DOI] [PMC free article] [PubMed] [Google Scholar]
- 23. Ding C, Li L, Yang T, Fan X, Wu G. Combined application of anti‐VEGF and anti‐EGFR attenuates the growth and angiogenesis of colorectal cancer mainly through suppressing AKT and ERK signaling in mice model. BMC Cancer. 2016;16(1):791. [DOI] [PMC free article] [PubMed] [Google Scholar]
- 24. William‐Faltaos S, Rouillard D, Lechat P, Bastian G. Cell cycle arrest and apoptosis induced by oxaliplatin (L‐OHP) on four human cancer cell lines. Anticancer Res. 2006;26(3A):2093‐2099. [PubMed] [Google Scholar]
- 25. Iyer MK, Niknafs YS, Malik R, et al. The landscape of long noncoding RNAs in the human transcriptome. Nat Genet. 2015;47(3):199‐208. [DOI] [PMC free article] [PubMed] [Google Scholar]
- 26. Ding H, Liu J, Zou R, Cheng P, Su Y. Long non‐coding RNA TPTEP1 inhibits hepatocellular carcinoma progression by suppressing STAT3 phosphorylation. J Exp Clin Cancer Res. 2019;38(1):189. [DOI] [PMC free article] [PubMed] [Google Scholar] [Retracted]
- 27. Li Z, Zhang JW, Liu XY, et al. The LINCO1138 drives malignancies via activating arginine methyltransferase 5 in hepatocellular carcinoma. Nature Commun. 2018;9:1572. [DOI] [PMC free article] [PubMed] [Google Scholar]
- 28. Huang G, Jiang H, Lin YE, et al. lncAKHE enhances cell growth and migration in hepatocellular carcinoma via activation of NOTCH2 signaling. Cell Death Dis. 2018;9(5):487. [DOI] [PMC free article] [PubMed] [Google Scholar]
- 29. Wang D, Yuan L, Sui T, et al. Faithful expression of imprinted genes in donor cells of SCNT cloned pigs. FEBS Lett. 2015;589(16):2066‐2072. [DOI] [PubMed] [Google Scholar]
- 30. Kasala ER, Bodduluru LN, Madana RM, V AK, Gogoi R, Barua CC. Chemopreventive and therapeutic potential of chrysin in cancer: mechanistic perspectives. Toxicol Lett. 2015;233(2):214‐225. [DOI] [PubMed] [Google Scholar]
- 31. Huang Y‐C, Tsai M‐S, Hsieh P‐C, et al. Galangin ameliorates cisplatin‐induced nephrotoxicity by attenuating oxidative stress, inflammation and cell death in mice through inhibition of ERK and NF‐kappaB signaling. Toxicol Appl Pharm. 2017;329:128‐139. [DOI] [PubMed] [Google Scholar]
- 32. Su L, Chen X, Wu J, et al. Galangin inhibits proliferation of hepatocellular carcinoma cells by inducing endoplasmic reticulum stress. Food Chem Toxicol. 2013;62:810‐816. [DOI] [PubMed] [Google Scholar]
- 33. Zhang JQ, Han C, Ungerleider N, et al. A transforming growth factor‐beta and H19 signaling axis in tumor‐initiating hepatocytes that regulates hepatic carcinogenesis. Hepatology. 2019;69(4):1549‐1563. [DOI] [PMC free article] [PubMed] [Google Scholar]
- 34. Wei LQ, Li L, Lu C, Liu J, Chen YH, Wu HB. Involvement of H19/miR‐326 axis in hepatocellular carcinoma development through modulating TWIST1. J Cell Physiol. 2019;234(4):5153‐5162. [DOI] [PubMed] [Google Scholar]
- 35. Pan YF, Zhang Y, Liu WW, et al. LncRNA H19 overexpression induces bortezomib resistance in multiple myeloma by targeting MCL‐1 via miR‐29b‐3p. Cell Death Dis. 2019;10(2):106. [DOI] [PMC free article] [PubMed] [Google Scholar]
- 36. Xu Z, Meng SH, Bai JG, et al. C/EBPalpha regulates FOXC1 to modulate tumor growth by interacting with PPARgamma in Hepatocellular carcinoma. Curr Cancer Drug Targets. 2020;20(1):59‐66. [DOI] [PubMed] [Google Scholar]
- 37. Zhang W‐L, Zhao Y‐N, Shi Z‐Z, et al. HOXA11‐AS promotes the migration and invasion of hepatocellular carcinoma cells by inhibiting miR‐124 expression by binding to EZH2. Hum Cell. 2019;32(4):504‐514. [DOI] [PubMed] [Google Scholar]
- 38. Sun J, Guo Y, Bie B, et al. Silencing of long noncoding RNA HOXD‐AS1 inhibits proliferation, cell cycle progression, migration and invasion of hepatocellular carcinoma cells through MEK/ERK pathway. J Cell Biochem. 2019;121(1):443‐457. [DOI] [PubMed] [Google Scholar]
- 39. Yang X, Yao B, Niu Y, et al. Hypoxia‐induced lncRNA EIF3J‐AS1 accelerates hepatocellular carcinoma progression via targeting miR‐122‐5p/CTNND2 axis. Biochem Biophys Res Commun. 2019;518(2):239‐245. [DOI] [PubMed] [Google Scholar]
- 40. Brown L, Ongusaha PP, Kim HG, et al. CDIP, a novel pro‐apoptotic gene, regulates TNFalpha‐mediated apoptosis in a p53‐dependent manner. EMBO J. 2007;26(14):3410‐3422. [DOI] [PMC free article] [PubMed] [Google Scholar]
- 41. Zhu M, Chen Q, Liu X, et al. lncRNA H19/miR‐675 axis represses prostate cancer metastasis by targeting TGFBI. FEBS J. 2014;281(16):3766‐3775. [DOI] [PubMed] [Google Scholar]
- 42. Zhuang M, Gao W, Xu J, Wang P, Shu Y. The long non‐coding RNA H19‐derived miR‐675 modulates human gastric cancer cell proliferation by targeting tumor suppressor RUNX1. Biochem Biophys Res Commun. 2014;448(3):315‐322. [DOI] [PubMed] [Google Scholar]
- 43. Zheng ZH, Wu DM, Fan SH, Zhang ZF, Chen GQ, Lu J. Upregulation of miR‐675‐5p induced by lncRNA H19 was associated with tumor progression and development by targeting tumor suppressor p53 in non‐small cell lung cancer. J Cell Biochem. 2019;120(11):18724‐18735. [DOI] [PubMed] [Google Scholar]
- 44. Wang Q, Chen C, Ding Q, et al. METTL3‐mediated m(6)A modification of HDGF mRNA promotes gastric cancer progression and has prognostic significance. Gut. 2019. [DOI] [PubMed] [Google Scholar]
Associated Data
This section collects any data citations, data availability statements, or supplementary materials included in this article.
Supplementary Materials
Fig S1
Fig S2
Fig S3
Table S1‐S4
Data Availability Statement
The data that support the findings of this study are available from the corresponding author upon reasonable request.


