Dear Editor
Up to now, the mechanism of gallbladder cancer (GBC) is unclear. In this study, the prognostic and functional role of lnc‐CITED2‐2:1 in GBC has been investigated, which suggested that lnc‐CITED2‐2:1 might regulate GBC cell invasion via suppressing the expression of CITED2 and the EMT process.
GBC, the most common malignancy of the biliary tract, is an uncommon but highly lethal malignant tumor. 1 Despite the surgery, effective treatment for the advanced GBC patients is still lacking, 2 , 3 which results in a dismal prognosis. Besides, the underlying mechanism of the initiation of GBC remains unknown. Herein, figuring out the mechanism of disease progression of GBC to develop a potential therapy target is essential to improve the treatment for GBC patients.
Currently, accumulating evidence supported that long non‐coding RNAs (lncRNAs) were essential for the development and progression of GBC. 4 , 5 , 6 For instance, it has been reported that lncRNA‐CCAT1 could competitively inhibit miRNA‐218‐5p, and promote the expression of Bmi1 to promote the progression of GBC. 6 In this study, the function and the underlying mechanism of lnc‐CITED2‐2:1 in GBC were investigated. Details of the method are listed in the Supporting Information Materials and Methods.
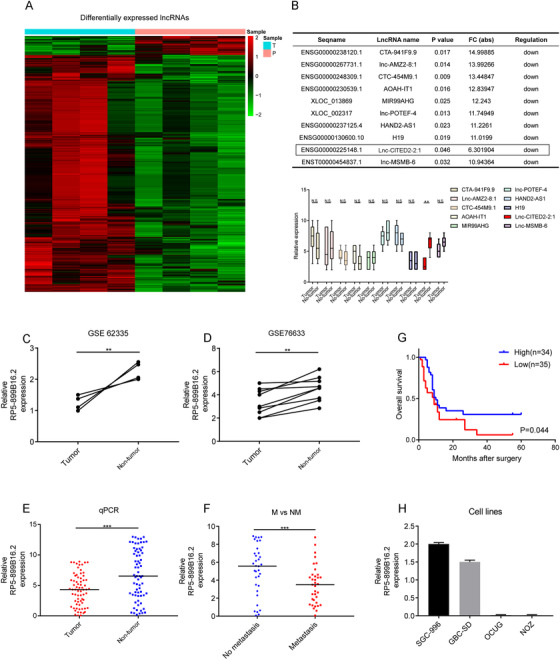
Microarray analysis was initially conducted to identify the differently expressed lncRNAs in GBC (Figure 1A). Then, the top 10 downregulated lncRNAs with a fold change of >2.0 in descending order were selected out and validated by using quantitative PCR, which suggested that lnc‐CITED2‐2:1 was the only significantly downregulated lncRNA in the GBC tissues (P < .01, Figure 1B). Besides, this lncRNA was found to be downregulated in another two lncRNA microarray datasets of GBC (GSE62335, P < .01; GSE76633, P < .01; Figure 1C,D). Therefore, lnc‐CITED2‐2:1 was chosen for further investigation. Details of this lncRNA are presented in Figure S1.
FIGURE 1.

The identification and the expression of the lnc‐CITED2‐2:1 in gallbladder cancer (GBC). A, Heatmap representing the expression level of the expression profiles of lncRNAs specific to GBC in GBC tissue and normal tissue. B, The top 10 downregulated and upregulated lncRNAs in gallbladder cancer, sorting by P‐value and fold change (FC) and the qPCR results of the top 10 downregulated long non‐coding RNA in GBC tissues and matched adjacent normal tissues. * P < .05; ** P < .01; *** P < .001. C and D, Lnc‐CITED2‐2:1 transcript in GBC and corresponding non‐tumor tissues were analyzed in two GEO datasets (GSE62335 and GSE76633), which indicated that this long non‐coding RNA was downregulated in tumor tissues. β‐Actin was used as an internal control. * P < .05; ** P < .01; *** P < .001. E, qPCR result for lnc‐CITED2‐2:1 in GBC and corresponding non‐tumor tissues, which indicated that this lncRNA was downregulated in GBC tissues. 18s was used as an internal control. * P < .05; ** P < .01; *** P < .001. F, qPCR result suggested that lnc‐CITED2‐2:1 was downregulated in GBC patients with lymph node metastasis. 18s was used as an internal control. * P < .05; ** P < .01; *** P < .001. G, The median of the lncRNA expression value was identified as the cut‐off value. Accordingly, patients were stratified into high and low groups. Patients with low expression of lnc‐CITED2‐2:1 were associated with poor prognosis (P = .044). H, The relative expression level of lnc‐CITED2‐2:1 in four GBC cell lines, including SGC‐996, GBC‐SD, OCUG, and NOZ
Then, the mRNA expression level of lnc‐CITED2‐2:1 was examined in 69‐paired GBC tissues and non‐tumor tissues from different patients, and the clinical significance of this lncRNA was investigated. Decreasing expression level of lnc‐CITED2‐2:1 was observed in tumor tissue (P < .001, Figure 1E) and patients without lymph node metastasis (P < .001, Figure 1F). Besides, a low expression level of lnc‐CITED2‐2:1 indicated shorter overall survival (P = .044, Figure 1G). Furthermore, it was found that a high expression level of lnc‐CITED2‐2:1 positively correlated with a lower incidence of lymph node metastases (P < .001), smaller tumor size (P < .001), and early TNM stage (P = .020; Table 1).
TABLE 1.
Correlations between tumor lnc‐CITED2‐2:1 expression and clinicopathological characteristics in GBC
| Characteristics | Lnc‐CITED2‐2:1 | ||
|---|---|---|---|
| Low (n = 35) | High (n = 34) | P‐value | |
| Age, years | |||
| <60 | 20 | 16 | .402 |
| >60 | 15 | 18 | |
| Gender | |||
| Female | 21 | 19 | .729 |
| Male | 14 | 15 | |
| Diabetes mellitus | |||
| No | 18 | 20 | .537 |
| Yes | 17 | 14 | |
| CA 19‐9 (U/mL) | |||
| ≤37 | 19 | 15 | .398 |
| >37 | 16 | 19 | |
| Tumor size (cm) | |||
| ≤2.5 | 15 | 25 | <.001 |
| >2.5 | 20 | 9 | |
| Lymph node metastasis | |||
| No | 10 | 28 | <.001 |
| Yes | 25 | 6 | |
| Grade | |||
| Well‐differentiated | 5 | 10 | .3082 |
| Moderately differentiated | 18 | 15 | |
| Poorly differentiated | 12 | 9 | |
| TNM stage | |||
| IIA+IIB | 15 | 24 | .020 |
| IIIA+IIIB | 20 | 10 |
Abbreviations: CA 19‐9: carbohydrate antigen 19‐9; TNM: tumor‐lymph node; metastasis.
Pearson Chi‐square test.
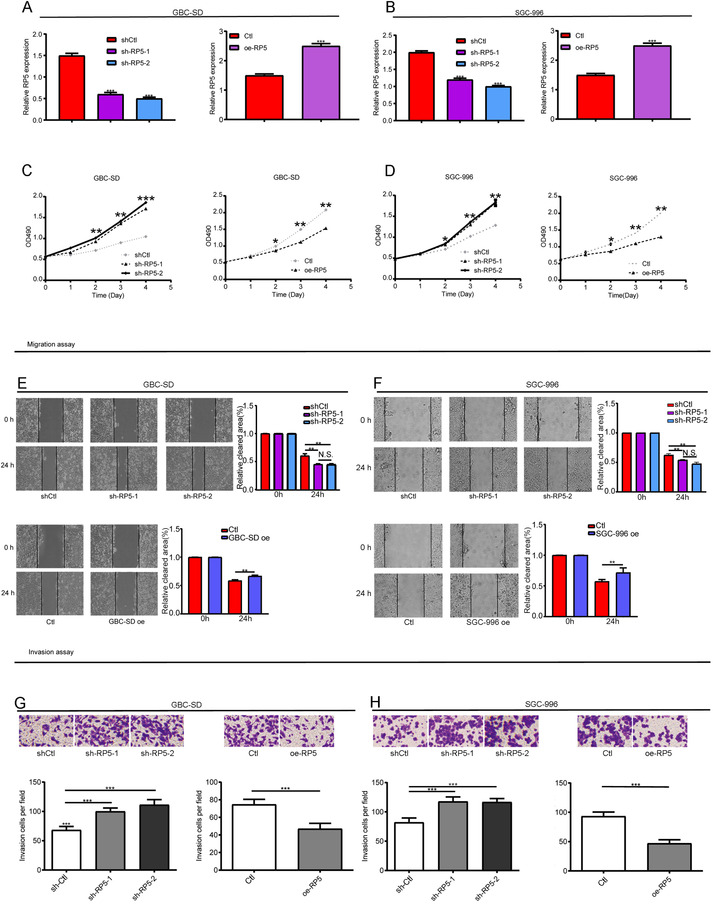
The clinical significance of lnc‐CITED2‐2:1 led us to investigate its biological function in GBC. Herein, an in vitro assay was carried out. At first, both cell lines were transfected with the control, lnc‐CITED2‐2:1 shRNA, and lnc‐CITED2‐2:1 overexpression pcDNA, respectively. Then, qPCR results confirmed the knockdown and overexpression efficiency (Figure 2A,B). CCK8 assay indicated that knockdown of endogenous lnc‐CITED2‐2:1 accelerated the cell‐proliferation abilities of GBC cell‐lines, whereas the accumulation of endogenous lnc‐CITED2‐2:1 led to a significant decrease in the cell‐proliferation abilities GBC cell‐lines (Figure 2C,D). In terms of the migration and invasion abilities, they were promoted in lnc‐CITED2‐2:1 knockdown GBC‐SD cells compared to control cells. In contrast, the migration and invasion abilities of lnc‐CITED2‐2:1 overexpression GBC‐SD cells were suppressed compared to the control cells (Figure 2E,G). We found similar results in the SGC‐996 cell line (Figure 2F,H). In summary, all these results indicated that lnc‐CITED2‐2:1 could inhibit the cellular function of GBC cell lines, including proliferation, migration, and invasion abilities.
FIGURE 2.

Effects of lnc‐CITED2‐2:1 downregulation and overexpression on GBC cell proliferation. A and B, The knockdown and overexpression efficiency in GBC‐SD and SGC‐996 cells were confirmed using qPCR. * P < .05; ** P < .01; *** P < .001. C and D, The CCK‐8 assay was used to evaluate the proliferation ability of GBC‐SD and SGC‐996 cell lines. Knockdown of lnc‐CITED2‐2:1 significantly increased cell proliferation ability, whereas overexpression of lnc‐CITED2‐2:1 significantly inhibited cell proliferation ability. One‐way analysis of variance (ANOVA) for the knockdown group. * P < .05; ** P < .01; *** P < .001. E and F, Wound healing assay was used to evaluate the migration ability of GBC‐SD and SGC‐996 cell lines. Knockdown of lnc‐CITED2‐2:1 significantly increased cell migration ability, whereas overexpression of lnc‐CITED2‐2:1 significantly inhibited cell migration ability. One‐way analysis of variance (ANOVA) for the knockdown group. * P < .05; ** P < .01; *** P < .001. G and H, Transwell assay was used to evaluate the invasion ability of GBC‐SD and SGC‐996 cell lines. Knockdown of lnc‐CITED2‐2:1 significantly increased cell invasion ability, whereas overexpression of lnc‐CITED2‐2:1 significantly inhibited cell invasion ability. One‐way analysis of variance (ANOVA) for the knockdown group. * P < .05; ** P < .01; *** P < .001. [Correction added on 10 July 2020, after first online publication: Figure 2 has been corrected.]
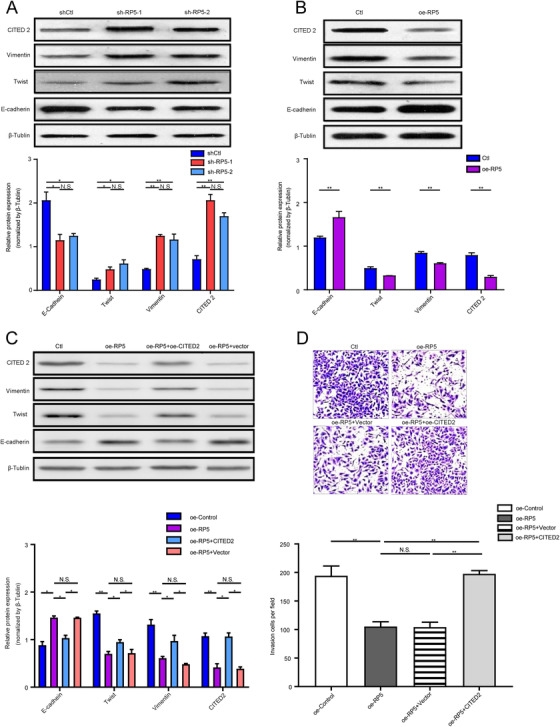
To figure out the potential mechanism underlying the inhibitive effect of lnc‐CITED2‐2:1 on GBC, the downstream effector and signaling pathway involved in this process were investigated. According to the UCSC database (https://genome.ucsc.edu/), the location of lnc‐CITED2‐2:1 is chr6:139856104‐139877391 (Figure S1B). Around this position, there were several protein‐coding genes, including CITED2, ECT2L, and REPS1. Previously, lincRNAs have been reported that could regulate the expression of protein‐coding genes simply by transcription from the lincRNA locus or through actively recruiting epigenetic modifiers activators, and repressors. 7 Herein, the correlation between lnc‐CITED2‐2:1 and three protein‐coding genes was investigated through qRT‐PCR, which indicated that the expression level of lnc‐CITED2‐2:1 was negatively associated with the expression level of Cited 2 (Figure S2, R = −0.85, P < .001). Besides, it has been reported that CITED2 could regulate the function of tumor cells, like the invasion ability of colon cancer. 8 Meanwhile, epithelial‐mesenchymal transition (EMT) has been identified as one important process that supplies cancer cells with increased migratory and invasive abilities. 9 Herein, we assumed that lnc‐CITED2‐2:1 might serve as a regulator of CITED2 and EMT and then inhibited the invasion ability of the GBC cell line. To validate the hypotheses, the expression of key molecules of EMT and CITED2 were evaluated in both lnc‐CITED2‐2:1 knockdown and overexpressed GBC cells. Increasing expression of Twist, CITED2, and Vimentin and decreasing expression of E‐cadherin were observed after lnc‐CITED2‐2:1 being silenced in GBC cell lines (Figure 3A). Conversely, decreased expression of Twist, Vimentin, and CITED2 and increased expression of E‐cadherin were observed in lnc‐CITED2‐2:1 overexpressed GBC cell line (Figure 3B). These results suggested that overexpression of lnc‐CITED2‐2:1 could suppress the expression of CITED2 and EMT, which may explain the inhibitive effect of this lncRNA on GBC cells.
FIGURE 3.

Lnc‐CITED2‐2:1 might influence the GBC‐SD cell line function through regulating the protein expressions of CITED2 and key molecular of the EMT process. A, Western blot indicated that the knockdown of lnc‐CITED2‐2:1 decreased the expression level of E‐cadherin and increased the expression level of twist and vimentin. * P < .05; ** P < .01; *** P < .001. B, Western blot indicated that the overexpression of lnc‐CITED2‐2:1 increased the expression level of E‐cadherin and decreased the expression level of twist and vimentin. * P < .05; ** P < .01; *** P < .001. C, Western blot indicated that the overexpression of CITED2 in lnc‐CITED2‐2:1 overexpression GBC‐SD cell lines could promote the protein expression of twist and vimentin and suppress the protein expression of E‐cadherin. * P < .05; ** P < .01; *** P < .001. D, The overexpression of CITED2 in lnc‐CITED2‐2:1 overexpression GBC‐SD cell lines could inhibit the invasion ability of lnc‐CITED2‐2:1 overexpression GBC‐SD cells. * P < .05; ** P < .01; *** P < .001
Further experiments were performed to define whether the lnc‐CITED2‐2:1 function was regulated by CITED2. Overexpression of lnc‐CITED2‐2:1 could induce decreased protein expression of CITED2 in GBC cell lines. Meanwhile, the protein expressions of Vimentin and Twist, which was downregulated by lnc‐CITED2‐2:1, were significantly increased by overexpression of CITED2, while the protein expression level of E‐cadherin, which was upregulated by lnc‐CITED2‐2:1, was significantly decreased by overexpression of CITED2 (Figure 3C). Meanwhile, overexpression of lnc‐CITED2‐2:1 significantly inhibited cell invasion ability, which was significantly reversed after the overexpression of CITED 2 (Figure 3D). In the SGC‐996 cell line, similar results were observed (Figure S3). According to these results, the overexpression of CITED 2 could reverse the effect of lnc‐CITED2‐2:1 on GBC cells. Herein, we concluded that lnc‐CITED2‐2:1 might regulate the invasion ability of GBC cell lines via suppressing the expression of CITED2 and regulating the EMT processes.
1. CONCLUSIONS
In conclusion, our study demonstrated that lnc‐CITED2‐2:1 might act as a prognostic biomarker and a tumor‐suppressing gene of GBC, which could inhibit the invasion ability of GBC cells via suppressing the protein expression of CITED2 and EMT process, providing a potential therapeutic target for GBC treatment.
CONFLICT OF INTEREST
The authors declare that they have no conflict of interest.
AVAILABILITY OF DATA AND MATERIAL
The datasets generated and analyzed during the current study are available from the corresponding author on a reasonable request.
AUTHOR CONTRIBUTIONS
L.H. and L.H.B. were associated with study conception and design; S.S., W.J.W., Z.B.H., and N.X.J. were associated with the development of methodology and acquisition of data; S.S., Z.B.H., and G.Z.H. were associated with analysis and interpretation of data; L.P.X., Z.D.X., N.X.L., S.T., L.H., and L.H.B. provided technical or material support; Z.B.H., S.S., and W.J.W. were associated with writing, review. and/or revision of the manuscript. All authors have reviewed and approved the final manuscript.
Supporting information
Figure S1
Figure S2
Figure S3
Supplementary materials
Table S1 Primers used for reverse transcription‐quantitative polymerase chain reaction.
ACKNOWLEDGMENTS
This work was supported by the National Natural Science Foundation of China [81872352], Shanghai top priority Clinical Medical Center and Key Discipline Construction Plan (2017ZZ02007), and JianFeng project of Xuhui provincial commission of health and family planning (SHXH201703).
Contributor Information
Hou‐Bao Liu, Email: zsliuhb@sina.cn.
Han Liu, Email: zsliuh@sina.cn.
REFERENCES
- 1. Bray F, Ferlay J, Soerjomataram I, Siegel RL, Torre LA, Jemal A. Global cancer statistics 2018: gLOBOCAN estimates of incidence and mortality worldwide for 36 cancers in 185 countries. CA Cancer J Clin. 2018;68(6):394‐424. [DOI] [PubMed] [Google Scholar]
- 2. Dutta U. Gallbladder cancer: can newer insights improve the outcome? J Gastroenterol Hepatol. 2012;27(4):642‐653. [DOI] [PubMed] [Google Scholar]
- 3. Pilgrim C, Usatoff V, Evans PM. A review of the surgical strategies for the management of gallbladder carcinoma based on the T stage and growth type of the tumor. Eur J Surg Oncol. 2009;35(9):903‐907. [DOI] [PubMed] [Google Scholar]
- 4. Chen J, Yu Y, Li H, et al. Long non‐coding RNA PVT1 promotes tumor progression by regulating the miR‐143/HK2 axis in gallbladder cancer. Mol Cancer. 2019;18(1):33. [DOI] [PMC free article] [PubMed] [Google Scholar]
- 5. Liang C, Yang P, Han T, et al. Long non‐coding RNA DILC promotes the progression of gallbladder carcinoma. Gene. 2019;694:102‐110. [DOI] [PubMed] [Google Scholar]
- 6. Ma MZ, Chu BF, Zhang Y, et al. Long non‐coding RNA CCAT1 promotes gallbladder cancer development via negative modulation of miRNA‐218‐5p. Cell Death Dis. 2015;6:e1583. [DOI] [PMC free article] [PubMed] [Google Scholar]
- 7. Ulitsky I, Bartel DP. Lincrnas: genomics, evolution, and mechanisms. Cell. 2013;154(1):26‐46. [DOI] [PMC free article] [PubMed] [Google Scholar]
- 8. Bai L, Merchant JL. A role for CITED2, a CBP/p300 interacting protein, in colon cancer cell invasion. FEBS Lett. 2007;581(30):5904‐5910. [DOI] [PMC free article] [PubMed] [Google Scholar]
- 9. Lamouille S, Xu J, Derynck R. Molecular mechanisms of epithelial‐mesenchymal transition. Nat Rev Mol Cell Biol. 2014;15(3):178‐196. [DOI] [PMC free article] [PubMed] [Google Scholar]
Associated Data
This section collects any data citations, data availability statements, or supplementary materials included in this article.
Supplementary Materials
Figure S1
Figure S2
Figure S3
Supplementary materials
Table S1 Primers used for reverse transcription‐quantitative polymerase chain reaction.
Data Availability Statement
The datasets generated and analyzed during the current study are available from the corresponding author on a reasonable request.


