FIG 4.
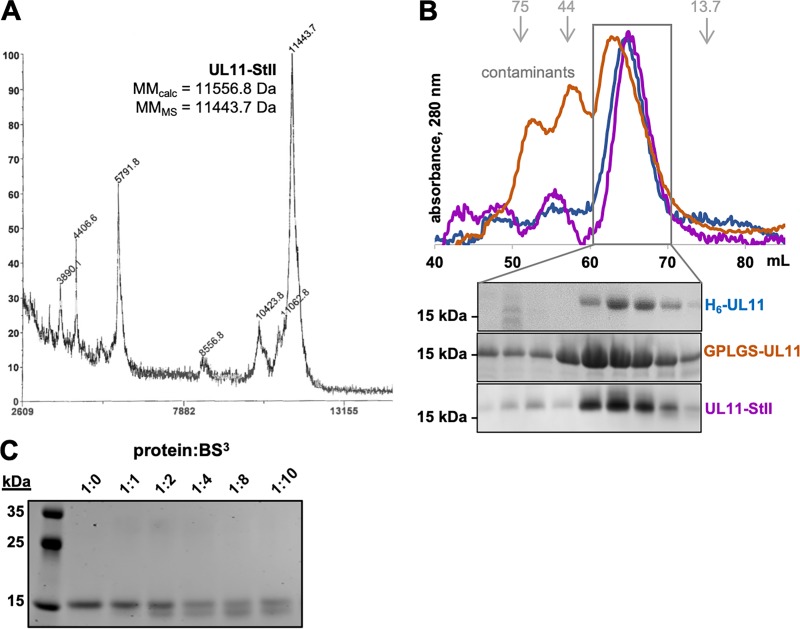
UL11 is an elongated monomer. (A) MALDI-TOF spectrum of UL11-StII. The x axis shows the mass-to-charge ratio (m/z) in daltons and the y axis shows relative abundance (%) scaled for the mass range in x. (B) Size exclusion chromatography (SEC) A280 traces and gels. The elution volumes of calibration standards used to calculate apparent molecular masses (kDa) are depicted in gray and with gray arrows. (C) Coomassie blue-strained gel of UL11 incubated with increasing amounts of BS3 cross-linker.

