

Abstract
Introduction
Dozens of Alzheimer's disease (AD)‐associated loci have been identified in European‐descent populations, but their effects have not been thoroughly investigated in the Hong Kong Chinese population.
Methods
TaqMan array genotyping was performed for known AD‐associated variants in a Hong Kong Chinese cohort. Regression analysis was conducted to study the associations of variants with AD‐associated traits and biomarkers. Lasso regression was applied to establish a polygenic risk score (PRS) model for AD risk prediction.
Results
SORL1 is associated with AD in the Hong Kong Chinese population. Meta‐analysis corroborates the AD‐protective effect of the SORL1 rs11218343 C allele. The PRS is developed and associated with AD risk, cognitive status, and AD‐related endophenotypes. TREM2 H157Y might influence the amyloid beta 42/40 ratio and levels of immune‐associated proteins in plasma.
Discussion
SORL1 is associated with AD in the Hong Kong Chinese population. The PRS model can predict AD risk and cognitive status in this population.
Keywords: Alzheimer's disease, disease risk, polygenic risk score, population genetics, SORL1
1. BACKGROUND
Alzheimer's disease (AD), an aging‐related neurodegenerative disorder and the most common form of dementia, immensely impacts memory and cognitive functions. Sporadic AD, also called late‐onset AD, exhibits 58% to 79% heritability and accounts for >90% of AD cases. 1 Genetics studies of late‐onset AD have identified numerous risk loci represented by common genetic variants associated with AD. 2 , 3 In particular, the apolipoprotein E (APOE) locus, represented by multiple coding and noncoding variants, is a well‐accepted genetic risk factor for late‐onset AD. 4 Meanwhile, several rare coding mutations also incur AD risk, including TREM2 R47H and H157Y. 5 , 6 , 7 , 8 These coding mutations modify protein functions in parallel with the common noncoding risk variants, which potentially modulate gene expression, and thus represent alternative pathological mechanisms. 9 , 10 However, late‐onset AD has a complex etiology; its pathogenesis is possibly determined by multiple genetic loci rather than a single individual genetic risk factor. Concordantly, applications of polygenic risk score (PRS) models to European‐descent AD genetic datasets show that the aggregate risk scores obtained from multiple genetic loci can distinguish AD patients from individuals without dementia. 11 , 12 , 13
Genetic background potentially influences how genetic factors contribute to AD pathogenesis. For instance, the risk effects of APOE‐ε4 vary among ethnic groups. 14 , 15 , 16 The prevalence of two AD risk missense mutations of another disease gene, TREM2—R47H and H157Y—differ between European‐descent and East Asian populations. 7 , 17 , 18 Specifically, TREM2 H157Y is extremely rare in European populations (≈1 in 3955 individuals) and more frequent in East Asian populations (≈1 in 555 individuals). 19 However, as most AD genome‐wide association studies (GWASs) have been conducted in European‐descent populations, it is important to evaluate the risk effects of previously identified risk loci in other ethnic groups to understand how they contribute to AD in a more general context.
Given that Hong Kong has the longest life expectancy of any country or territory worldwide, 20 its population might have a higher prevalence of aging‐related diseases including AD. Nonetheless, few AD genetics studies have been conducted in this population. 21 , 22 Therefore, in this study, we comprehensively analyzed the known AD genetic risk factors in the Hong Kong Chinese population by performing array genotyping for known AD‐associated single nucleotide polymorphisms (SNPs). Our results suggest that the APOE and SORL1 loci are associated with AD in the Hong Kong Chinese population. In addition, we developed a PRS model to estimate an individual's cognitive status and risk of developing AD, which exerted superior prediction accuracy for AD risk compared to the APOE genotype, and may modulate specific biological pathways as reflected by the changes in plasma proteins. Moreover, five individuals in this cohort harbored TREM2 H157Y mutations, warranting further study of the roles of TREM2 and its disease‐associated variants (e.g., H157Y) in AD pathogenesis.
2. METHODS
2.1. Study participants
A total of 829 participants were recruited from the Specialist Outpatient Department of Prince of Wales Hospital of the Chinese University of Hong Kong. The cohort comprised 378 patients with AD, 70 with mild cognitive impairment (MCI), 18 with vascular dementia (VaD), and 363 age‐matched heathy controls (NCs). All participants underwent neuroimaging assessment by MRI and cognitive normality assessment using the Montreal Cognitive Assessment (MoCA). 23 Patients with AD were diagnosed according to the Diagnostic and Statistical Manual of Mental Disorders, Fifth Edition (DSM‐5). 24 In addition, an elderly cohort (n = 402) was recruited from Prince of Wales Hospital; 49 of them without significant cognitive deficits or a history of other significant diseases (e.g., stroke and heart attack) were included as additional NCs (n = 49). The phenotypes of the participants were determined on the basis of the most recent diagnostic records (until December 2019). This study was approved by Prince of Wales Hospital, the Chinese University of Hong Kong, and the Hong Kong University of Science and Technology. All participants provided written informed consent for both study enrollment and sample collection. The demographic data of each cohort can be viewed in Table S1 in supporting information.
To further investigate the effect of PRS in the European‐descent AD, we have included the Late Onset Alzheimer's Disease (LOAD) Family Study (phs000168.v2.p2) in the analysis. The demographic data for this cohort can be also viewed in Table S1. The details for the analysis can be found in the supporting information.
2.2. SNP array and APOE genotyping
Forty‐eight AD‐associated SNPs were selected from the literature; these included 42 common SNPs—12 from APOE and nearby regions reported in previous studies, 2 , 3 , 4 , 25 24 from the two European‐descent AD GWASs,2,3 and 6 from other known candidates (including KCNJ15, LINC01413, SAMD4A, IL33, and IL1RL1) 10 , 26 , 27 , 28 —as well as 6 rare variants located in APP (A713T), PSEN1 (P264L and V97L), MAPT (R5L), and TREM2 (R47H and H157Y) 6 , 7 , 29 , 30 , 31 , 32 , 33 (Table S2 in supporting information). SNP array genotyping was performed using TaqMan Custom Plating (96‐well plate format, Lot: SO30311417_1; Thermo Fisher Scientific) with 48 probes targeting the preselected SNP sites in 729 DNA samples (n = 333, 33, 345, and 18 for the NC, MCI, AD, and VaD groups, respectively). APOE genotyping was conducted by TaqMan Assay (APOE‐ε2 by rs7412, C____904973_10; Cat No.: 4351376; APOE‐ε4 by rs429358, C___3084793_20; Cat. No.: 4351376; Thermo Fisher Scientific). Real‐time qPCR was performed using the 7500 Fast and QuantStudio 7 Flex Real‐Time PCR System (Applied Biosystems). The results were stored in EDS files and input into TaqMan Genotyper Software (Applied Biosystems) for the joint genotyping of SNPs (see supporting information for details).
2.3. Statistical analysis
All analyses were performed using R programming (v3.6.2) in Rstudio (v1.1.453). Logistic regression analysis in dominant, recessive, and additive models was conducted to identify variants associated with AD using the glm() function (stats v3.6.2), with adjustment for age, sex (and APOE genotype). Furthermore, linear or robust linear regression analysis was performed to determine the associations between SNP genotypes and AD‐associated traits (i.e., cognitive performance as indicated by MoCA score, brain volume, and proteome biomarker data) using the lm() or lmrob() function from the robustbase package (v0.93.5), including age, sex, and education level (when analyzing MoCA) as covariates. The effects of APOE genotype were further evaluated by including APOE ε2 and APOE ε4 genotypes as covariates or analyzing APOE ε3 homozygous participants when assessing the associations between variants or PRS and AD or AD‐associated traits. Power calculation was conducted by Quanto (v1.2.4). 34 , 35 Linkage disequilibrium analysis was conducted by inputting the variant ID into the LDlink database (ldlink.nci.nih.gov/). 36 Mapping for genotype‐expression association for SORL1 rs11218343 was conducted by query the GTEx portal (https://gtexportal.org/home/). 37 Correction for multiple testing was conducted by calculating the false discover rate (FDR) for each analysis using p.adjust() function. FDR values were calculated independently for each assumption (dominant, recessive, additive), or different conditions (with or without controlling for APOE genotype, or in APOE ε3 homozygous participants) for the effect of variants.
RESEARCH IN CONTEXT
Systematic review: The authors reviewed genome‐wide association studies reported in the literature (e.g., PubMed) to identify candidate Alzheimer's disease (AD) risk variants for analysis. The authors further reviewed associated reports of the impacts of those variants. The relevant sources and databases have been cited appropriately.
Interpretation: This study comprehensively analyzed known AD genetic risk factors in a Hong Kong Chinese cohort. A polygenic risk score (PRS) model, which integrate genotype information of only seven single nucleotide polymorphisms, was developed, and found to exert superior performance in predicting AD risk compared to the apolipoprotein E (APOE) genotype and cross‐validated in an independent dataset. The protein network(s) and pathway(s) identified to be associated with the PRS suggest possible mechanisms by which the aggregate effects of AD risk modify an individual's risk of AD. The unsuccessful replication of the PRS model in the European‐descent AD cohort suggests the impacts of ethnic effects in genetics and PRS‐related research.
Future directions: Given that SORL1 is an AD‐associated genetic factor in both Asian and European‐descent populations and that TREM2 H157Y carriers were identified in the Hong Kong Chinese AD population, further studies are warranted to investigate the effects of these genetic risk factors in AD. Moreover, subsequent studies with larger sample size would be required to validate the PRS model developed herein.
2.4. Meta‐analysis of SNP–phenotype associations
For SORL1 rs11218343 and ABCA7 rs4147929, AD association results (i.e., odds ratios and 95% confidence intervals) from previous studies on SORL1 2 , 38 , 39 , 40 , 41 , 42 , 43 and ABCA7 2 , 41 , 44 , 45 , 46 were converted to β‐values with standard errors and submitted to METASOFT (v2.0.1) for meta‐analysis using Han and Eskin's random effects model (RE2). 47 Heterogeneity was estimated by calculating Cochrane's Q and I 2.
2.5. Lasso regression analysis and polygenic risk score model construction
A lasso regression model was adopted for the construction of PRS model, which can both account for the linkage disequilibrium among the candidate SNPs, and select the optimal number of variants for model construction. 48 , 49 Two datasets were included for the construction and testing of the PRS model. The array dataset (n = 674), which consisted of 341 AD patients and 333 NCs, was used for model construction. Meanwhile, the whole‐genome sequencing (WGS) replication cohort (n = 149), which consisted of 79 NCs, 37 patients with MCI, and 33 patients with AD, was used for model testing. Prior to lasso regression analysis, the SNP genotypes of the 41 variants that passed the filtering were converted to {−1, 0, 1} by subtracting 1 from the original genotype dosage ({0, 1, 2}). The missing genotypes (i.e., 24 missing sites among the 674 individuals for 41 SNPs; missing rate = 8.68 × 10⁻⁴) were given a value of zero. Logistic regression was applied to determine the possible effects of disease‐associated covariates (i.e., age, sex, and education level) on the binary phenotype (0 = NC, 1 = AD). The residual from the logistic regression was then subjected to lasso regression by including the SNP genotypes of the 41 variants that passed filtering using the cv.glmnet() function from the glmnet package (v3.0.2) with 5‐fold cross‐validation (alpha = 1, type.measure = “mse,” nfolds = 5). The λ‐value of the model was determined by the relatively low error with the minimum number of SNPs with nonzero coefficients that were all significantly associated with AD (P < 0.05; see Table 1). PRSs were calculated by the scalar multiplication of covariate coefficients under the given λ‐value using the predict() function. Participants were grouped into the low, medium, or high PRS group according to PRS tertiles. Logistic regression was performed to examine the possible association between AD and PRS tertile (i.e., the high PRS group), with adjustment for age and sex. For the LOAD Family Study dataset (“LOAD dataset” hereafter), the top five principal components were further included as covariates in the logistic regression model to account for genomic background. As a comparison to the PRS model, a model that included only the APOE genotype was also created; this model included APOE ε4 and APOE ε2 in the logistic regression model, with the model outcome as the score. The model area under the receiver operating characteristic (ROC) curve (AUC), sensitivity, and specificity were calculated by the roc() function in the pROC R package.
TABLE 1.
Alzheimer's disease‐associated variants in the Hong Kong Chinese Alzheimer's disease cohort
| SNP ID | Gene symbol | EA | β‐value | SE | Z‐value | P‐value | FDR | EAF_NC | EAF_AD | EAF_EAS |
|---|---|---|---|---|---|---|---|---|---|---|
| rs429358 | APOE | C | 0.982 | 0.192 | 5.110 | 3.23E−07 | 1.28E−05 | 0.089 | 0.204 | 0.088 |
| rs11556505 | TOMM40 | T | 1.001 | 0.204 | 4.909 | 9.15E−07 | 1.28E−05 | 0.081 | 0.192 | 0.087 |
| rs2075650 | TOMM40 | G | 1.004 | 0.205 | 4.904 | 9.38E−07 | 1.28E−05 | 0.081 | 0.192 | 0.087 |
| rs519113 | NECTIN2 | G | 0.685 | 0.172 | 3.969 | 7.21E−05 | 6.93E−04 | 0.149 | 0.251 | 0.167 |
| rs75627662 | APOE | T | 0.640 | 0.163 | 3.931 | 8.45E−05 | 6.93E−04 | 0.197 | 0.282 | 0.186 |
| rs157581 | TOMM40 | C | 0.603 | 0.159 | 3.796 | 1.47E−04 | 1.00E−03 | 0.233 | 0.335 | 0.229 |
| rs6859 | NECTIN2 | A | 0.512 | 0.149 | 3.433 | 5.98E−04 | 3.50E−03 | 0.298 | 0.394 | 0.319 |
| rs440446 | APOE | G | 0.408 | 0.141 | 2.895 | 3.79E−03 | 1.94E−02 | 0.461 | 0.519 | 0.397 |
| rs11218343 | SORL1 | C | −0.401 | 0.154 | −2.601 | 9.28E−03 | 4.23E−02 | 0.318 | 0.256 | 0.298 |
| rs6014724 | CASS4 | G | −0.311 | 0.142 | −2.195 | 2.82E−02 | 1.07E−01 | 0.408 | 0.380 | 0.369 |
| rs4147929 | ABCA7 | A | −0.314 | 0.144 | −2.180 | 2.93E−02 | 1.07E−01 | 0.395 | 0.339 | 0.329 |
| rs7412 | APOE | T | −0.619 | 0.288 | −2.151 | 3.14E−02 | 1.07E−01 | 0.094 | 0.051 | 0.075 |
Note: Variants were significantly associated with AD (P < 0.05; n = 341 and 333 for AD and NC, respectively).
Abbreviations: AD, Alzheimer's disease; EA, effect allele; EAF_AD, effective allele frequency in AD patients; EAF_EAS, effective allele frequency in the East Asian population retrieved from the gnomAD database 8 ; EAF_NC, effective allele frequency in NCs; FDR, false discovery rate; NC, normal control; SE, standard error; SNP, single nucleotide polymorphism.
2.6. Proteomic analysis of plasma biomarkers
Plasma samples (n = 271) were analyzed on an HD‐1 analyzer (Quanterix) by the Quanterix Simoa Accelerator Laboratory (Boston, MA, USA) to detect AD‐associated plasma biomarkers including neurofilament light chain (NfL, NF‐light assay) as well as amyloid beta (Aβ)42, Aβ40, and tau (Neurology 3‐Plex A assay). To examine a broader range of plasma biomarkers, including those involved in inflammatory, neurological, or cardiovascular pathways, plasma samples (n = 180) were analyzed by the Olink Analysis Service Laboratory (Boston, MA, USA) using the Inflammation, Neurology, and CVD III panels (encompassing 280 proteins). Linear regression or robust linear regression analysis was performed to examine the associations of PRSs and TREM2 H157Y variants with plasma biomarkers. Candidates were selected on the basis of their P‐values (<0.05) and biological functions. Furthermore, robust linear regression analysis was performed with respect to PRS tertiles for the protein candidates (i.e., carriers vs noncarriers). The protein–protein interaction (PPI) network was constructed by subjecting the uniport IDs to the STRING database (https://string-db.org/) (v11.0), which also reported the Gene Ontology (GO) and pathway analysis results. 50
2.7. Data visualization
For the meta‐analysis, forest plots were generated using ForestPMPlot (v1.0.3). 51 Line plots for the lasso regression results were generated using the ggplot() function in the ggplot2 package (v3.2.1), and the heatmap was generated using the heatmap.3() function (https://github.com/obigriffith/biostar-tutorials/blob/master/Heatmaps/heatmap.3.R). The ROC curve was plotted using the ggplot() function. The PPI network was constructed by submitting the gene list to the STRING database and visualizing the results with Cytoscape (v3.8.0). For the Sanger sequencing results, Ab1 files were visualized using the SnapGene viewer (v5.0.7). Bar charts and other grouped plots were generated using GraphPad Prism (v6.0c).
3. RESULTS
3.1. Quality control of array genotyping data
Array genotyping for the 48 preselected variants was conducted in 729 participants (see Table S1). To assess the performance of the array genotyping, 42 samples were randomly selected for re‐genotyping, with subsequent quality assessment conducted at both the individual and SNP levels, which resulted in 725 participants (n = 333, 33, 341, and 18 for the NC, MCI, AD, and VaD groups, respectively; see Table S1 for participant characteristics) and 41 SNPs for the subsequent analyses (see supporting information for quality assessment, Table S2 for the SNP list, and Figure 1 for the overall study design).
FIGURE 1.
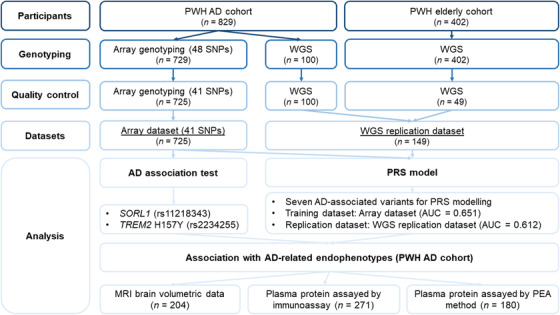
Study design schematic diagram. AD, Alzheimer's disease; AUC, area under the receiver operating characteristic curve; MRI, magnetic resonance imaging; PEA, proximity extension assay; PRS, polygenic risk score; PWH, Prince of Wales Hospital; SNP, single nucleotide polymorphism; WGS, whole‐genome sequencing.
3.2. Identification of Alzheimer's disease‐associated variants in the Hong Kong Chinese population
First, to identify variants that are possibly associated with AD in the Hong Kong Chinese population, additive logistic regression was performed on the array dataset (n = 341 and 333 for the AD and NC groups, respectively), with adjustment for age and sex. Several variants residing in APOE and nearby regions together with three other variants—SORL1 rs11218343, CASS4 rs6014724, and ABCA7 rs4147929—were significantly associated with AD (P < 0.05; Table 1). Among these three variants, only SORL1 rs11218343 was significantly associated with AD after correction for multiple testing (C allele: β = −0.401, P = 9.28E−03; FDR = 4.23E−02; Table 1). Subsequent analysis showed that rs11218343 might also fit the recessive model (C allele: β = −1.257, P = 9.55E−04; Table S3 in supporting information), suggesting that the C allele of rs11218343 homozygosity has a stronger AD protective effect than heterozygosity.
To examine whether the above results were affected by individual APOE genotype status, logistic regression further controlling for APOE genotype (i.e., APOE‐ε2 and APOE‐ε4) was conducted. Notably, our previous fine‐mapping study conducted in a mainland Chinese AD cohort identified noncoding risk factors in APOE nearby regions, including rs6859, which resides in the untranslated region of NECTIN2 (PVRL2). 4 In the present study, rs6859 was also significantly associated with AD after controlling for APOE genotype (β = 0.320, P = 4.81E−02; Table S4 in supporting information). In addition, SORL1 rs11218343 (β = −0.409, P = 1.05E−02) CASS4 rs6014724 (β = −0.297, P = 4.24E−02), and ABCA7 rs4147929 (β = −0.345, P = 2.07E−02) were significantly associated with AD after controlling for APOE genotype (Table S4). Moreover, SORL1 rs11218343 exhibited an AD protective effect in homozygous APOE‐ε3 carriers (C allele, β = −0.505, P = 1.64E−02; Table S4), suggesting its AD protective effect possibly functions in an APOE‐independent manner.
To further investigate the associations between the studied variants and individual cognitive status as indicated by MoCA scores, robust linear regression was applied with adjustment for age, sex, and education level. The results suggested that SORL1 rs11218343 and ABCA7 rs4147929 were significantly associated with MoCA scores before and after controlling for APOE genotype (P < 0.05; Table S5 in supporting information). However, only SORL1 rs11218343 survived the multiple test correction before controlling for APOE genotype (C allele: β = 0.728, P = 1.03E−02, FDR = 4.24E−02), further indicating the possible association between SORL1 and cognitive status in the Hong Kong Chinese population.
3.3. Meta‐analysis of the association between SORL1 rs11218343 and AD
The above results indicate that SORL1 rs11218343 and ABCA7 rs4147929 are associated with AD in the Hong Kong Chinese population. To further characterize the risk effects of these two variants in AD, their association results from the other AD cohorts were retrieved and compared. 2 , 38 , 39 , 40 , 41 , 42 , 43 , 44 , 45 , 46 Notably, the C allele of SORL1 rs11218343 exhibited a concordant AD protective effect in multiple ethnic groups including European‐descent cohorts, 38 Japanese and Korean cohorts, 39 and a mainland Chinese cohort. 42 Meta‐analysis corroborated this observation (β = −0.217, meta‐P = 1.20E−19; Figure 2), showing little heterogeneity among these studied cohorts (n = 37, Q = 35.88, P = 0.47, I 2 = 0). Therefore, SORL1 might be a general AD protective genetic factor across ethnic groups.
FIGURE 2.
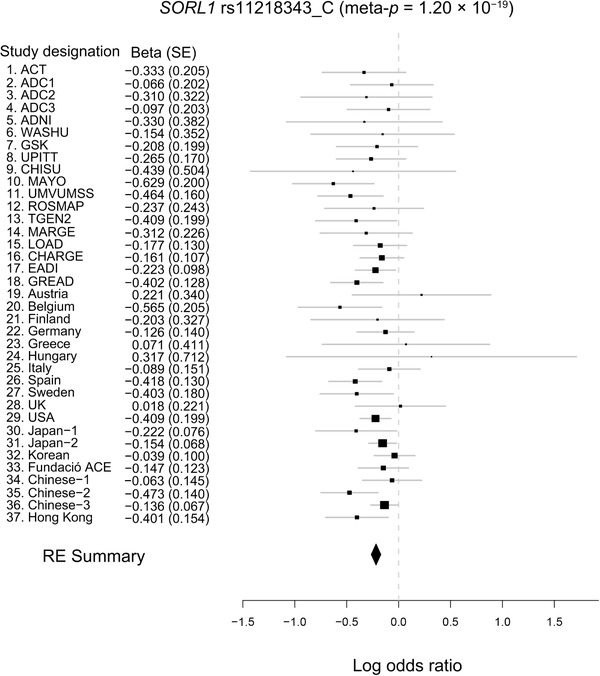
Meta‐analysis of the association of SORL1 rs11218343 with Alzheimer's disease. Forest plot showing the meta‐analysis results of SORL1 rs11218343 (C allele) including data from the literature and array genotyping data. Effect sizes obtained from independent datasets and the meta‐analysis are denoted by black rectangles and the black diamond, respectively. Each row represents an independent dataset; lines indicate 95% confidence intervals, and rectangle size is proportional to the weight in the meta‐analysis (RE2 meta‐P = 1.20E−19, random effect β = −0.217, SE = 0.024). RE2, Han and Eskin's random effects model; SE, standard error. Data sources: rows 1‐15, 1 , 2 16‐29, 3 30‐32, 2 33, 4 34, 5 35, 6 36. 7
However, in contrast to a previous AD GWAS, 2 the A allele of ABCA7 rs4147929 exhibited an AD protective effect in the present Hong Kong Chinese AD cohort (β = −0.314, P = 2.93E−02). Although several studies also report a consistent trend showing that this allele has an AD protective effect in European‐descent (e.g., CHARGE, UK), 2 mainland Chinese, 41 and Iranian populations 46 (Figure S1 in supporting information), the meta‐analysis results indicate that it has an AD risk effect (β = 0.130, P = 7.26E−21; Figure S1)—again with low heterogeneity among the studied cohorts (n = 21, Q = 26.43, P = 0.15, I 2 = 24.31).
3.4. Construction of a polygenic risk score model for the prediction of Alzheimer's disease risk and cognitive status
Associations between AD and several studied variants were observed in the Hong Kong Chinese population as detailed above. As PRS models can indicate an individual's AD risk in European‐descent populations, we investigated the possibility of establishing a PRS model capable of representing AD risk in the Hong Kong Chinese based on the present data. Considering the presence of linkage disequilibrium among the AD‐associated variants in APOE and nearby regions, the lasso regression model was selected to determine the most informative variants for constructing the PRS model based on the array dataset (n = 341 and 333 for the AD and NC groups, respectively). 48 , 49 Accordingly, seven variants—SORL1 rs11218343, ABCA7 rs4147929, CASS4 rs6014724, and four other variants from APOE and nearby regions (including APOE ε4 and APOE ε2)—were selected from the lasso model to construct the PRS model (Figure 3A and Figure S2 in supporting information). Notably, the performance of the resulting PRS model was superior to that of the APOE genotype with respect to distinguishing patients with AD from NCs in the array dataset (AUC = 0.651 and 0.620, for the PRS and APOE model, respectively; Figure 3B). To determine whether the proposed PRS model could stratify individuals with different disease risks, individuals were grouped into the low, medium, or high PRS group according to PRS tertile. Interestingly, the high PRS group contained more patients with AD (63.7%) than the low PRS group (36.3%) or medium PRS group (45.3%; Figure S3 in supporting information). Further investigation revealed that compared to individuals with low or medium PRSs, those with high PRSs indeed had higher AD risk (β = 1.311, P = 2.45E−07, high vs low; β = 0.721, P = 2.53E−03, high vs medium; Table S6 in supporting information). In particular, for those non‐APOE ε4 carriers who are not in the high PRS group, their AD risk can be further separated by the score generated by the PRS model (β = 0.623, P = 1.47E−02, low vs medium; Table S6). Moreover, the MoCA scores differed significantly among PRS groups in all participants (P < 0.001; Figure 3C) and in those with a homozygous APOE ε3 genotype (P < 0.05; Figure 3D). Hence, the resulting PRS model can distinguish AD patients from NCs, and its performance for AD risk prediction in the Hong Kong Chinese population is superior to that using the APOE genotype alone.
FIGURE 3.
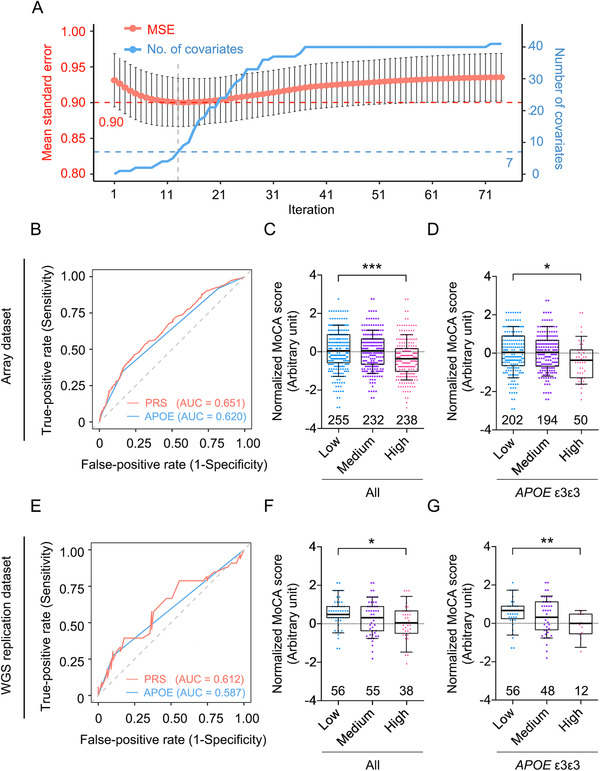
Polygenic risk score model for the prediction of cognitive performance and Alzheimer's disease risk. Performance of the PRS model to distinguish individuals with AD or worsening cognitive performance from healthy controls (NCs) in the array cohort and WGS replication cohort. A, Summary plot of lasso regression analysis of the array dataset. The x‐axis denotes the iterations in which different λ‐values were applied. The left (red) and right (blue) y‐axes denote the prediction accuracy of AD (measured according to the MSE) and the number of surviving covariates in each iteration, respectively. The dashed line marks the selected parameters used to construct the PRS model. B–D, Results from the array dataset: (B) ROC plot of AD prediction accuracy; red and blue denote the results from the PRS model and APOE genotypes, respectively; (C, D) association between PRS and normalized MoCA score. C, Total participants; low versus high: T = −3.34, ***P < 0.001. D, APOE‐ε3 homozygous participants; low versus high: T = −1.99, *P < 0.05. E–G, WGS replication dataset results: (E) ROC plot of AD prediction accuracy; red and blue denote the results from the PRS model and APOE genotypes, respectively; (F, G) Association between PRS and normalized MoCA score. F, Total participants; low versus high: T = −2.37, *P < 0.05. G, APOE‐ε3 homozygous participants; low versus high: T = −2.65, **P < 0.01. C, D, F, G, Boxes indicate the 25th to 75th percentiles, and whiskers indicate the 10th and 90th percentiles; numbers indicate the numbers of individuals in the corresponding group. AD, Alzheimer's disease; AUC, area under the receiver operating characteristic curve; ROC, receiver operating characteristic; MoCA, Montreal Cognitive Assessment; MSE, mean squared error; PRS, polygenic risk score; WGS, whole‐genome sequencing.
To further evaluate the ability of the PRS model to predict AD risk and associated cognitive status, an additional independent Hong Kong Chinese WGS dataset was included as a replication dataset (“WGS replication dataset” hereafter, n = 149; Figure 1, Table S1). After applying the same PRS model to this dataset, the model again exhibited superior performance for distinguishing AD patients from NCs compared to the APOE genotype (AUC = 0.612 and 0.587; Figure 3E). Moreover, the proportion of AD patients was again larger among those with medium PRSs (23.6%) or high PRSs (34.2%) than those with low PRSs (12.5%; Figure S3). In addition, individuals with high PRSs again exhibited significantly higher AD risk than those with low PRSs (β = 1.313, P = 2.89E−02, high vs low; Table S6 in supporting information). Furthermore, PRS was significantly associated with MoCA score in all participants (P < 0.05; Figure 3F) and among those with a homozygous APOE ε3 genotype (P < 0.01; Figure 3G). Therefore, our results collectively suggest that the proposed PRS model is more indicative of AD risk than APOE genotype alone and can predict AD risk and cognitive status in the Hong Kong Chinese population.
As the variants selected for this study were mainly selected from the European‐descent GWAS hits, the current PRS model is also possible to be applied in European‐descent populations for AD risk prediction. Accordingly, to replicate the PRS model in a European‐descent population, we collected the genotype and phenotype information from the LOAD cohort (n = 2,232, 1,582, and 464 for the NC, probable AD, and definite AD groups, respectively; see supporting information and Table S1 for details). Interestingly, although the PRS model distinguished both patients with probable AD and definite AD from the NCs, it performed almost the same as using APOE genotype alone (AUC = 0.668 and 0.665, for the PRS model and APOE to distinguish probable AD from NC, respectively; AUC = 0.717 and 0.714, for the PRS model and APOE to distinguish definite AD from NC, respectively; Figure S4A, B, Table S7 in supporting information). Moreover, a baseline shift of the PRS was observed in the LOAD cohort, as most individuals were classified into the medium and high PRS groups (n = 50, 1,258, and 2,970 for the low, medium, and high PRS group, respectively; Figure S4C–E). Hence, the current PRS model based on and optimized for the Hong Kong Chinese population cannot be directly applied to a European‐descent cohort. Thus, the results further indicate the potential influence of ethnic background on AD pathogenesis as well as potential issues arising when applying the PRS analysis to datasets with an unmatched genetic background.
3.5. Functional implications of the Alzheimer's disease polygenic risk score model
Next, to investigate the biological implications of the PRS model based on the Hong Kong Chinese population, we integrated several types of AD endophenotype data collected from some of the individuals in our Hong Kong Chinese AD cohort into the model, including brain volumetric data (n = 204) and the plasma “ATN” panel (i.e., Aβ, tau, and NfL) determined by immunoassay (n = 271), which are indicative of AD status. Also integrated into the model were the levels of 280 plasma proteins (n = 180 for 280 proteins involving the cardiovascular, inflammation, and neurology‐related pathways) assayed by proximity extension assay technology for unbiased screening for possible biomarkers or pathways associated with the PRS.
Initial screening for AD‐associated plasma biomarkers revealed significant alterations in plasma NfL (β = 7.162, P = 1.49E−12, FDR = 7.45E−12; Table S8 in supporting information), Aβ42/Aβ40 ratio (β = −0.006, P = 9.24E−05, FDR = 2.31E−04; Table S8), and Aβ40 (β = 16.896, P = 1.92E−02, FDR = 3.17E−02; Table S8) in the AD patients from the present Hong Kong Chinese AD cohort. Subsequent analysis revealed that PRS was associated with plasma Aβ42 level (β = −2.845, P = 3.37E−02, FDR = 8.43E−02; Table S8) and plasma Aβ42/Aβ40 ratio (β = −0.010, P = 1.31E−02, FDR = 6.55E−02; Figure 4A, Table S8) after controlling for phenotypes. Moreover, PRS was negatively associated with the volume of the hippocampus (β = −1.030, P = 4.74E−03, FDR = 4.98E−02; Figure 4B, Table S9 in supporting information) and amygdala (β = −1.028, P = 2.22E−03, FDR = 4.66E−02; Figure 4C, Table S9), corroborating the observed associations between PRS and cognitive performance in the present Hong Kong Chinese AD cohort.
FIGURE 4.
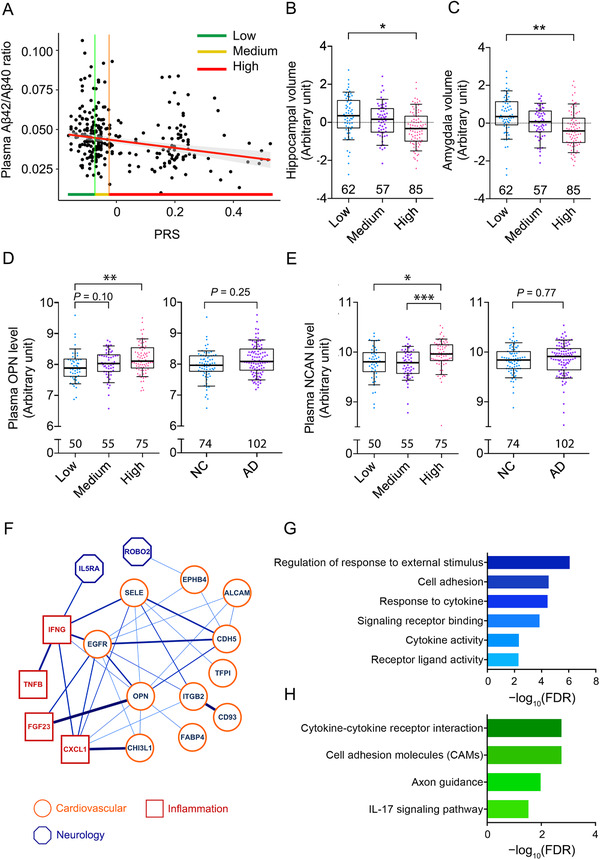
Associations between polygenic risk score and disease‐related endophenotypes. A, Association between PRS and plasma Aβ42/Aβ40 ratio; T = −3.14, P = 1.89E−03 (n = 266). Green, yellow, and red (along with vertical lines for clarity) specify the ranges of PRSs (i.e., tertiles) in the low, medium, and high PRS groups, respectively. B, C, Association between PRS and brain volume. B, Association between PRS and hippocampal volume; low versus high: T = −2.57, *P < 0.05. C, Association between PRS and amygdala volume; low versus high: T = −2.70, **P < 0.01. D, E, Associations between PRS and levels of plasma proteins. D, Association between PRS and plasma OPN protein level; AD versus NC: T = 1.15, P = 0.25; low versus medium: T = 1.68, P = 0.10; low versus high: T = 3.31, **P < 0.01. E, Association between PRS and plasma NCAN protein level; AD versus NC: T = 0.29, P = 0.77; low vs high: T = 2.36, *P < 0.05; medium vs high: T = −3.49, ***P < 0.001. F–H, Protein–protein interaction network and enrichment analysis of plasma proteins associated with PRS (P < 0.05). Protein–protein interaction enrichment; P = 7.78E−11. B–E, Boxes indicate the 25th to 75th percentiles, and whiskers indicate the 10th and 90th percentiles; numbers indicate the numbers of individuals in the corresponding group. F, Protein–protein interaction network of PRS‐associated plasma proteins. Node color specifies the protein class, and edge color and thickness are proportional to the pairwise interaction score. G, H, Enrichment analysis of the plasma protein interaction network. Results (FDR < 0.05) for Gene Ontology (G) and pathway analysis (H) are shown. Aβ, amyloid‐beta; AD, Alzheimer's disease; FDR, false discovery rate; MCI, mild cognitive impairment; MoCA, Montreal Cognitive Assessment; NC, normal control; NCAN, neurocan; OPN, osteopontin; PRS, polygenic risk score; WGS, whole‐genome sequencing.
As the association between plasma Aβ level and PRS indicates a possible alteration of the plasma protein profile in individuals with high PRSs, an unbiased screening for proteins associated with PRS was conducted. The results identified 25 plasma proteins that were significantly associated with PRS after controlling for phenotypes (P < 0.05; Table S10 in supporting information). Of note, the extracellular matrix protein OPN (osteopontin), and NCAN (neurocan core protein), which is synthesized by neurons, were among the top candidates (β = 0.673 and 0.411, P = 5.95E−04 and 1.94E−03, respectively; Figure 4D, E, Table S10). Hence, the PRS is likely to modulate multiple biological pathways, as reflected by the observed changes in plasma proteins involved in diverse biological functions.
To further understand the biological function of the PRS‐associated proteins, network analysis was conducted to reveal their relationships and overall biological representations (Figure 4F). Interestingly, the PPI network annotated according to the STRING database showed that the PPI was enriched within the candidate proteins associated with the PRS (PPI enrichment P = 7.78E−11; Table S11 in supporting information), implying their possible concurrent involvement in certain biological pathways. Subsequent GO and pathway analysis corroborated this notion, revealing the potential functions of these candidate proteins in cell adhesion, response to cytokines, and axon guidance (FDR = 3.00E−05, 3.65E−05, and 1.06E−02, respectively; Figure 4G, H, Table S12, S13 in supporting information). Meanwhile, plasma proteins from all three functional domains (i.e., cardiovascular‐, inflammation‐, and neurology‐related pathways) participated in the PPI network and exhibited a certain degree of interaction (Figure 4F), implying a crosstalk between multiple signaling pathways possibly influenced by the aggregate effects of AD genetic risk. Thus, these results suggest that the candidate loci represented by the PRS model exert a combinational effect on Aβ‐associated pathways and other pathways such as cardiovascular‐ and inflammation‐related pathways.
3.6. Identification of TREM2 H157Y carriers in the Hong Kong Chinese population
Furthermore, in addition to the common AD‐associated variants identified in the Hong Kong Chinese population, 5 TREM2 H157Y carriers (n = 1 and 4 in the NC and AD groups, respectively) were identified by the array and confirmed by Sanger sequencing (e.g., Figure 5A). Meanwhile, the other AD‐associated variant, TREM2 R47H, was not found in this cohort. Individuals harboring TREM2 H157Y (rs2234255 A allele) tended to have lower MoCA scores, although the association was not statistically significant in AD patients (P < 0.05 and P = 0.15 in all participants and AD patients, respectively; Figure 5B,C). Moreover, in AD patients, TREM2 H157Y was significantly associated with an elevated plasma Aβ42/Aβ40 ratio (β = 0.006, P = 0.012; FDR = 5.80E−02; Figure 5D, Table S14 in supporting information). Hence, screening for plasma proteins associated with TREM2 H157Y was conducted, yielding 35 plasma proteins that were significantly associated with H157Y in AD patients (P < 0.05; n = 9 with FDR < 0.05; Table S15 in supporting information). For instance, TREM2 H157Y was associated with NOTCH3 plasma level (β = −0.762, P = 1.70E−05, FDR = 2.34E−03; Figure 5E, Table S15) as well as immune‐related plasma proteins, namely interleukin 2 (IL‐2; β = 0.201, P = 6.09E−03, FDR = 1.12E−01; Figure 5F, Table S15) and CASP‐3 (β = 1.882, P = 1.26E−04, FDR = 4.95E−03; Figure 5G, Table S15). Further PPI network analysis of the 35 plasma proteins again suggested they were generally enriched in the PPI of TREM2 H157Y‐associated proteins (PPI enrichment P = 9.38E−12; Table S16 in supporting information). Subsequent GO and pathway analysis again highlighted the relationships between TREM2 H157Y and immune‐associated pathways, as evidenced by the enrichment of GO terms and pathways including cytokine activity, immune system process, cytokine–cytokine receptor interaction, and IL‐17 signaling pathway (FDR = 1.00E−04, 9.51E−05, 2.24E−06, and 5.70E−04, respectively; Table S17, S18 in supporting information). Hence, these results suggest that TREM2 H157Y impacts cognitive functions and modifies the immune state in the peripheral system in the Hong Kong Chinese population.
FIGURE 5.
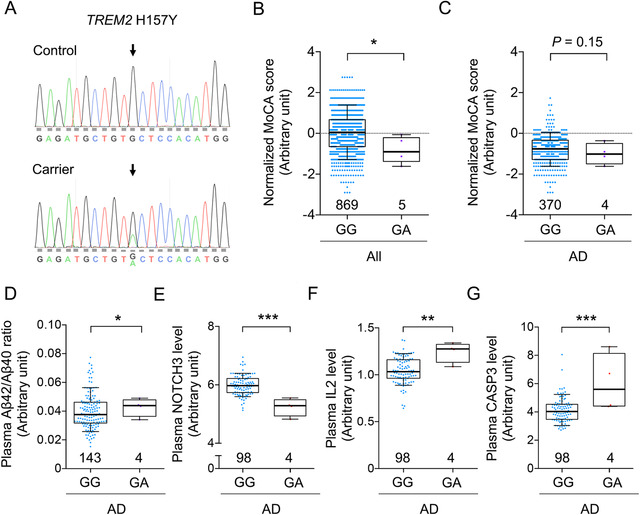
Identification of TREM2 H157Y and its possible associations with cognitive performance and disease‐associated endophenotypes. A, Sanger validation of the TREM2 H157Y variant (rs2234255). Upper and lower panels show the sequencing results obtained from TREM2 H157Y noncarriers (GG) and carriers (GA), respectively. Arrows indicate the TREM2 H157Y site. B, C, Associations between TREM2 H157Y and normalized MoCA score in (B) all participants (GA versus GG: T = −2.16, *P< 0.05) and (C) AD patients (GA versus GG: T = −1.41, P = 0.15). D, Plasma Aβ42/Aβ40 ratio in TREM2 H157Y noncarriers and carriers; GA versus GG: T = 2.12, *P < 0.05. E–G, Plasma biomarker levels in AD patients with or without TREM2 H157Y variants; GA versus GG: T = −4.53, 2.80, and 3.99 for (E) NOTCH 3, (F) IL‐2, and (G) CASP3, respectively (**P < 0.01, ***P < 0.001). B–G, Boxes indicate the 25th to 75th percentiles, and whiskers indicate the 10th and 90th percentiles; numbers indicate the numbers of individuals in the corresponding group. Aβ, amyloid beta; AD, Alzheimer's disease; MoCA, Montreal Cognitive Assessment.
4. DISCUSSION
This study is the first to comprehensively evaluate known AD genetic risk factors in the Hong Kong Chinese population, in which we assayed 48 genetic variants that associated with 36 genes that have been implicated in AD. The results reveal associations between AD and several loci including APOE and nearby regions as well as SORL1 rs11218343. The results also replicate the APOE‐ε4–independent AD risk effect of NECTIN2 rs6859 A allele, which was previously observed in our fine‐mapping study in the mainland Chinese population. 4 In addition, our meta‐analysis corroborates the AD protective effect of SORL1 rs11218343 C allele in multiple ethnic groups. Furthermore, by subjecting the assayed variants to the lasso regression model, seven common variants were selected to construct the PRS model, which can predict AD risk and cognitive status of individual in the Hong Kong Chinese population more accurately than the APOE genotype. Accordingly, the PRS is associated with the changes in brain volumetric data, as well as the levels of multiple plasma proteins (for instance, the Aβ42/Aβ40 ratio and the levels of Aβ42, NCAN, and OPN), which participated diverse biological functions. Of note, 5 TREM2 H157Y heterozygous carriers were identified in the present Hong Kong Chinese cohort, which could facilitate pathological studies of TREM2 in AD.
Similar to APOE ε4, SORL1 is associated with AD in multiple ethnic groups. 2 , 38 , 39 Corroborating previous genetics studies in other Asian populations, our results suggest that SORL1 rs11218343 C allele has a similar AD protective effect in the Hong Kong Chinese population. 39 Nevertheless, the contribution of a specific variant or gene to AD risk might vary among different populations. The most representative example is APOE, as the frequency and risk effect of the APOE ε4 allele differ across ethnic groups. 4 , 52 , 53 Furthermore, in the first SORL1 AD genetic study reported by Rogaeva et al., SORL1 rs3824968, which is in linkage disequilibrium with rs11218343 in a European population (R 2 = 0.617, D′ = 0.8), was found to be significantly associated with AD only in a European population (in both cohorts from the discovery and replication stage) and not in Hispanic or Arab populations. 54 Moreover, the risk effect of even a specific AD risk locus might be attributable to different genetic variants in different ethnic groups. For instance, the TREM2 R47H is largely absent from East Asian populations, whereas TREM2 H157Y is more prevalent in East Asian than European populations (data from gnomAD). 19 These lines of evidence suggest that ethnic background influences the genetic risks of certain diseases. Therefore, genetics studies in non‐European descent populations are urgently required to corroborate and extend the findings of the present study and provide a more comprehensive and context‐dependent understanding of AD.
Since being reported in 2013, TREM2 has become one of the key AD genetic risk factors, contributing to the dysregulation of the immune system in AD pathogenesis. 5 , 6 , 55 A meta‐analysis failed to identify significant association between H157Y and AD in Japanese and Korean populations. 56 , 57 , 58 However, it is shown that H157Y is significantly associated with AD in Han Chinese 7 as well as people of European descent (Alzheimer's Disease Sequencing Project, ADSP). 29 Notably, the allele frequency of H157Y would be higher in Chinese AD patients (0.53% and 0.40% in Hong Kong Chinese and mainland Chinese) compared to the AD patients from other East Asian populations (0.28% and 0.25%, for Japanese and Korean, accordingly). Hence, more data would be required to further understand the contribution of H157Y for AD risk in the Chinese population. Interestingly, the H175Y amino acid mutation is located at the ADAM10 protease cleavage site of TREM2 protein. Thus, this specific H157Y mutation might modulate the ADAM10‐mediated cleavage of TREM2, resulting in increased production of soluble TREM2. 59 , 60 , 61 The association between the plasma level of NOTCH3 (another ADAM10 substrate) 62 and the TREM2 H157Y genotype suggests that TREM2 H157Y carriers exhibit altered ADAM10 protease activity. Therefore, further investigation is required to clarify the roles of TREM2 and its H157Y disease‐associated variant in AD pathogenesis.
Although late‐onset AD is suggested to be heritable, there is no single known genetic variant that can adequately account for its pathogenesis. Previous AD genetics studies conducted in European‐descent populations demonstrate that PRS models can predict an individual's risk of AD. 11 , 12 , 13 However, such models cannot be directly applied to other ethnic groups because of variations in genetic background. Accordingly, the present study evaluated known AD‐associated genetic variants in the Hong Kong Chinese population, demonstrating that the PRS model based on this population can predict individuals’ AD risk and cognitive status. Interestingly, the performance of the proposed model in predicting AD risk was superior to that of the APOE genotype alone. More importantly, the poor performance of the proposed PRS model in the European‐descent AD dataset further implies the impacts of ethnic background on both genetics and PRS research related to diseases. Therefore, additional comprehensive genetic analyses of AD in the Chinese population are vital for identifying causal genetic factors of AD, which might improve our understanding of the disease's mechanisms and facilitate the development of genetic tools for assessing individual risk of AD in the Chinese population.
Notably, the limited number of samples and variants assayed in this study might limit the generalizability of the results. For instance, for SORL1 rs11218343, the present array dataset could only achieve a statistical power of 0.1624. Therefore, a replication study with a larger sample size is desirable. Meanwhile, rs11218343 is suggested to be associated with SORL1 transcript level in multiple tissues (C allele in nerve tissue: P = 0.000013, normalized effect size = 0.28; data from GTEx), 37 implying a potential biological impact on the modulation of SORL1 transcript levels. Therefore, it is important to investigate rs11218343 and other potential variants in the SORL1 locus for their underlying mechanisms in modifying the disease risk. Moreover, conducting the analyses with additional in‐house biomarker data further demonstrated the utility of the PRS model by showing its associations with AD‐related endophenotypes such as the plasma Aβ42/Aβ40 ratio, changes in brain volume, and specific PPI network and biological pathways. Hence, the present study also provides hints on how the aggregate effects of multiple genetic risk factors may modulate specific biological aspects in an individual. Thus, this study provides additional evidence supporting the systematic use of PRS models in clinical practice for both patient stratification and drug development.
CONFLICTS OF INTEREST
All authors declare no conflicts of interests.
Supporting information
Supporting information.
ACKNOWLEDGMENTS
Funding: We thank Pauline Kwan, Hazel Mok, Dr. Phillip Y. C. Chan, Choi Ying Ling, and Bonnie W. Wong for coordinating the collection of clinical data. We also thank Ka Chun Lok, Cara W. S. Kwong, Wayne C. W. Ng, Tomas M. S. Yip, Yan Ma, and Saijuan Liu for their excellent technical assistance as well as other members of the Ip Laboratory for many helpful discussions. This study was supported in part by the Research Grants Council of Hong Kong (the Theme‐Based Research Scheme [T13‐607/12R], and the Collaborative Research Fund [C6027‐19GF]), the National Key R&D Program of China (2017YFE0190000 and 2018YFE0203600), the Areas of Excellence Scheme of the University Grants Committee (AoE/M‐604/16), the Innovation and Technology Commission (ITCPD/17‐9 and MRP/042/18X), the Chow Tai Fook Charity Foundation (CTFCF18SC01), the Guangdong Provincial Key S&T Program (2018B030336001), and the Shenzhen Knowledge Innovation Program (JCYJ20180507183642005 and JCYJ20170413173717055).
For the National Institute on Aging–Late Onset Alzheimer's Disease Family Study (LOAD dataset), funding support for the “Genetic Consortium for Late Onset Alzheimer's Disease” was provided through the Division of Neuroscience, NIA. The Genetic Consortium for Late Onset Alzheimer's Disease includes a genome‐wide association study funded as part of the Division of Neuroscience, NIA. Finally, the Genetic Consortium for Late Onset Alzheimer's Disease provided assistance with phenotype harmonization and genotype cleaning as well as general study coordination. The Genotype‐Tissue Expression (GTEx) Project was supported by the Common Fund of the Office of the Director of the National Institutes of Health, and by NCI, NHGRI, NHLBI, NIDA, NIMH, and NINDS. The data used for the analyses described in this manuscript were obtained from the GTEx Portal on 06/17/2020.
Zhou X, Chen Y, Ip FCF, et al. Genetic and polygenic risk score analysis for Alzheimer's disease in the Chinese population. Alzheimer's Dement. 2020;12:e12074 10.1002/dad2.12074
REFERENCES
- 1. Gatz M, Reynolds CA, Fratiglioni L, et al. Role of genes and environments for explaining Alzheimer disease. Arch Gen Psychiatry 2006;63:168‐174. 10.1001/archpsyc.63.2.168. [DOI] [PubMed] [Google Scholar]
- 2. Lambert JC, Ibrahim‐Verbaas CA, Harold D, et al. Meta‐analysis of 74,046 individuals identifies 11 new susceptibility loci for Alzheimer's disease. Nat Genet 2013;45:1452‐1458. 10.1038/ng.2802. [DOI] [PMC free article] [PubMed] [Google Scholar]
- 3. Jansen IE, Savage JE, Watanabe K, et al. Genome‐wide meta‐analysis identifies new loci and functional pathways influencing Alzheimer's disease risk. Nat Genet 2019;51:404‐413. 10.1038/s41588-018-0311-9. [DOI] [PMC free article] [PubMed] [Google Scholar]
- 4. Zhou X, Chen Y, Mok KY, et al. Non‐coding variability at the APOE locus contributes to the Alzheimer's risk. Nat Commun 2019;10:3310 10.1038/s41467-019-10945-z. [DOI] [PMC free article] [PubMed] [Google Scholar]
- 5. Guerreiro R, Wojtas A, Bras J, et al. TREM2 variants in Alzheimer's disease. N Engl J Med 2013;368:117‐127. 10.1056/NEJMoa1211851. [DOI] [PMC free article] [PubMed] [Google Scholar]
- 6. Jonsson T, Stefansson H, Steinberg S, et al. Variant of TREM2 associated with the risk of Alzheimer's disease. N Engl J Med 2013;368:107‐116. 10.1056/NEJMoa1211103. [DOI] [PMC free article] [PubMed] [Google Scholar]
- 7. Jiang T, Tan L, Chen Q, et al. A rare coding variant in TREM2 increases risk for Alzheimer's disease in Han Chinese. Neurobiol Aging 2016;42:217.e1‐3. 10.1016/j.neurobiolaging.2016.02.023. [DOI] [PubMed] [Google Scholar]
- 8. Jiang T, Hou J‐K, Gao Q, et al. TREM2 p.H157Y variant and the risk of Alzheimer's disease: a meta‐analysis involving 14,510 subjects. Curr Neurovasc Res 2016;13:318‐320. 10.2174/1567202613666160808095530. [DOI] [PubMed] [Google Scholar]
- 9. Huang KL, Marcora E, Pimenova AA, et al. A common haplotype lowers PU.1 expression in myeloid cells and delays onset of Alzheimer's disease. Nat Neurosci 2017;20:1052‐1061. 10.1038/nn.4587. [DOI] [PMC free article] [PubMed] [Google Scholar]
- 10. Zhou X, Chen Y, Mok KY, et al. Identification of genetic risk factors in the Chinese population implicates a role of immune system in Alzheimer's disease pathogenesis. Proc Natl Acad Sci U S A 2018;115:1697‐1706. 10.1073/pnas.1715554115. [DOI] [PMC free article] [PubMed] [Google Scholar]
- 11. Cruchaga C, Del‐Aguila JL, Saef B, et al. Polygenic risk score of sporadic late‐onset Alzheimer's disease reveals a shared architecture with the familial and early‐onset forms. Alzheimers Dement 2018;14:205‐214. 10.1016/j.jalz.2017.08.013. [DOI] [PMC free article] [PubMed] [Google Scholar]
- 12. Chaudhury S, Patel T, Barber IS, et al. Polygenic risk score in postmortem diagnosed sporadic early‐onset Alzheimer's disease. Neurobiol Aging 2018;62:244.e1‐244.e8. 10.1016/j.neurobiolaging.2017.09.035. [DOI] [PMC free article] [PubMed] [Google Scholar]
- 13. Escott‐Price V, Myers A, Huentelman M, Shoai M, Hardy J. Polygenic risk score analysis of Alzheimer's disease in cases without APOE4 or APOE2 alleles. J Prev Alzheimers Dis 2019;6:16‐19. 10.14283/jpad.2018.46. [DOI] [PMC free article] [PubMed] [Google Scholar]
- 14. Farrer LA, Cupples LA, Haines JL, et al. Effects of age, sex, and ethnicity on the association between apolipoprotein E genotype and Alzheimer disease: a meta‐analysis. J Am Med Assoc 1997. 10.1001/jama.278.16.1349. [DOI] [PubMed] [Google Scholar]
- 15. Tang MX, Cross P, Andrews H, et al. Incidence of AD in African‐Americans, Caribbean Hispanics, and Caucasians in northern Manhattan. Neurology 2001;56:49‐56. 10.1212/WNL.56.1.49. [DOI] [PubMed] [Google Scholar]
- 16. Liu M, Bian C, Zhang J, Wen F. Apolipoprotein e gene polymorphism and Alzheimer's disease in Chinese population: a meta‐analysis. Sci Rep 2014;4:4383 10.1038/srep04383. [DOI] [PMC free article] [PubMed] [Google Scholar]
- 17. Wang P, Guo Q, Zhou Y, et al. Lack of association between triggering receptor expressed on myeloid cells 2 polymorphism rs75932628 and late‐onset Alzheimer's disease in a Chinese Han population. Psychiatr Genet 2018;28:16‐18. 10.1097/YPG.0000000000000188. [DOI] [PMC free article] [PubMed] [Google Scholar]
- 18. Song W, Hooli B, Mullin K, et al. Alzheimer's disease‐associated TREM2 variants exhibit either decreased or increased ligand‐dependent activation. Alzheimers Dement 2017;13:381‐387. 10.1016/j.jalz.2016.07.004. [DOI] [PMC free article] [PubMed] [Google Scholar]
- 19. Karczewski KJ, Francioli LC, Tiao G, et al. The mutational constraint spectrum quantified from variation in 141,456 humans. Nature 2020;581(7809):434–443. 10.1038/s41586-020-2308-7. [DOI] [PMC free article] [PubMed] [Google Scholar]
- 20. Boccardi V. Population ageing: The need for a care revolution in a world 2.0. Geriatr 2019;4:47 10.3390/geriatrics4030047. [DOI] [PMC free article] [PubMed] [Google Scholar]
- 21. Chen L, Baum L, Ng HK, et al. Apolipoprotein E promoter and α2‐macroglobulin polymorphisms are not genetically associated with Chinese late onset Alzheimer's disease. Neurosci Lett 1999;269:173‐177. 10.1016/S0304-3940(99)00421-8. [DOI] [PubMed] [Google Scholar]
- 22. Wang B, Bao S, Zhang Z, et al. A rare variant in MLKL confers susceptibility to ApoE ɛ4‐negative Alzheimer's disease in Hong Kong Chinese population. Neurobiol Aging 2018;68:160.e1‐160.e7. 10.1016/j.neurobiolaging.2018.03.006. [DOI] [PubMed] [Google Scholar]
- 23. Nasreddine ZS, Phillips NA, Bédirian V, et al. The Montreal Cognitive Assessment, MoCA: A brief screening tool for mild cognitive impairment. J Am Geriatr Soc 2005;53:695‐699. 10.1111/j.1532-5415.2005.53221.x. [DOI] [PubMed] [Google Scholar]
- 24. American Psychiatric Association . Diagnostic and Statistical Manual of Mental Disorders. 5th Edition (DSM‐5), Washington, DC: American Psychiatric Publishing, Inc.; 2013. 10.1176/appi.books.9780890425596. [DOI] [Google Scholar]
- 25. Yu CE, Seltman H, Peskind ER, et al. Comprehensive analysis of APOE and selected proximate markers for late‐onset Alzheimer's disease: Patterns of linkage disequilibrium and disease/marker association. Genomics 2007;89:655‐665. 10.1016/j.ygeno.2007.02.002. [DOI] [PMC free article] [PubMed] [Google Scholar]
- 26. Chapuis J, Hot D, Hansmannel F, et al. Transcriptomic and genetic studies identify IL‐33 as a candidate gene for Alzheimer's disease. Mol Psychiatry 2009;14:1004‐1016. 10.1038/mp.2009.10. [DOI] [PMC free article] [PubMed] [Google Scholar]
- 27. Yu J‐T, Song J‐H, Wang N‐D, et al. Implication of IL‐33 gene polymorphism in Chinese patients with Alzheimer's disease. Neurobiol Aging 2012;33:1014.e11‐1014.e14. 10.1016/j.neurobiolaging.2010.07.003. [DOI] [PubMed] [Google Scholar]
- 28. Ho J, Chen W, Chen M. Common genetic variation at the IL1RL1 locus regulates IL‐33 / ST2 signaling. J Clin Invest 2013;123:4208‐4218. 10.1172/JCI67119DS1. [DOI] [PMC free article] [PubMed] [Google Scholar]
- 29. Sims R, Van Der Lee SJ, Naj AC, et al. Rare coding variants in PLCG2, ABI3, and TREM2 implicate microglial‐mediated innate immunity in Alzheimer's disease. Nat Genet 2017;49:1373‐1384. 10.1038/ng.3916. [DOI] [PMC free article] [PubMed] [Google Scholar]
- 30. Koriath C, Kenny J, Adamson G, et al. Predictors for a dementia gene mutation based on gene‐panel next‐generation sequencing of a large dementia referral series. Mol Psychiatry 2018. 10.1038/s41380-018-0224-0. [DOI] [PMC free article] [PubMed] [Google Scholar]
- 31. Jia J, Xu E, Shao Y, Jia J, Sun Y, Li D. One novel presenilin‐1 gene mutation in a Chinese pedigree of familial Alzheimer's disease. J Alzheimers Dis 2005;7:119‐124. 10.3233/JAD-2005-7204. [DOI] [PubMed] [Google Scholar]
- 32. Hayashi S, Toyoshima Y, Hasegawa M, et al. Late‐onset frontotemporal dementia with a novel exon 1 (Arg5His) tau gene mutation. Ann Neurol 2002;51:525‐530. 10.1002/ana.10163. [DOI] [PubMed] [Google Scholar]
- 33. Che X‐Q, Zhao Q‐H, Huang Y, et al. Genetic features of MAPT, GRN, C9orf72 and CHCHD10 gene mutations in chinese patients with frontotemporal dementia. Curr Alzheimer Res 2017;14:1102‐1108. 10.2174/1567205014666170426105713. [DOI] [PubMed] [Google Scholar]
- 34. Gauderman WJ. Sample size requirements for matched case‐control studies of gene‐environment interaction. Stat Med 2002;21:35‐50. 10.1002/sim.973. [DOI] [PubMed] [Google Scholar]
- 35. Gauderman WJ. Sample size requirements for association studies of gene‐gene interaction. Am J Epidemiol 2002;155:478‐484. 10.1093/aje/155.5.478. [DOI] [PubMed] [Google Scholar]
- 36. Machiela MJ, Chanock SJ. LDlink: A web‐based application for exploring population‐specific haplotype structure and linking correlated alleles of possible functional variants. Bioinformatics 2015;31:3555‐3557. 10.1093/bioinformatics/btv402. [DOI] [PMC free article] [PubMed] [Google Scholar]
- 37. Gamazon ER, Segrè AV, Van De Bunt M, et al. Using an atlas of gene regulation across 44 human tissues to inform complex disease‐ and trait‐associated variation. Nat Genet 2018;50:956‐967. 10.1038/s41588-018-0154-4. [DOI] [PMC free article] [PubMed] [Google Scholar]
- 38. Naj AC, Jun G, Beecham GW, et al. Common variants at MS4A4/MS4A6E, CD2AP, CD33 and EPHA1 are associated with late‐onset Alzheimer's disease. Nat Genet 2011;43:436‐441. 10.1038/ng.801. [DOI] [PMC free article] [PubMed] [Google Scholar]
- 39. Miyashita A, Koike A, Jun G, et al. SORL1 is genetically associated with late‐onset Alzheimer's disease in Japanese, Koreans and Caucasians. PLoS One 2013;8:e58618 10.1371/journal.pone.0058618. [DOI] [PMC free article] [PubMed] [Google Scholar]
- 40. Ruiz A, Heilmann S, Becker T, et al. Follow‐up of loci from the International Genomics of Alzheimer's Disease Project identifies TRIP4 as a novel susceptibility gene. Transl Psychiatry 2014;4:e358 10.1038/tp.2014.2. [DOI] [PMC free article] [PubMed] [Google Scholar]
- 41. Jiao B, Liu X, Zhou L, et al. Polygenic analysis of late‐onset Alzheimer's disease from mainland China. PLoS One 2015;10:e0144898 10.1371/journal.pone.0144898. [DOI] [PMC free article] [PubMed] [Google Scholar]
- 42. Xiao Q, Liu ZJ, Tao S, et al. Risk prediction for sporadic Alzheimer's disease using genetic risk score in the Han Chinese population. Oncotarget 2015;6:36955‐36964. 10.18632/oncotarget.6271. [DOI] [PMC free article] [PubMed] [Google Scholar]
- 43. Zhang CC, Wang HF, Tan MS, et al. SORL1 is associated with the risk of late‐onset Alzheimer's disease: a replication study and meta‐analyses. Mol Neurobiol 2017;54:1725‐1732. 10.1007/s12035-016-9780-y. [DOI] [PubMed] [Google Scholar]
- 44. Kjeldsen EW, Tybjærg‐Hansen A, Nordestgaard BG, Frikke‐Schmidt R. ABCA7 and risk of dementia and vascular disease in the Danish population. Ann Clin Transl Neurol 2018;5:41‐51. 10.1002/acn3.506. [DOI] [PMC free article] [PubMed] [Google Scholar]
- 45. Moreno‐Grau S, Hernández I, Heilmann‐Heimbach S, et al. Genome‐wide significant risk factors on chromosome 19 and the APOE locus. Oncotarget 2018;9:24590‐24600. 10.18632/oncotarget.25083. [DOI] [PMC free article] [PubMed] [Google Scholar]
- 46. Talebi M, Delpak A, Khalaj‐kondori M, et al. ABCA7 and EphA1 genes polymorphisms in late‐onset Alzheimer's disease. J Mol Neurosci 2020;70:167‐173. 10.1007/s12031-019-01420-x. [DOI] [PubMed] [Google Scholar]
- 47. Han B, Eskin E. Random‐effects model aimed at discovering associations in meta‐analysis of genome‐wide association studies. Am J Hum Genet 2011;88:586‐598. 10.1016/j.ajhg.2011.04.014. [DOI] [PMC free article] [PubMed] [Google Scholar]
- 48. Mavaddat N, Michailidou K, Dennis J, et al. Polygenic risk scores for prediction of breast cancer and breast cancer subtypes. Am J Hum Genet 2019;104:21‐34. 10.1016/j.ajhg.2018.11.002. [DOI] [PMC free article] [PubMed] [Google Scholar]
- 49. Chasioti D, Yan J, Nho K, Saykin AJ. Progress in polygenic composite scores in Alzheimer's and other complex diseases. Trends Genet 2019;35:371‐382. 10.1016/j.tig.2019.02.005. [DOI] [PMC free article] [PubMed] [Google Scholar]
- 50. Szklarczyk D, Franceschini A, Wyder S, et al. STRING v10: protein‐protein interaction networks, integrated over the tree of life. Nucleic Acids Res 2015;43:D447‐D452. 10.1093/nar/gku1003. [DOI] [PMC free article] [PubMed] [Google Scholar]
- 51. Kang EY, Park Y, Li X, Segrè AV, Han B, Eskin E. ForestPMPlot: a flexible tool for visualizing heterogeneity between studies in meta‐analysis. G3 Genes, Genomes, Genet 2016;6:1793‐1798. 10.1534/g3.116.029439. [DOI] [PMC free article] [PubMed] [Google Scholar]
- 52. Rajabli F, Feliciano BE, Celis K, et al. Ancestral origin of ApoE ε4 Alzheimer disease risk in Puerto Rican and African American populations. PLoS Genet 2018;14:e1007791 10.1371/journal.pgen.1007791. [DOI] [PMC free article] [PubMed] [Google Scholar]
- 53. Blue EE, Horimoto ARVR, Mukherjee S, Wijsman EM, Thornton TA. Local ancestry at APOE modifies Alzheimer's disease risk in Caribbean Hispanics. Alzheimers Dement 2019;15:1524‐1532. 10.1016/j.jalz.2019.07.016. [DOI] [PMC free article] [PubMed] [Google Scholar]
- 54. Rogaeva E, Meng Y, Lee JH, et al. The neuronal sortilin‐related receptor SORL1 is genetically associated with Alzheimer disease. Nat Genet 2007;39:168‐177. 10.1038/ng1943. [DOI] [PMC free article] [PubMed] [Google Scholar]
- 55. Heneka MT, Carson MJ, Khoury JEl, et al. Neuroinflammation in Alzheimer's disease. Lancet Neurol 2015;14:388‐405. 10.1016/S1474-4422(15)70016-5. [DOI] [PMC free article] [PubMed] [Google Scholar]
- 56. Huang M, Wang D, Xu Z, et al. Lack of genetic association between TREM2 and Alzheimer's disease in East Asian population. Am J Alzheimers Dis Other Demen 2015;30:541‐546. 10.1177/1533317515577128. [DOI] [PMC free article] [PubMed] [Google Scholar]
- 57. Miyashita A, Wen Y, Kitamura N, et al. Lack of genetic association between TREM2 and late‐onset Alzheimer's disease in a Japanese population. J Alzheimers Dis 2014;41:1031‐1038. 10.3233/JAD-140225. [DOI] [PubMed] [Google Scholar]
- 58. Chung SJ, Kim MJ, Kim J, et al. Exome array study did not identify novel variants in Alzheimer's disease. Neurobiol Aging 2014;35:1958.e13‐1958.e14. 10.1016/j.neurobiolaging.2014.03.007. [DOI] [PubMed] [Google Scholar]
- 59. Schlepckow K, Kleinberger G, Fukumori A, et al. An Alzheimer‐associated TREM2 variant occurs at the ADAM cleavage site and affects shedding and phagocytic function. EMBO Mol Med 2017;9:1356‐1365. 10.15252/emmm.201707672. [DOI] [PMC free article] [PubMed] [Google Scholar]
- 60. Thornton P, Sevalle J, Deery MJ, et al. TREM 2 shedding by cleavage at the H157‐S158 bond is accelerated for the Alzheimer's disease‐associated H157Y variant . EMBO Mol Med 2017;9:1366‐1378. 10.15252/emmm.201707673. [DOI] [PMC free article] [PubMed] [Google Scholar]
- 61. Kleinberger G, Yamanishi Y, Suárez‐Calvet M, et al. TREM2 mutations implicated in neurodegeneration impair cell surface transport and phagocytosis. Sci Transl Med 2014;6:243ra86 10.1126/scitranslmed.3009093. [DOI] [PubMed] [Google Scholar]
- 62. Groot AJ, Habets R, Yahyanejad S, et al. Regulated proteolysis of NOTCH2 and NOTCH3 receptors by ADAM10 and presenilins. Mol Cell Biol 2014;34:2822‐2832. 10.1128/mcb.00206-14. [DOI] [PMC free article] [PubMed] [Google Scholar]
Associated Data
This section collects any data citations, data availability statements, or supplementary materials included in this article.
Supplementary Materials
Supporting information.