

Key Points
Question
Can long-term supplementation with vitamin D3 prevent depression in the general adult population?
Findings
In this randomized clinical trial that included 18 353 adults aged 50 years or older without depression or clinically relevant depressive symptoms at baseline, vitamin D3 supplementation compared with placebo did not result in statistically significant differences in the incidence and recurrence of depression or clinically relevant depressive symptoms (hazard ratio, 0.97) or for change in mood scores over a 5-year treatment period.
Meaning
These findings do not support the use of vitamin D3 in adults to prevent depression.
Abstract
Importance
Low levels of 25-hydroxyvitamin D have been associated with higher risk for depression later in life, but there have been few long-term, high-dose large-scale trials.
Objective
To test the effects of vitamin D3 supplementation on late-life depression risk and mood scores.
Design, Setting, and Participants
There were 18 353 men and women aged 50 years or older in the VITAL-DEP (Vitamin D and Omega-3 Trial-Depression Endpoint Prevention) ancillary study to VITAL, a randomized clinical trial of cardiovascular disease and cancer prevention among 25 871 adults in the US. There were 16 657 at risk for incident depression (ie, no depression history) and 1696 at risk for recurrent depression (ie, depression history but no treatment for depression within the past 2 years). Randomization occurred from November 2011 through March 2014; randomized treatment ended on December 31, 2017, and this was the final date of follow-up.
Intervention
Randomized assignment in a 2 × 2 factorial design to vitamin D3 (2000 IU/d of cholecalciferol) and fish oil or placebo; 9181 were randomized to vitamin D3 and 9172 were randomized to matching placebo.
Main Outcomes and Measures
The primary outcomes were the risk of depression or clinically relevant depressive symptoms (total of incident and recurrent cases) and the mean difference in mood scores (8-item Patient Health Questionnaire depression scale [PHQ-8]; score range, 0 points [least symptoms] to 24 points [most symptoms]; the minimal clinically important difference for change in scores was 0.5 points).
Results
Among the 18 353 randomized participants (mean age, 67.5 [SD, 7.1] years; 49.2% women), the median treatment duration was 5.3 years and 90.5% completed the trial (93.5% among those alive at the end of the trial). Risk of depression or clinically relevant depressive symptoms was not significantly different between the vitamin D3 group (609 depression or clinically relevant depressive symptom events; 12.9/1000 person-years) and the placebo group (625 depression or clinically relevant depressive symptom events; 13.3/1000 person-years) (hazard ratio, 0.97 [95% CI, 0.87 to 1.09]; P = .62); there were no significant differences between groups in depression incidence or recurrence. No significant differences were observed between treatment groups for change in mood scores over time; mean change in PHQ-8 score was not significantly different from zero (mean difference for change in mood scores, 0.01 points [95% CI, −0.04 to 0.05 points]).
Conclusions and Relevance
Among adults aged 50 years or older without clinically relevant depressive symptoms at baseline, treatment with vitamin D3 compared with placebo did not result in a statistically significant difference in the incidence and recurrence of depression or clinically relevant depressive symptoms or for change in mood scores over a median follow-up of 5.3 years. These findings do not support the use of vitamin D3 in adults to prevent depression.
Trial Registration
ClinicalTrials.gov Identifiers: NCT01169259 and NCT01696435
This randomized clinical trial compares the effects of vitamin D₃ supplementation vs placebo on depression risk and mood scores in men and women aged 50 years or older.
Introduction
Depression is a leading cause of disease burden and disability.1 Depression is often undertreated in older persons,2 who frequently experience residual symptoms even with treatment.3 Thus, late-life depression prevention is a public health priority.4 Observational data have shown associations between low levels of serum 25-hydroxyvitamin D and higher late-life depression risk5; and having a low level of 25-hydroxyvitamin D has been hypothesized to play a role in the etiology of seasonal affective disorder.6,7 However, within a framework for the prevention of mental disorders,8 it is uncertain whether supplementation with vitamin D3 would benefit all persons (universal prevention), or only those at high risk due to subclinical symptoms (indicated prevention) or due to depression risk factors (selective prevention).
Thirteen randomized clinical trials (RCTs) have examined the effects of vitamin D3 supplementation on depression or mood during middle age or later in life9,10,11,12,13 and all except one13 reported null findings. Only 4 RCTs studied a dose of vitamin D3 that was 800 IU/d or greater for a duration of 12 months or longer; these RCTs included older participants with subthreshold affective symptoms, low levels of 25-hydroxyvitamin D, or key depression risk factors and none of the RCTs found any significant effects from vitamin D3 supplementation. No study to date has been large enough to examine vitamin D3 supplementation for the universal prevention of depression because testing this hypothesis requires thousands of participants per treatment group.14
Vitamin D and Omega-3 Trial-Depression Endpoint Prevention (VITAL-DEP) was an ancillary study to the VITAL (Vitamin D and Omega-3 Trial) parent trial and tested the effects of high-dose daily vitamin D3 supplementation on 5-year depression outcomes among 18 353 middle aged and older adults without depression at baseline.15 The primary outcomes were the total risk of depression (total occurrence of both incident and recurrent cases) and the long-term trajectory of mood based on 6 annual assessments.
Methods
Trial Protocol
All participants provided written informed consent, and approvals for the parent VITAL trial and this study were obtained from the institutional review board of Brigham and Women’s Hospital. The VITAL study agents received Investigational New Drug Approval from the US Food and Drug Administration. An independent data and safety monitoring board regularly reviewed data on end points and adverse events. The study protocol and statistical analysis plan appear in Supplement 1.
Participants
The parent trial was a double-blind placebo-controlled RCT testing the effects of vitamin D3 and fish oil supplementation on the prevention of incident cancer and cardiovascular disease.16 In the parent trial, 25 871 men aged 50 years or older and women aged 55 years or older were randomized between November 2011 and March 2014 to receive vitamin D3 (2000 IU/d of cholecalciferol) and fish oil (Omacor; a 1 g/d capsule containing 840 mg of omega-3 fatty acids as 465 mg of eicosapentaenoic acid and 375 mg of docosahexaenoic acid) or matching placebos in a 2 × 2 factorial design. Randomization was computer-generated within sex, race, and 5-year age groups in block sizes of 8.
Baseline serum samples were collected in 16 956 participants. Achieving a racially and ethnically diverse sample was a goal in the parent trial given the higher prevalence of low levels of 25-hydroxyvitamin D among Black persons and darker-skinned persons. Participants self-reported race/ethnicity on the study questionnaire by selecting categorical responses for race and ethnicity. Additional details have been published.16
Exclusion Criteria
The exclusion criteria of the VITAL trial were: a history of cancer or cardiovascular disease; supplemental vitamin D3 intake greater than 800 IU/d; supplemental calcium intake greater than 1200 mg/d; fish oil supplementation; a history of kidney failure, hypercalcemia, hypoparathyroidism or hyperparathyroidism, cirrhosis, or granulomatous disease; being allergic to soy, fish, or other seafood; and a history of any other conditions precluding participation.
The following list contains the additional exclusion criteria for this ancillary study: presence of clinically relevant depressive symptoms (8-item Patient Health Questionnaire depression scale [PHQ-8] score ≥10 points); had core features of depression (anhedonia or dysphoric mood) for 2 or more weeks within the past 2 years; currently receiving treatment for depression; had alcohol or substance use disorder within the past year; and having schizophrenia or psychotic disorder, bipolar disorder, or another major psychiatric or neurological condition.15 After exclusions, there were 18 353 individuals who remained eligible (Figure 1).16
Figure 1. Flow of Participants in the VITAL-DEP Ancillary Study to the VITAL Trial.
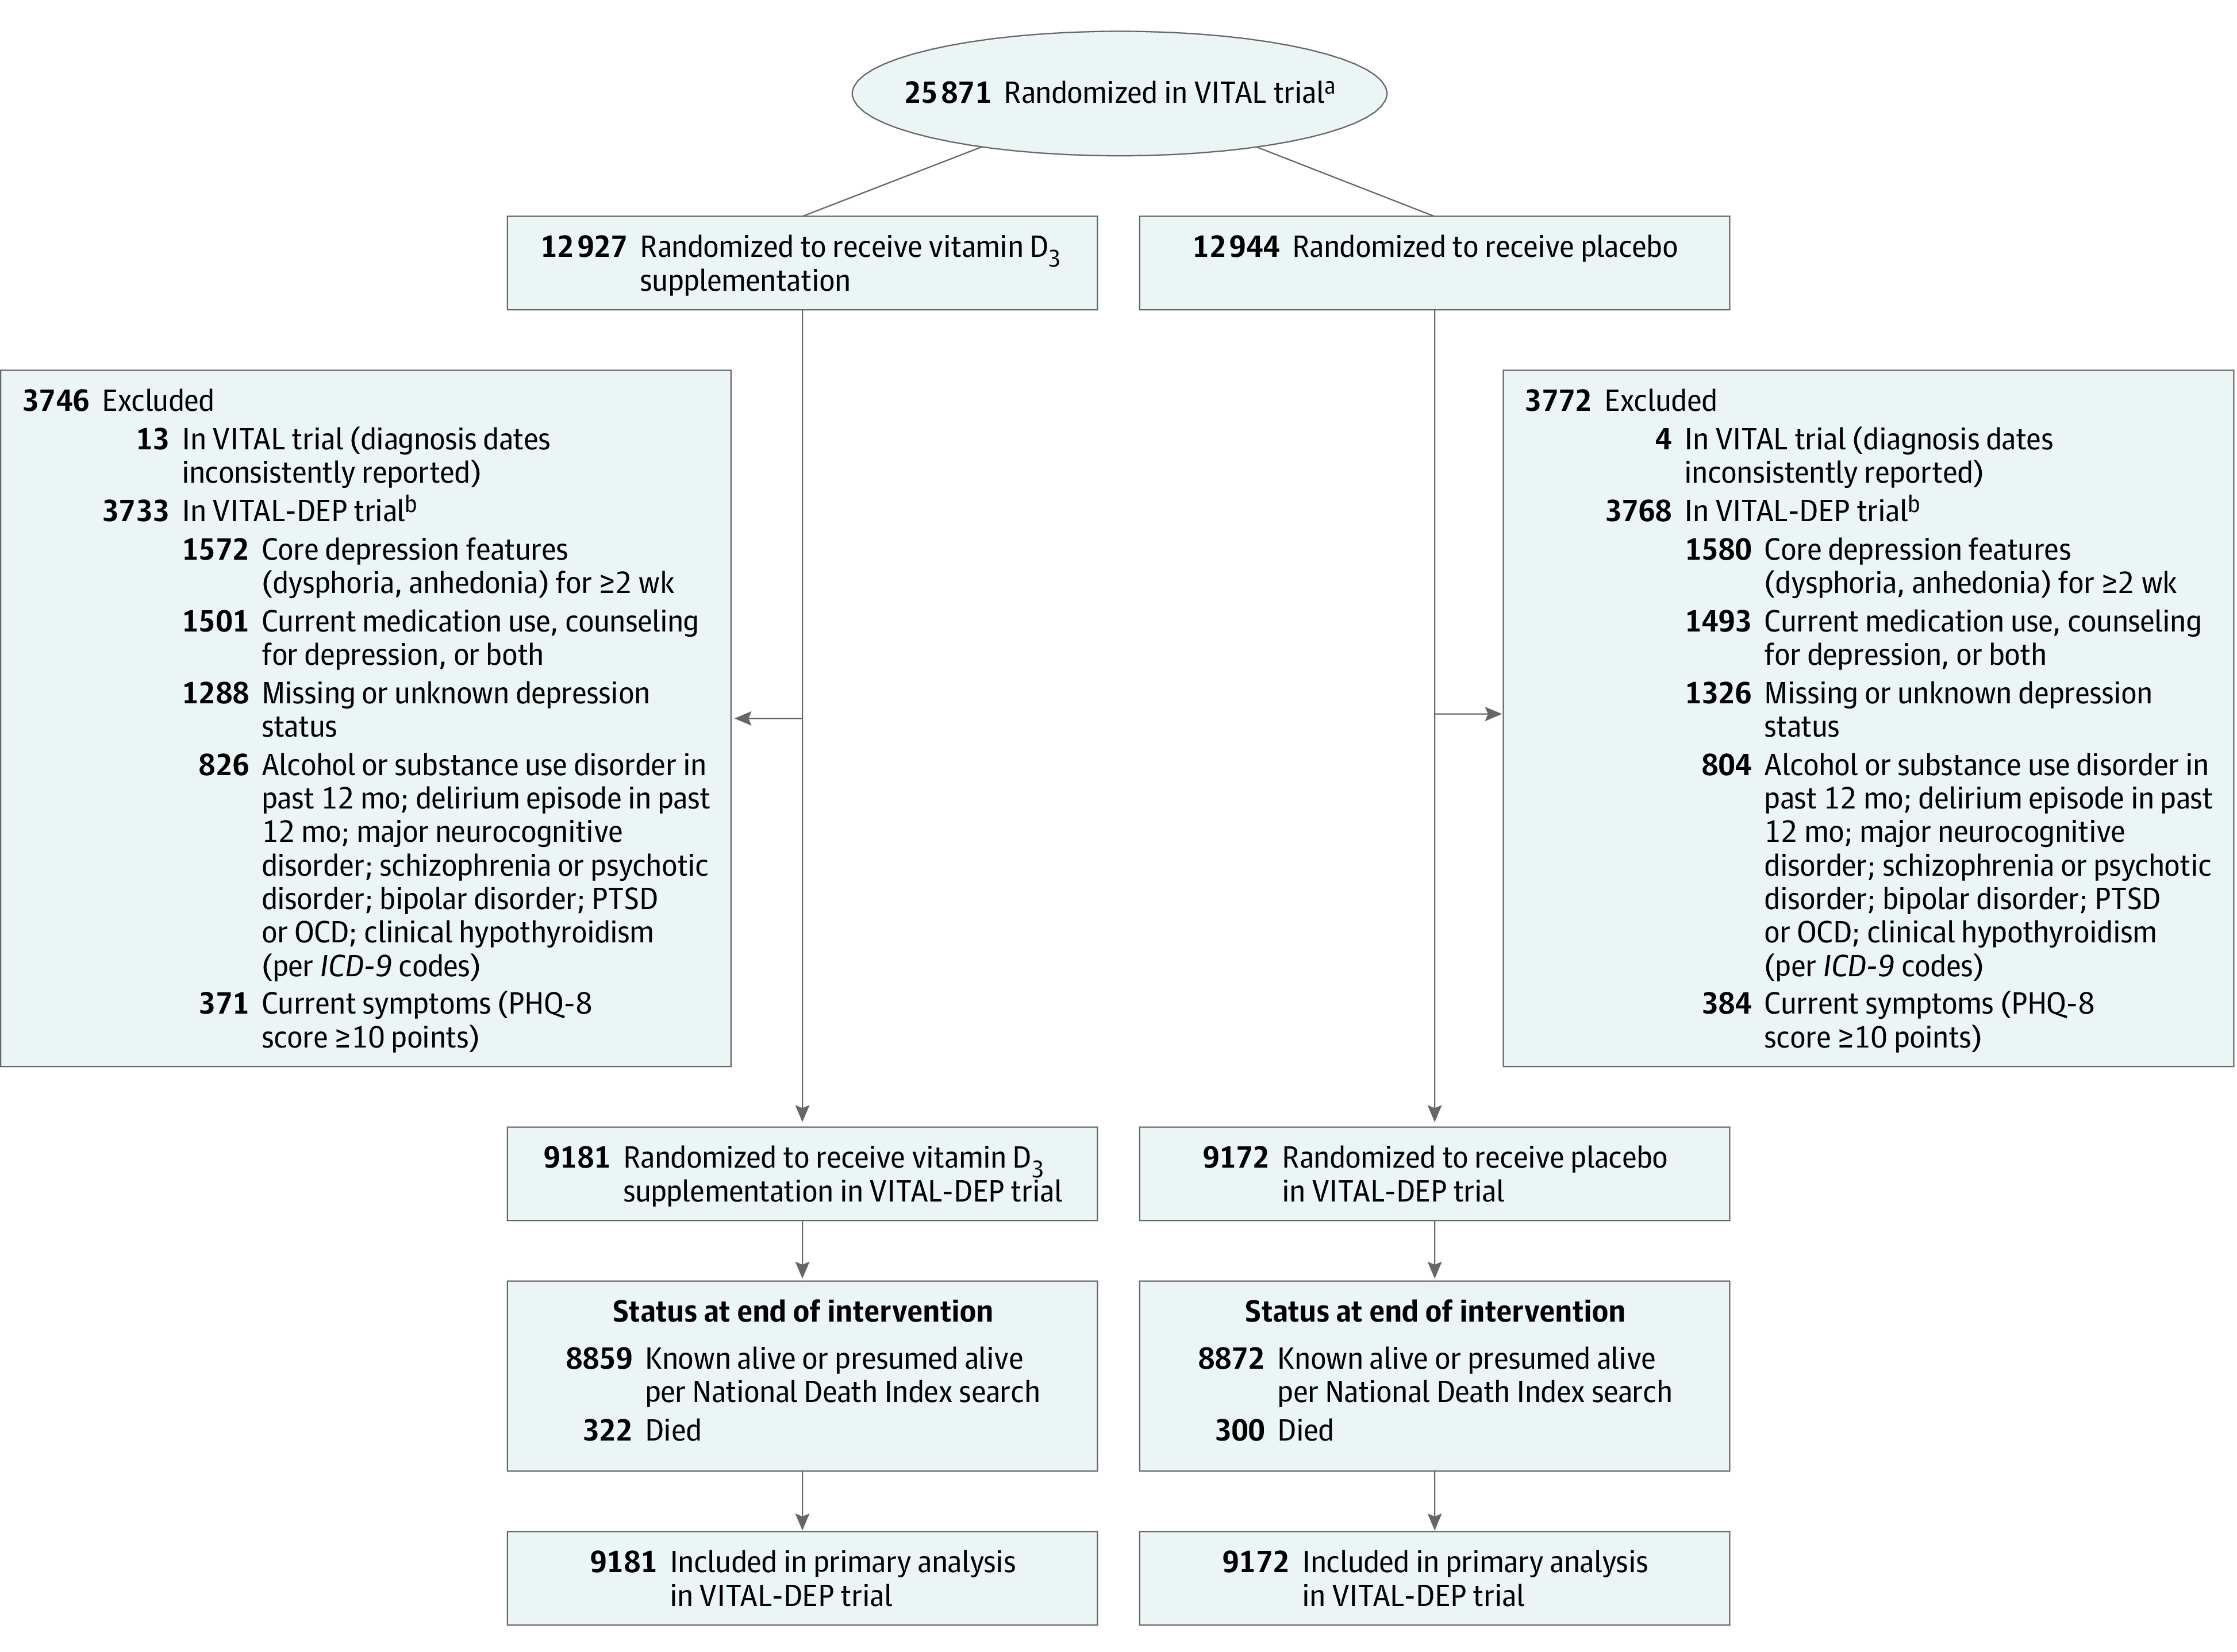
ICD-9 indicates International Classification of Diseases, Ninth Revision; OCD, obsessive-compulsive disorder; PHQ-8, 8-item Patient Health Questionnaire depression scale; PTSD, posttraumatic stress disorder; VITAL, Vitamin D and Omega-3 Trial; VITAL-DEP, Vitamin D and Omega-3 Trial-Depression Endpoint Prevention.
aThe flow diagram for the VITAL trial has been published.16
bIndividuals could have met more than 1 exclusion criteria.
Follow-up Procedures
Parent trial participants were followed up annually via mailed questionnaires to update information on major illnesses or adverse events, health and lifestyle factors, and study adherence. Follow-up continued until the end of randomized treatment on December 31, 2017, for a median treatment duration of 5.3 years (interquartile range, 5.0-5.7 years); total follow-up and study pill adherence rates (ie, taking at least two-thirds of pills as assigned) were high; serum levels of 25-hydroxyvitamin D before and after randomization were measured among a subset of participants and confirmed expected changes with vitamin D3 supplementation vs placebo.16 Participants randomized during the later years of the parent trial did not complete the maximum of 5 postbaseline annual questionnaires. The number of participants who received 5-year questionnaires was lower than for the earlier follow-up waves, but did not differ between treatment groups.
Outcomes
The 2 primary outcomes of this study were risk of depression or clinically relevant depressive symptoms and longitudinal mood scores. A depression event (defined as depression or clinically relevant depressive symptoms) was a new self-report of depression diagnosed by a physician or clinician, new treatment (medication, counseling, or both) for depression, or presence of clinically relevant depressive symptoms (PHQ-8 score ≥10 points) on annual questionnaires. This PHQ-8 cutoff has been validated for a major depressive episode17 and this definition of a depression event has yielded prevalence and incidence rates similar to those determined using structured, in-person methods.18
In-person psychiatric diagnostic interviews were also conducted and used for validation among a subset of 1054 participants at the Clinical and Translational Science Center (CTSC) in Boston, Massachusetts (Supplement 2). Incident cases arose from among those without current symptoms and without a history of clinically significant depressive symptoms, diagnosis of depression, or treatment for depression. Recurrent cases were defined as those with a history of depression, but currently without clinically relevant symptoms of depression and had not received treatment for depression within the past 2 years. No double counting of cases (incident cases that recurred during subsequent follow-up) was permitted.
Depression event dates were the questionnaire return date or month and year of diagnosis if separately reported by the participants. If participants could be classified by more than 1 method, the earlier date was used. An end points committee determined diagnosis and depression event dates for cases with conflicting reports. Safety procedures included sending letters to participants with elevated PHQ-8 scores (Supplement 2).15
Longitudinal mood scores were ascertained with the PHQ-8 on 6 annual questionnaires. The PHQ-8 score range is 0 points (least symptoms) to 24 points (most symptoms) and higher scores indicate worse mood. The minimal clinically important difference for change in PHQ-8 scores was 0.5 points based on clinical literature (Supplement 1). The primary aim as listed in the original protocol was to test the effects of vitamin D3 and fish oil (omega-3 fatty acids) compared with placebos on the primary outcomes (Supplement 1).
Other prespecified secondary aims were to determine the: (1) effects of vitamin D3 among Black adults; (2) effects of both agents for selective and indicated prevention in the CTSC subset; (3) associations between baseline biochemical levels of both nutrients and the primary outcomes; and (4) modification of the effects of each agent on the primary outcomes by: age, sex, baseline biochemical nutrient levels, baseline dietary intakes, baseline medical comorbidities, geographic region (for vitamin D3), physical activity level (for vitamin D3), and fish oil. The outcome results from the CTSC subset and for the effects of fish oil are not reported in this article.
Statistical Analyses
Primary Analyses
The study was designed to have power of 85% or greater to detect an observed hazard ratio (HR) of 0.85 for depression or clinically relevant depressive symptoms. Power was greater than 99% to detect the minimal clinically important difference for change in longitudinal mood scores. All 18 353 participant outcomes were analyzed according to their randomization groups. In examining the first primary outcome, risk of depression or clinically relevant depressive symptoms, participants were followed up until the occurrence of the end point, death, or the end of the trial, whichever came first. Cumulative incidence curves were used to compare the occurrence of depression or clinically relevant depressive symptoms in the vitamin D3 and placebo groups. Cox proportional hazards models were used to estimate HRs and 95% CIs for vitamin D3 vs placebo, adjusting for age, sex, and fish oil (the other randomized agent). The proportional hazards assumption was confirmed analytically using both the Kolmogorov-type supremum test and the time-dependent covariate model, which tested the significance of the treatment × log of follow-up time interaction.
In examining mood scores over time, general linear models of response profiles were used to estimate the means that were adjusted for the design variables and time was modeled as an indicator variable; this approach uses all available responses and can handle missing outcome data, which were assumed to be missing at random.19 Models estimated the mean differences in PHQ-8 scores at baseline and the mean differences for change in PHQ-8 scores after baseline; the mean difference between treatment groups for change in PHQ-8 scores was estimated using a time × treatment interaction. Models were fitted using the maximum likelihood and the correlations within participants were modeled using an unstructured covariance pattern; and statistical tests used the Wald test.19 Because results from the 2 primary outcomes could differ, we included plans to guide interpretation (see below and Supplement 1).
Secondary Analyses
First, incident and recurrent depression or clinically relevant depressive symptoms were addressed separately as secondary outcomes. Second, the prespecified secondary analyses addressed whether outcomes differed across subgroups selected a priori based on biological relevance or prior evidence of importance in depression risk and included: age, sex, race, baseline 25-hydroxyvitamin D level, Charlson Comorbidity Index, baseline vitamin D3 intake, physical activity, geographic region, and fish oil, given the plausible synergistic effects of vitamin D3 and fish oil.15 Third, a separate analysis addressed the potential influence of initiating treatment with antidepressants during follow-up on the observed effect of vitamin D3 on mood scores; this analysis did not apply to risk of depression or clinically relevant depressive symptoms because initiation of treatment with antidepressants was part of the depression event definition. Fourth, the analyses of the effects of vitamin D3 on risk of depression or clinically relevant depressive symptoms were repeated with censoring at nonadherence (ie, participant stopped taking at least two-thirds of vitamin D3 study pills or took outside supplements exceeding permitted amounts).
Nonprespecified and Post Hoc Analyses
First, body mass index (BMI; calculated as weight in kilograms divided by height in meters squared) was included in the subgroup analyses because the parent trial recently reported a significant interaction between supplemental vitamin D3 and BMI for cancer risk16 and because BMI has been associated with both 25-hydroxyvitamin D levels and depression risk.20,21
Second, because the effects of vitamin D3 on total PHQ-8 score may not reflect the effects on specific depressive features (eg, anhedonia, sadness, sleep difficulty, concentration problems), a post hoc analysis addressed the effects of vitamin D3 on item-level symptoms. Item-level symptom burden was denoted by report of experiencing the symptom “more than half the days” or “nearly every day” on the PHQ-8. The analyses were performed using repeated-measures logistic regression with binomial distribution, logit as the link function, and the exchangeable correlation structure to estimate the mean effect of vitamin D3 on change in likelihood of item-level symptom burden over the follow-up period.
Third, an alternative approach using repeated-measures negative binomial regression was considered for modeling the effect of vitamin D3 vs placebo on change in PHQ-8 scores, which tend to be skewed to the right. Fourth, post hoc sensitivity analyses addressed: the robustness of the findings with additional censoring at follow-up for the development of a cardiovascular disease or cancer end point; adjustment for cardiovascular disease and cancer as time-updated covariates; Fine-Gray analyses that treated death from any cause as a competing rather than censoring event22; repeating the response profiles analysis of mood scores with omission of PHQ-8 values from the year 5 follow-up questionnaire; and censoring PHQ-8 scores at receipt of a safety letter for elevated mood score.
Changes to the Study Protocol
Differences between the initial statistical analysis plan and the published protocol15 and this report are presented in detail in Supplement 2 (eMethods). The first change was made to ensure adequate sample size and robust minority participation; target enrollment in the parent trial was increased (from n = 20 000 to n = 26 000) and the minimum age for eligibility was modified from aged 60 years or older for men and aged 65 years or older for women to aged 50 years or older for men and aged 55 years or older for women. Second, Centers for Medicare & Medicaid Services data were not used to supplement depression follow-up information or to determine past 2-year psychiatric hospitalization at baseline because linkage was unavailable for nearly one-third of participants. Third, additional resources enabled 2 additional occasions for administration of the PHQ-8 and for an increased number of participants in whom baseline serum levels of 25-hydroxyvitamin D and fatty acids were assayed. Fourth, the effects of the fish oil and the results from the CTSC analysis are not reported in this article.
Statistical analyses were performed using SAS version 9.4 (SAS Institute Inc). Two-sided tests with an α level of .025 were used to account for the 2 primary outcomes. Because of the potential for type I error due to multiple comparisons, findings for the secondary analyses should be interpreted as exploratory.
Results
Baseline Characteristics
Among the 18 353 participants, 9181 were randomized to vitamin D3 and 9172 were randomized to placebo (Figure 1); 90.5% completed the trial (93.5% among those alive at the end of trial) with a median follow-up of 5.3 years. The baseline characteristics were well balanced between treatment groups (Table 1 and Supplement 2) and were similar to those among the 25 871 participants in the parent trial. The mean age of participants was 67.5 [SD, 7.1] years, women comprised 49% of the sample, and 27% were minorities, including 19% Black participants. The mean 25-hydroxyvitamin D level was 31.1 ng/mL and 11.6% of participants had levels lower than 20 mg/mL. Additional characteristics are provided in eTable 1 in Supplement 2. The percentages of those eligible for the depression incidence and recurrence analyses were similar by treatment group: 90.9% (8350/9181) and 9.1% (831/9181), respectively, in the vitamin D3 group and 90.6% (8307/9172) and 9.4% (865/9172) in the placebo group (Supplement 2).
Table 1. Characteristics of Participants at Baseline.
| Characteristic | No. (%) of participantsa | |
|---|---|---|
| Vitamin D3 (n = 9181) | Placebo (n = 9172) | |
| Age, mean (SD), y | 67.5 (7.0) | 67.4 (7.1) |
| Age group, y | ||
| 50-54 | 319 (3.5) | 333 (3.6) |
| 55-64 | 2967 (32.3) | 2998 (32.7) |
| 65-74 | 4630 (50.4) | 4601 (50.2) |
| ≥75 | 1265 (13.8) | 1240 (13.5) |
| Sex | ||
| Men | 4641 (50.6) | 4689 (51.1) |
| Women | 4540 (49.5) | 4483 (48.9) |
| Self-reported race/ethnicity | (n = 8999) | (n = 8990) |
| Non-Hispanic White | 6552 (72.8) | 6545 (72.8) |
| Black | 1705 (19.0) | 1702 (18.9) |
| Hispanic (not Black) | 362 (4.0) | 346 (3.9) |
| Asian/Pacific Islander | 144 (1.6) | 150 (1.7) |
| Native American/Alaskan Native | 78 (0.9) | 72 (0.8) |
| Otherb | 158 (1.8) | 175 (2.0) |
| Body mass indexc | (n = 8967) | (n = 8952) |
| <25 | 2914 (32.5) | 2929 (32.7) |
| 25-<30 | 3628 (40.5) | 3615 (40.4) |
| ≥30 | 2425 (27.0) | 2408 (26.9) |
| Charlson Comorbidity Index,d points | ||
| 0 | 7744 (84.4) | 7796 (85.0) |
| 1 | 1234 (13.4) | 1171 (12.8) |
| ≥2 | 203 (2.2) | 205 (2.2) |
| Serum 25-hydroxyvitamin D level, mean (SD), ng/mL | (n = 5739) | (n = 5678) |
| <20 | 630 (11.0) | 698 (12.3) |
| ≥20 | 5109 (89.0) | 4980 (87.7) |
| Supplemental vitamin D3 usee | 4076 (44.4) | 4054 (44.2) |
| Physical activity level, median (IQR), MET h/wk | 16.8 (5.5-32.7) | 17.0 (5.6-33.5) |
| Geographic region | (n = 9181) | (n = 9171) |
| Southeast | 2484 (27.1) | 2547 (27.8) |
| Northeast | 2528 (27.5) | 2475 (27.0) |
| West | 2139 (23.3) | 2149 (23.4) |
| Midwest | 2030 (22.1) | 2000 (21.8) |
| Randomization in VITAL-DEP trial | ||
| Fish oil | 4608 (50.2) | 4563 (49.8) |
| Fish oil placebo | 4573 (49.8) | 4609 (50.3) |
Abbreviations: IQR, interquartile range; MET, metabolic equivalent task; VITAL-DEP, Vitamin D and Omega-3 Trial-Depression Endpoint Prevention.
SI conversion factor: To convert 25-hydroxyvitamin D to nmol/L, multiply by 2.5.
Unless otherwise indicated. The percentages may not sum to 100 because of rounding.
Includes multiple or unspecified race/ethnicity.
Calculated as weight in kilograms divided by height in meters squared.
A weighted comorbidity score derived from the sum of the scores for each of several major medical comorbid conditions.
Restricted to 800 IU/d or less from all sources combined (individual supplements and multivitamins).
Primary Outcomes
There were 609 cases of depression or clinically relevant depressive symptoms (incident and recurrent) in the vitamin D3 group (12.9/1000 person-years) and 625 cases in the placebo group (13.3/1000 person-years). The adjusted HR was 0.97 (95% CI, 0.87 to 1.09; P = .62). Cumulative incidence curves showed lack of separation between treatment groups over the entire follow-up (Figure 2). The mean difference for change between treatment groups in PHQ-8 scores was not significantly different from 0 over the entire follow-up (0.01 points; 95% CI, −0.04 to 0.05 points) or at any time point during follow-up (Table 2 and Figure 3).
Figure 2. Cumulative Incidence Since Randomization Until Occurrence of Primary and Secondary Outcomes.
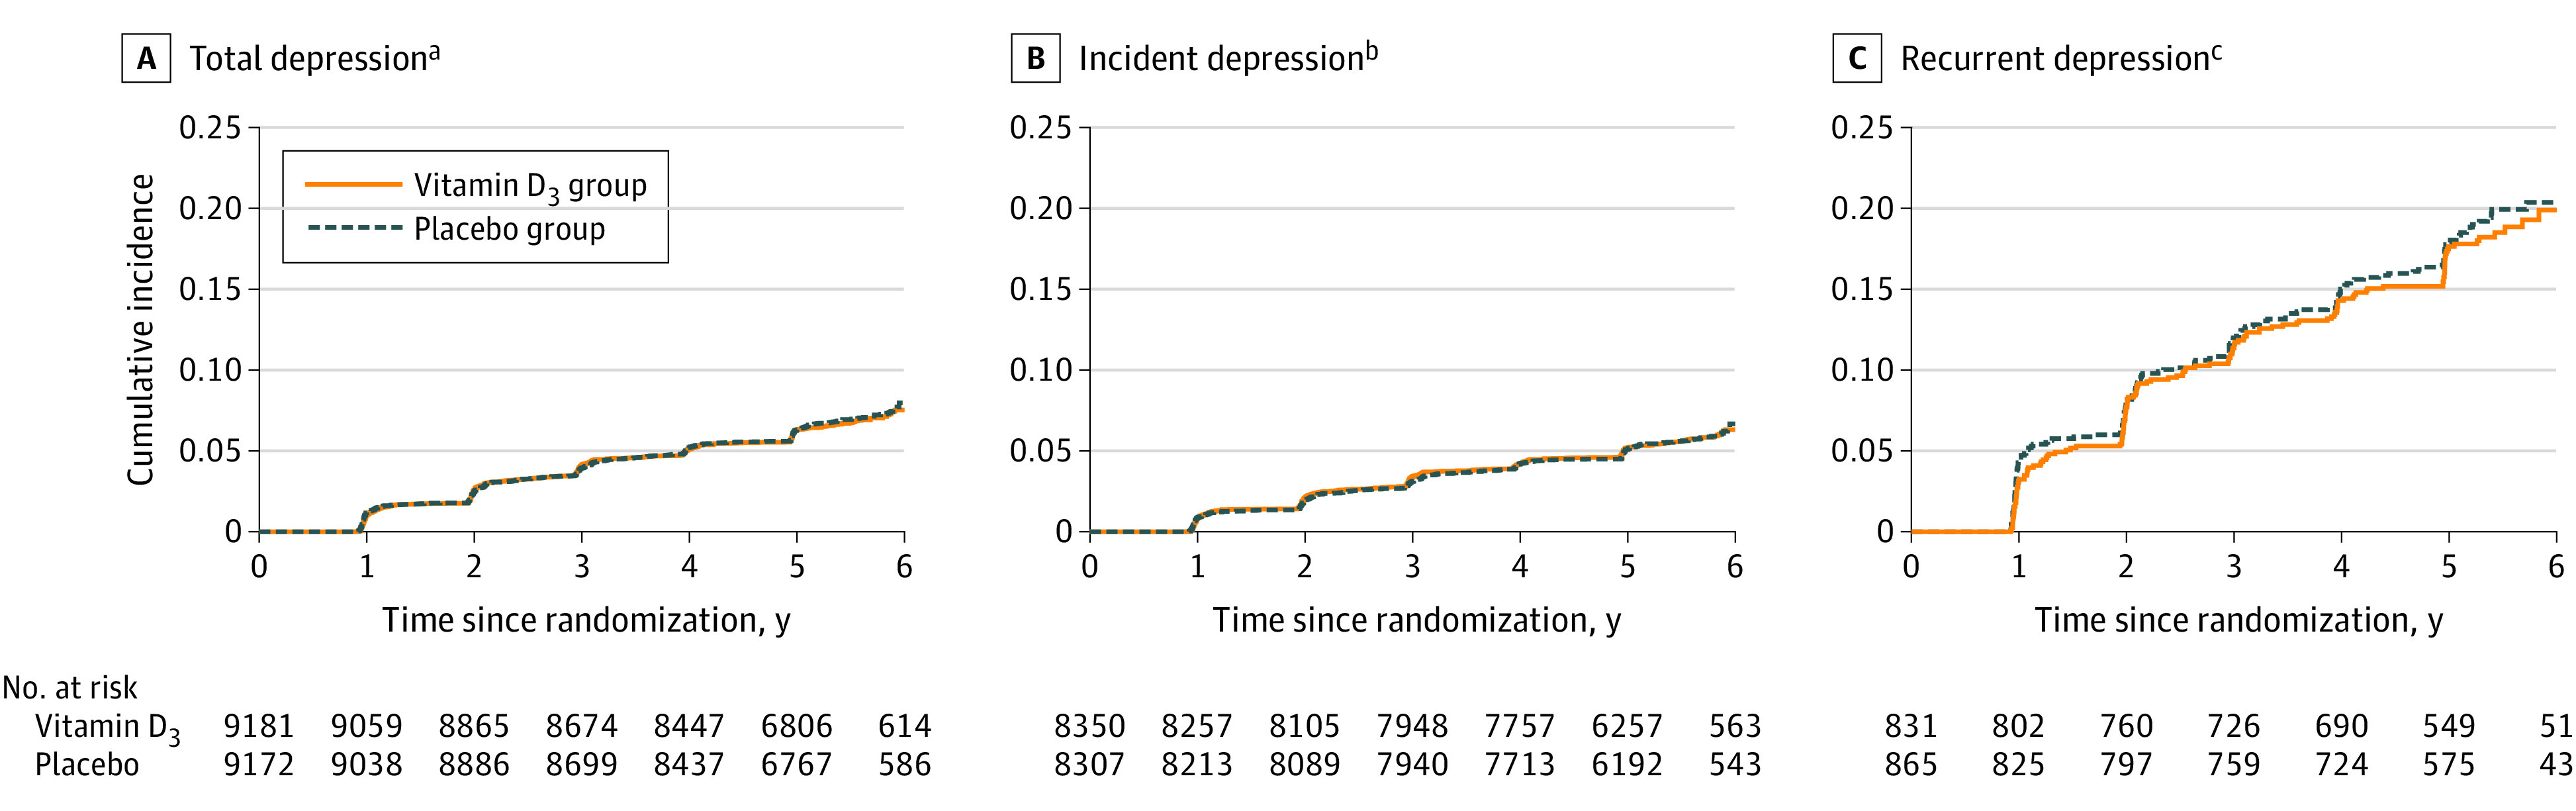
Panels B and C are provided to illustrate the cumulative incidence curves for incidence and recurrence separately from the total (panel A).
aSum of incidence and recurrence of depression or clinically relevant depressive symptoms. This is the primary outcome.
bAmong the 16 657 participants without a history of depression at baseline. This is a secondary outcome.
cAmong the 1696 participants with a history of depression at baseline who were not receiving treatment within the past 2 years. This is a secondary outcome.
Table 2. Adjusted Mean Scores for the 8-Item Patient Health Questionnaire Depression Scale (PHQ-8) at Each Year Since Randomization Compared With Baseline.
| Vitamin D3 | Placebo | Between-group difference for mean change in PHQ-8 score (95% CI)b | P value | P for interactionc | |||
|---|---|---|---|---|---|---|---|
| No. of participants | Adjusted mean PHQ-8 score (95% CI)a | No. of participants | Adjusted mean PHQ-8 score (95% CI)a | ||||
| At baseline | 9181 | 1.08 (1.05 to 1.11) | 9172 | 1.13 (1.09 to 1.16) | |||
| 1 y vs baseline | 8534 | 0.03 (−0.01 to 0.07) | 8486 | 0.03 (0 to 0.07) | −0.01 (−0.06 to 0.05) | .84 | .71 |
| 2 y vs baseline | 8381 | 0.07 (0.03 to 0.11) | 8344 | 0.04 (0 to 0.08) | 0.03 (−0.03 to 0.08) | .35 | |
| 3 y vs baseline | 8176 | 0.09 (0.05 to 0.13) | 8112 | 0.07 (0.03 to 0.12) | 0.01 (−0.04 to 0.07) | .63 | |
| 4 y vs baseline | 7763 | 0.06 (0.02 to 0.10) | 7603 | 0.07 (0.03 to 0.11) | −0.01 (−0.07 to 0.05) | .73 | |
| 5 y vs baseline | 5316 | 0.20 (0.15 to 0.25) | 5231 | 0.16 (0.11 to 0.22) | 0.03 (−0.04 to 0.10) | .40 | |
| Overall | 9181 | 9172 | 0.01 (−0.04 to 0.05)d | .72 | |||
From general linear models of response profiles to estimate the means, with time modeled as indicator variables; models were controlled for age, sex, and fish oil randomization group. The repeated-measures model used all available responses and can handle missing outcome data, which were assumed to be missing at random.
From the repeated-measures model (primary outcome).
Calculated using 5 degrees of freedom for the treatment × time interaction term in the model.
Averaged across all follow-up years (1-5 years) from the repeated-measures model; all participants contributed data to the repeated-measures analysis at 1 or more times.
Figure 3. Box Plots of Crude Scores for the 8-Item Patient Health Questionnaire Depression Scale (PHQ-8) During Each Study Year.

Secondary Outcomes
There were 459 incident depression cases in the vitamin D3 group (10.7/1000 person-years) and 461 incident depression cases in the placebo group (10.8/1000 person-years); there were 150 recurrent depression cases in the vitamin D3 group (37.6/1000 person-years) and 164 recurrent depression cases in the placebo group (39.3/1000 person-years). There were no significant differences between groups in risk of incident (HR, 0.99; 95% CI, 0.87-1.13) or recurrent (HR, 0.95; 95% CI, 0.76-1.19) depression or clinically relevant depressive symptoms (Figure 4). There were no significant differences in the effects of vitamin D3 on risk of depression or clinically relevant depressive symptoms among subgroups (Figure 4), including the fish oil group vs the fish oil placebo group; tests of interaction were not significant. There were also no significant variations by subgroups in the effect of vitamin D3 on mean differences for change in mood scores (eTable 2 in Supplement 2). Adherence with study pills was 90% or greater in both treatment groups at all assessments (Supplement 2). Findings from the sensitivity analyses were consistent with the primary analyses. There were no significant differences between treatment groups in the models for change in mood scores with censoring at initiation of antidepressants or with censoring at study pill adherence of less than two-thirds (eTables 3-5 in Supplement 2).
Figure 4. Primary, Secondary, and Nonprespecified and Post Hoc Outcomes.
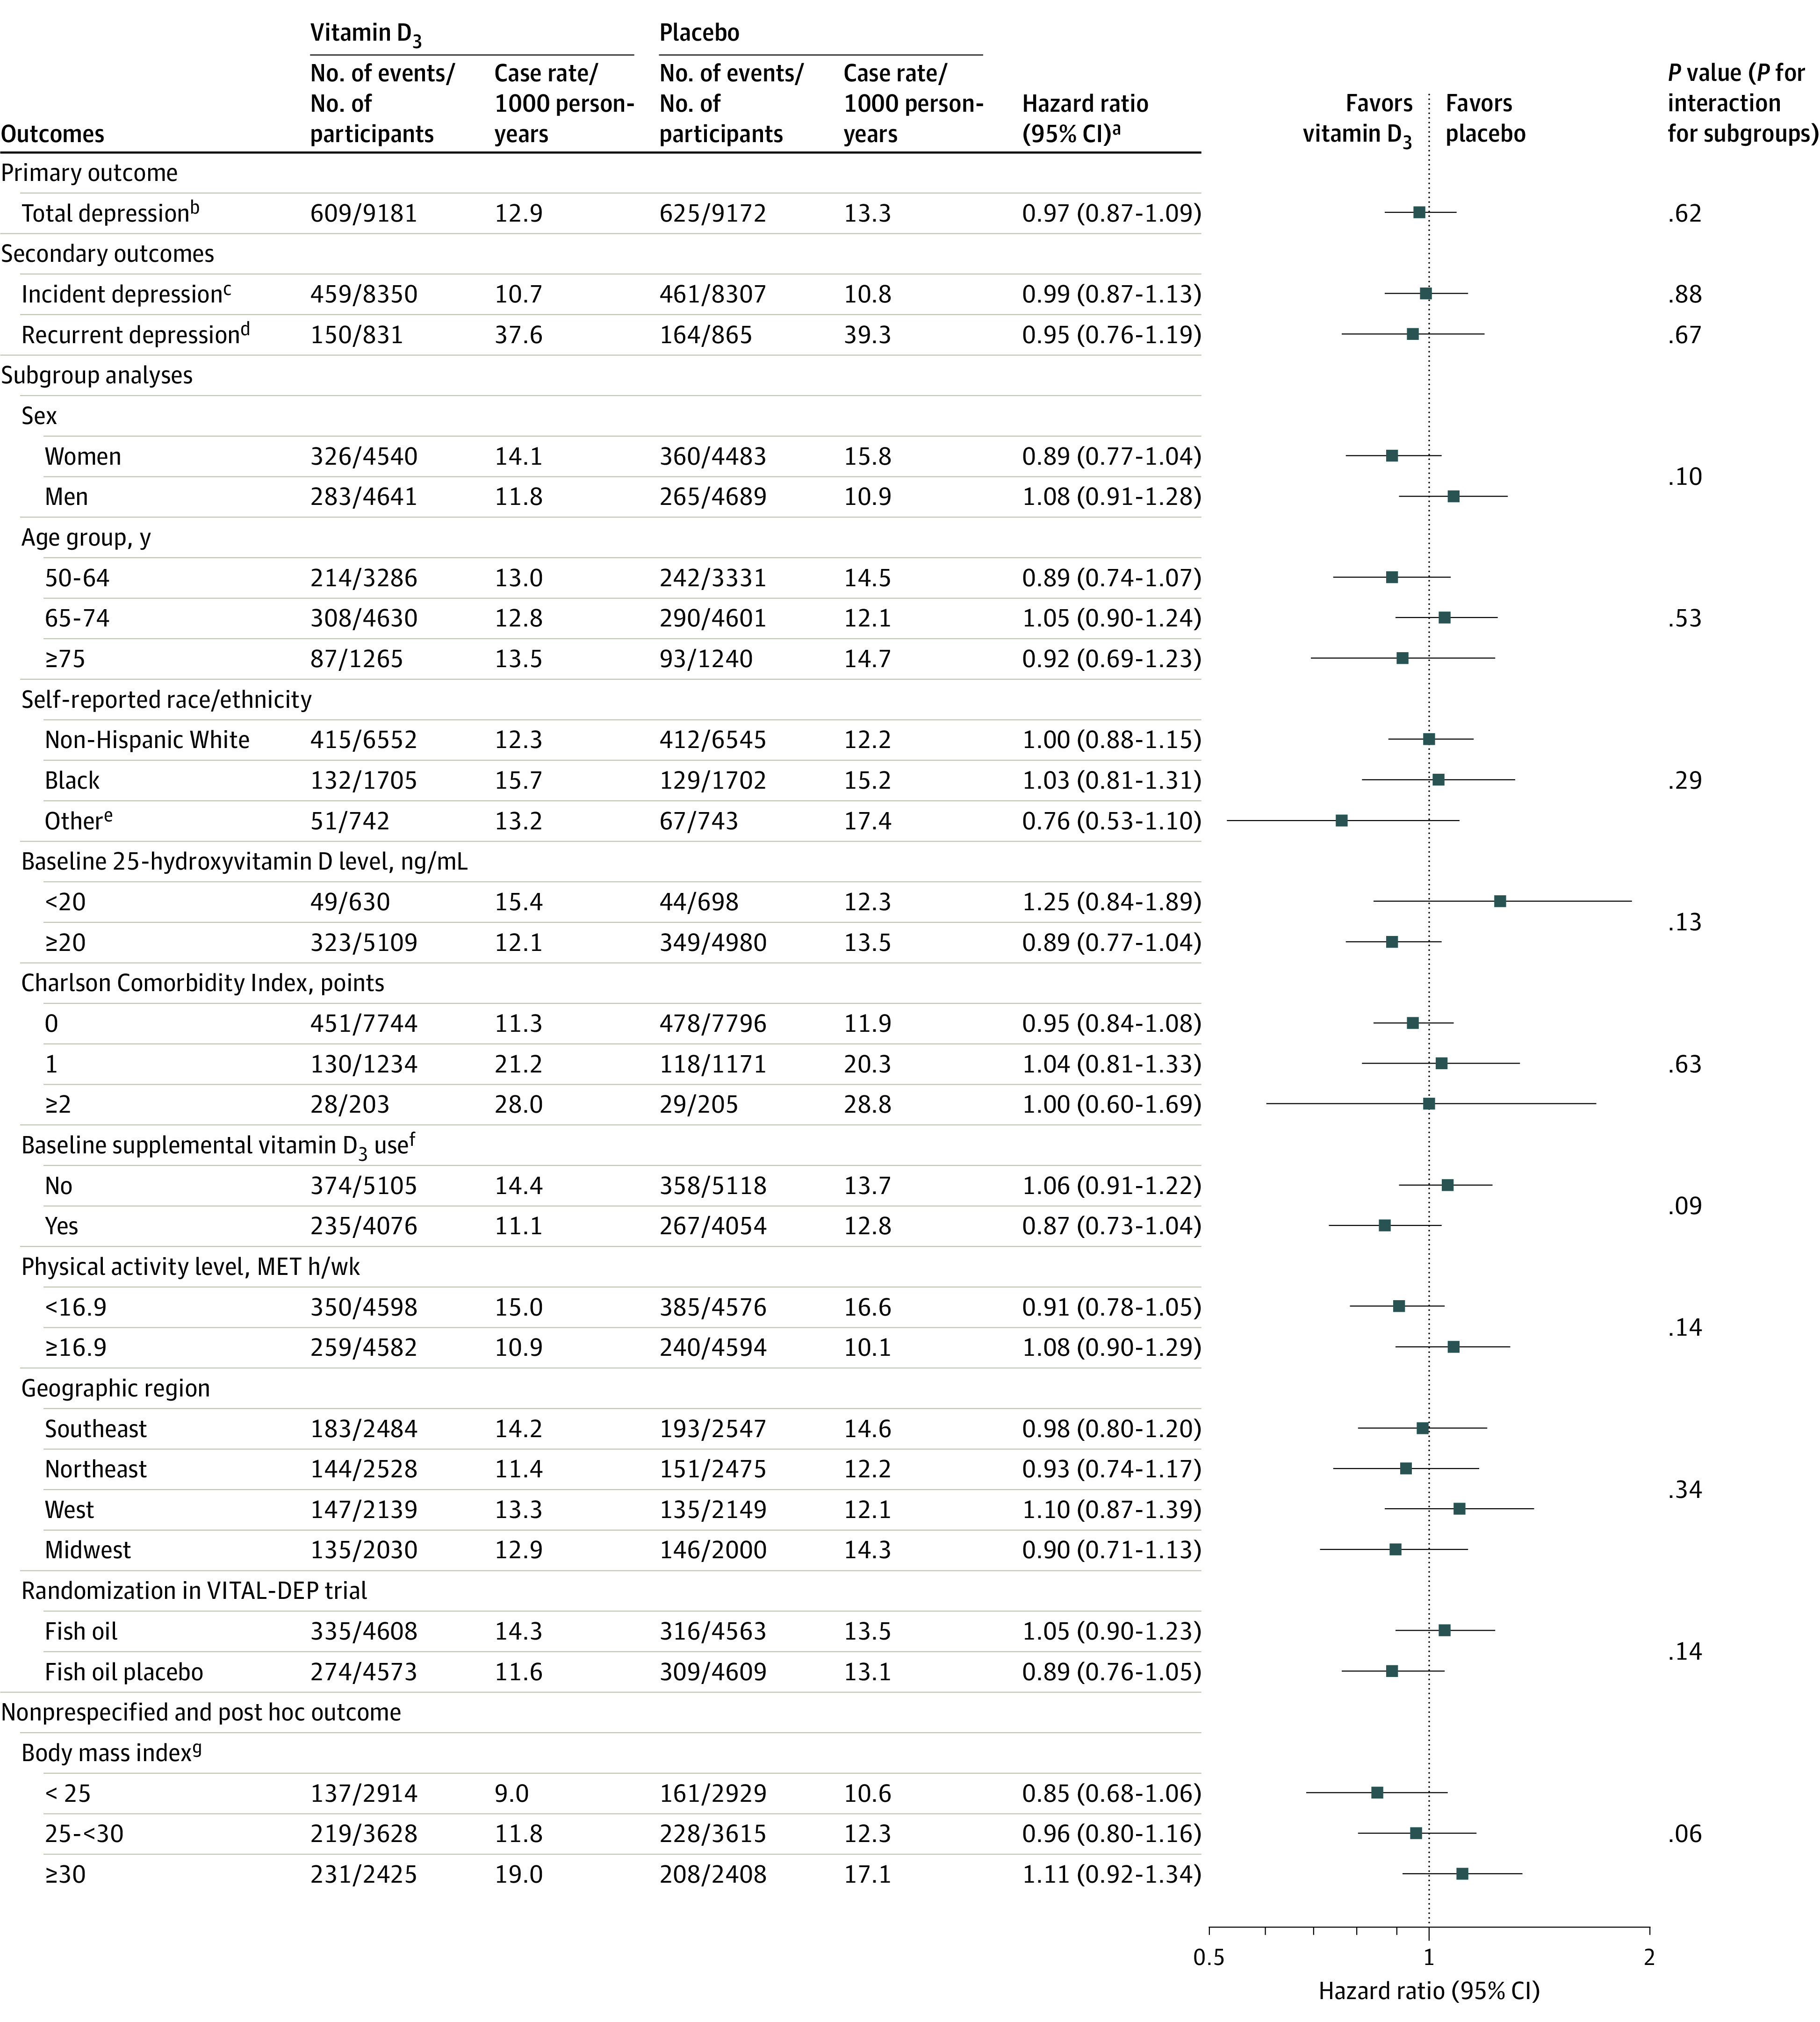
To convert 25-hydroxyvitamin D to nmol/L, multiply by 2.5. The analyses were not adjusted for multiple comparisons. MET indicates metabolic equivalent task; VITAL-DEP, Vitamin D and Omega-3 Trial-Depression Endpoint Prevention.
aCalculated using Cox regression models that were controlled for age, sex, and fish oil group. For the subgroup analyses, the interactions were tested using multiplicative interaction terms.
bSum of incidence and recurrence of depression or clinically relevant depressive symptoms.
cAmong the 16 657 participants without a history of depression at baseline.
dAmong the 1696 participants with a history of depression at baseline who were not receiving treatment within the past 2 years.
eIncludes Hispanic, Asian/Pacific Islander, Native American/Alaskan Native, and other or multiple or unspecified race/ethnicity.
fRestricted to 800 IU/d or less from all sources combined (individual supplements and multivitamins).
gCalculated as weight in kilograms divided by height in meters squared.
Nonprespecified and Post Hoc Outcomes
There were no significant differences in risk of depression or clinically relevant depressive symptoms with censoring at the development of cardiovascular disease or cancer, when adjusting for cardiovascular disease or cancer as time-varying covariates, or when using Fine-Gray competing risk models (eTables 6-8 in Supplement 2). The repeated-measures negative binomial regression models identified no significant difference between groups for change in mood scores (eTable 9 in Supplement 2). Additional results and findings from nonprespecified and post hoc analyses appear in eTables 10-15 and in the eFigure in Supplement 2.
Discussion
In this study of 18 353 adults aged 50 years or older without depression or clinically relevant depressive symptoms at baseline, treatment with vitamin D3 compared with placebo did not result in a statistically significant difference in the incidence and recurrence of depression or clinically relevant depressive symptoms or for change in mood scores over a median follow-up of 5.3 years. The findings do not support a role for supplemental vitamin D3 in depression prevention among adults.
The null results from this study contrasted with favorable results from observational studies. For example, a recent meta-analysis5 indicated each 10-ng/mL increment in serum level of 25-hydroxyvitamin D was associated with a pooled HR of 0.88 (95% CI, 0.78-0.99) for depression (defined as a clinical diagnosis or presence of symptoms above a validated cutoff on a rating scale) among 16 287 adults aged 50 years or older (1157 cases). Among 11 417 adults (765 cases) with data on 25-hydroxyvitamin D levels in this study, there was no statistically significant association of a low level of 25-hydroxyvitamin D (<20 ng/mL) or a continuous level with risk of depression or clinically relevant depressive symptoms (eTables 14a-14b in Supplement 2); however, power in this post hoc analysis to detect modest effects (eg, HR reductions of 10%-15%) was limited. In these post hoc analyses, although 25-hydroxyvitamin D levels were significantly associated with initial mood scores, there were no significant associations between baseline levels of 25-hydroxyvitamin D and subsequent changes in mood scores (eTable 14c in Supplement 2). Even though higher levels of 25-hydroxyvitamin D have been associated with better mood outcomes in observational designs, we did not observe better outcomes with vitamin D3 supplementation in a rigorous experimental setting. The results from this study were consistent with evidence of lack of benefit in smaller-scale shorter-term trials.9,10,11 However, most prior studies did not address depression risk as a primary outcome or use validated depression measures. Nevertheless, even among RCTs that featured doses of 800 IU/d or greater of vitamin D3 and 12 months or longer of treatment, no benefits were observed for late-life mental health or well-being measures.9,10,23 A recent RCT that included 1025 middle-aged and older adults at high-risk for depression randomized to 12-month supplementation with a multinutrient agent (containing 800 IU/d of vitamin D3) vs placebo found no evidence that supplementation affected risk of major depressive disorder.9 In addition, meta-analyses of gene variants24,25 associated with serum 25-hydroxyvitamin D concentrations and depression risk in mendelian randomization studies showed no association. Thus, confounding likely played a major role in reported associations in observational studies, and other factors correlated with serum 25-hydroxyvitamin D levels may underlie apparent associations with depression risk.
Strengths of this study included: a large general population-derived national sample with high racial/ethnic diversity; a high-dose vitamin D3 supplement taken daily; long duration of double-blind randomized treatment; high follow-up and adherence rates; covariate data for addressing key subgroups; availability of nutrient biomarkers; a local subcohort with in-person psychiatric examinations; and careful consideration of safety issues in a large-scale study. Furthermore, this study was innovative in conducting a test of universal prevention.
Limitations
This study has several limitations. First, PHQ-8 scores were ascertained only annually, and self-reported mood and depression variables were of uncertain validity. However, misclassification based on self-report should not have differed between treatment groups, and validity checks supported case ascertainment (eTable 6 and eTable 12 in Supplement 2).
Second, baseline 25-hydroxyvitamin D levels were generally adequate, which limits the generalizability for universal prevention. Although substantial increases in 25-hydroxyvitamin D were attained in the parent trial, the mean baseline 25-hydroxyvitamin D level was 30.8 ng/mL; this value is already at a threshold for extraskeletal health benefits, and so the ability to observe effects of vitamin D3 supplementation may have been attenuated.16 Large-scale studies would be required to address the effects of high-dose, long-term vitamin D3 supplementation among those with nutrient deficiency. The use of alternative biochemical vitamin D measures may better address possible racial/ethnic variation.26 Third, this study may have been underpowered to detect subgroup differences.
Fourth, by design, this study did not include all originally randomized parent trial participants; and although the treatment groups were balanced at baseline on all measured factors, there was less protection against potential confounding by unmeasured factors.
Fifth, due to eligibility requirements in the parent trial, results are not generalizable to children or younger adults. Sixth, the PHQ-8 score does not characterize suicidality so the effect of vitamin D3 on suicidality could not be determined. As expected, suicide was a rare event (3 suicide deaths).
Conclusions
Among adults aged 50 years or older without clinically relevant depressive symptoms at baseline, treatment with vitamin D3 compared with placebo did not result in a statistically significant difference in the incidence and recurrence of depression or clinically relevant depressive symptoms or for change in mood scores over a median follow-up of 5.3 years. These findings do not support the use of vitamin D3 in adults to prevent depression.
Trial protocol and statistical analysis plan
eTable 1. Detailed Baseline Characteristics of Participants, According to Randomized Vitamin D3 and Placebo Groups
eTable 2. Mean Difference in Change Since Baseline in PHQ-8 Score Comparing Vitamin D3 and Placebo Groups, According to Baseline Subgroups
Description of Results. From Sub-Group Analyses in Figure 3 and eTable 2
eTable 3. Adjusted Means at Baseline and Mean Change (95% CI) in PHQ-8 Scores at Each Year Since Randomization Compared to Baseline, according to Vitamin D3 and Placebo Groups, Censoring PHQ-8 Scores after Initiation of Antidepressants
eTable 4. Participant-Reported Adherence with the Vitamin D3 and Placebo Study Pills (% of Pills Taken) for All Time Points, among Participants Responding to Compliance Questionnaires
eTable 5. Hazard Ratios (HR) and 95% Confidence Intervals (CI) for the Primary and Secondary Outcomes, According to Randomized Assignment to Vitamin D3 or Placebo, with Additional Censoring at Time Taking Less than 2/3 Study Pills or Taking >800 IU/d of Outside (Non-study) Vitamin D
eTable 6a. Hazard Ratios (HR) and 95% Confidence Intervals (CI) for the Primary and Secondary Outcomes, According to Randomized Assignment to Vitamin D3 or Placebo, with Additional Censoring at Incident CVD
eTable 6b. Hazard Ratios (HR) and 95% Confidence Intervals (CI) for the Primary and Secondary Outcomes, According to Randomized Assignment to Vitamin D3 or Placebo, with Additional Adjustment for CVD as a Time-Dependent Covariate
eTable 7a. Hazard Ratios (HR) and 95% Confidence Intervals (CI) for the Primary and Secondary Outcomes, According to Randomized Assignment to Vitamin D3 or Placebo, with Additional Censoring at Incident Cancer
eTable 7b. Hazard Ratios (HR) and 95% Confidence Intervals (CI) for the Primary and Secondary Outcomes, According to Randomized Assignment to Vitamin D3 or Placebo, with Additional Adjustment for Total Cancer as a Time-Dependent Covariate
Description of Results. From Sensitivity Analyses in eTable 6 and eTable 7
eTable 8. Subdistribution Hazard Models Comparing the Risk of Depression in the Vitamin D3 and Placebo Groups
eTable 9. Adjusted Differences in Change in PHQ-8 Scores Since Baseline, comparing Vitamin D3 to Placebo
eTable 10. Adjusted Means at Baseline and Mean Change (95% CI) in PHQ-8 Scores at Each Year Since Randomization Compared to Baseline, according to Vitamin D3 and Placebo Groups, Censoring PHQ-8 Scores at Date of Mood Safety Letter
Description of Results. From Sensitivity Analyses in eTable 10
eTable 11. Adjusted Means at Baseline and Mean Change (95% CI) in PHQ-8 Scores at Each Year Since Randomization Compared to Baseline, according to Vitamin D3 and Placebo Groups, Omitting Year 5 PHQ-8 Score
eTable 12. Sex-specific Total, Incident and Recurrent Rates of Depression, per 1000 Person-Years (p-y)
Description of Results. From eTable 12, Sex-Specific Depression Rates and Relation of Sex to Depression Risk
eTable 13. Total, Incident and Recurrent Rates of Depression, per 1000 Person-Years (p-y), by Vitamin D3 and Placebo Groups
eTable 14a. Association of Low Baseline 25(OH)D with Hazard Ratios and 95% Confidence Intervals for Primary Outcome (Total Depression)
eTable 14b. Association of Continuous Baseline 25(OH)D with Hazard Ratios and 95% Confidence Intervals for Primary Outcome (Total Depression)
eTable 14c. Association of Baseline 25(OH)D with Overall Mean Difference in Change (95% CI) in PHQ-8 Score Over Follow-up
Description of Results. From eTable 14
eTable 15. Means (SDs) of PHQ-8 Scores at Each Time Point, in Vitamin D3 and Placebo Groups
eFigure. Adjusted Differences in Change in Likelihood of PHQ-8 Item-Level Symptoms, comparing Vitamin D3 to Placebo
eMethods
eReferences
Data sharing statement
References
- 1.Mathers CD, Loncar D. Projections of global mortality and burden of disease from 2002 to 2030. PLoS Med. 2006;3(11):e442. doi: 10.1371/journal.pmed.0030442 [DOI] [PMC free article] [PubMed] [Google Scholar]
- 2.Unützer J, Simon G, Belin TR, Datt M, Katon W, Patrick D. Care for depression in HMO patients aged 65 and older. J Am Geriatr Soc. 2000;48(8):871-878. doi: 10.1111/j.1532-5415.2000.tb06882.x [DOI] [PubMed] [Google Scholar]
- 3.Beekman AT, Geerlings SW, Deeg DJ, et al. . The natural history of late-life depression: a 6-year prospective study in the community. Arch Gen Psychiatry. 2002;59(7):605-611. doi: 10.1001/archpsyc.59.7.605 [DOI] [PubMed] [Google Scholar]
- 4.Reynolds CF III, Cuijpers P, Patel V, et al. . Early intervention to reduce the global health and economic burden of major depression in older adults. Annu Rev Public Health. 2012;33:123-135. doi: 10.1146/annurev-publhealth-031811-124544 [DOI] [PMC free article] [PubMed] [Google Scholar]
- 5.Li H, Sun D, Wang A, et al. . Serum 25-hydroxyvitamin D levels and depression in older adults: a dose-response meta-analysis of prospective cohort studies. Am J Geriatr Psychiatry. 2019;27(11):1192-1202. doi: 10.1016/j.jagp.2019.05.022 [DOI] [PubMed] [Google Scholar]
- 6.Stewart AE, Roecklein KA, Tanner S, Kimlin MG. Possible contributions of skin pigmentation and vitamin D in a polyfactorial model of seasonal affective disorder. Med Hypotheses. 2014;83(5):517-525. doi: 10.1016/j.mehy.2014.09.010 [DOI] [PubMed] [Google Scholar]
- 7.Dumville JC, Miles JN, Porthouse J, Cockayne S, Saxon L, King C. Can vitamin D supplementation prevent winter-time blues? a randomised trial among older women. J Nutr Health Aging. 2006;10(2):151-153. [PubMed] [Google Scholar]
- 8.Committee on Prevention of Mental Disorders; Institute of Medicine . Reducing Risks for Mental Disorders: Frontiers for Preventive Intervention Research. National Academy Press; 1994. [PubMed] [Google Scholar]
- 9.Bot M, Brouwer IA, Roca M, et al. ; MooDFOOD Prevention Trial Investigators . Effect of multinutrient supplementation and food-related behavioral activation therapy on prevention of major depressive disorder among overweight or obese adults with subsyndromal depressive symptoms: the MooDFOOD randomized clinical trial. JAMA. 2019;321(9):858-868. doi: 10.1001/jama.2019.0556 [DOI] [PMC free article] [PubMed] [Google Scholar]
- 10.de Koning EJ, Lips P, Penninx BWJH, et al. . Vitamin D supplementation for the prevention of depression and poor physical function in older persons: the D-Vitaal study, a randomized clinical trial. Am J Clin Nutr. 2019;110(5):1119-1130. doi: 10.1093/ajcn/nqz141 [DOI] [PMC free article] [PubMed] [Google Scholar]
- 11.Okereke OI, Singh A. The role of vitamin D in the prevention of late-life depression. J Affect Disord. 2016;198:1-14. doi: 10.1016/j.jad.2016.03.022 [DOI] [PMC free article] [PubMed] [Google Scholar]
- 12.Jorde R, Kubiak J. No improvement in depressive symptoms by vitamin D supplementation: results from a randomised controlled trial. J Nutr Sci. 2018;7:e30. doi: 10.1017/jns.2018.19 [DOI] [PMC free article] [PubMed] [Google Scholar]
- 13.Jorde R, Sneve M, Figenschau Y, Svartberg J, Waterloo K. Effects of vitamin D supplementation on symptoms of depression in overweight and obese subjects: randomized double blind trial. J Intern Med. 2008;264(6):599-609. doi: 10.1111/j.1365-2796.2008.02008.x [DOI] [PubMed] [Google Scholar]
- 14.Cuijpers P. Examining the effects of prevention programs on the incidence of new cases of mental disorders: the lack of statistical power. Am J Psychiatry. 2003;160(8):1385-1391. doi: 10.1176/appi.ajp.160.8.1385 [DOI] [PubMed] [Google Scholar]
- 15.Okereke OI, Reynolds CF III, Mischoulon D, et al. . The VITamin D and OmegA-3 TriaL-Depression Endpoint Prevention (VITAL-DEP): rationale and design of a large-scale ancillary study evaluating vitamin D and marine omega-3 fatty acid supplements for prevention of late-life depression. Contemp Clin Trials. 2018;68:133-145. doi: 10.1016/j.cct.2018.02.017 [DOI] [PMC free article] [PubMed] [Google Scholar]
- 16.Manson JE, Cook NR, Lee IM, et al. ; VITAL Research Group . Vitamin D supplements and prevention of cancer and cardiovascular disease. N Engl J Med. 2019;380(1):33-44. doi: 10.1056/NEJMoa1809944 [DOI] [PMC free article] [PubMed] [Google Scholar]
- 17.Kroenke K, Strine TW, Spitzer RL, Williams JB, Berry JT, Mokdad AH. The PHQ-8 as a measure of current depression in the general population. J Affect Disord. 2009;114(1-3):163-173. doi: 10.1016/j.jad.2008.06.026 [DOI] [PubMed] [Google Scholar]
- 18.Luijendijk HJ, van den Berg JF, Dekker MJ, et al. . Incidence and recurrence of late-life depression. Arch Gen Psychiatry. 2008;65(12):1394-1401. doi: 10.1001/archpsyc.65.12.1394 [DOI] [PubMed] [Google Scholar]
- 19.Fitzmaurice GM, Laird NM, Ware JH. Modelling the mean: analyzing response profiles In: Fitzmaurice GM, Laird NM, Ware JH, eds. Applied Longitudinal Analysis. John Wiley & Sons; 2004:103-139. [Google Scholar]
- 20.Pan A, Sun Q, Czernichow S, et al. . Bidirectional association between depression and obesity in middle-aged and older women. Int J Obes (Lond). 2012;36(4):595-602. doi: 10.1038/ijo.2011.111 [DOI] [PMC free article] [PubMed] [Google Scholar]
- 21.Drincic AT, Armas LA, Van Diest EE, Heaney RP. Volumetric dilution, rather than sequestration best explains the low vitamin D status of obesity. Obesity (Silver Spring). 2012;20(7):1444-1448. doi: 10.1038/oby.2011.404 [DOI] [PubMed] [Google Scholar]
- 22.Fine JP, Gray RJ. A proportional hazards model for the subdistribution of a competing risk. J Am Stat Assoc. 1999;94(446):496-509. doi: 10.1080/01621459.1999.10474144 [DOI] [Google Scholar]
- 23.Sanders KM, Stuart AL, Williamson EJ, et al. . Annual high-dose vitamin D3 and mental well-being: randomised controlled trial. Br J Psychiatry. 2011;198(5):357-364. doi: 10.1192/bjp.bp.110.087544 [DOI] [PubMed] [Google Scholar]
- 24.Libuda L, Laabs BH, Ludwig C, et al. . Vitamin D and the risk of depression: a causal relationship? findings from a mendelian randomization study. Nutrients. 2019;11(5):E1085. doi: 10.3390/nu11051085 [DOI] [PMC free article] [PubMed] [Google Scholar]
- 25.Milaneschi Y, Peyrot WJ, Nivard MG, Mbarek H, Boomsma DI, W J H Penninx B. A role for vitamin D and omega-3 fatty acids in major depression? an exploration using genomics. Transl Psychiatry. 2019;9(1):219. doi: 10.1038/s41398-019-0554-y [DOI] [PMC free article] [PubMed] [Google Scholar]
- 26.Kim SM, Lutsey PL, Michos ED. Vitamin D and cardiovascular disease: can novel measures of vitamin D status improve risk prediction and address the vitamin D racial paradox? Curr Cardiovasc Risk Rep. 2017;11(1):3. doi: 10.1007/s12170-017-0528-7 [DOI] [PMC free article] [PubMed] [Google Scholar]
Associated Data
This section collects any data citations, data availability statements, or supplementary materials included in this article.
Supplementary Materials
Trial protocol and statistical analysis plan
eTable 1. Detailed Baseline Characteristics of Participants, According to Randomized Vitamin D3 and Placebo Groups
eTable 2. Mean Difference in Change Since Baseline in PHQ-8 Score Comparing Vitamin D3 and Placebo Groups, According to Baseline Subgroups
Description of Results. From Sub-Group Analyses in Figure 3 and eTable 2
eTable 3. Adjusted Means at Baseline and Mean Change (95% CI) in PHQ-8 Scores at Each Year Since Randomization Compared to Baseline, according to Vitamin D3 and Placebo Groups, Censoring PHQ-8 Scores after Initiation of Antidepressants
eTable 4. Participant-Reported Adherence with the Vitamin D3 and Placebo Study Pills (% of Pills Taken) for All Time Points, among Participants Responding to Compliance Questionnaires
eTable 5. Hazard Ratios (HR) and 95% Confidence Intervals (CI) for the Primary and Secondary Outcomes, According to Randomized Assignment to Vitamin D3 or Placebo, with Additional Censoring at Time Taking Less than 2/3 Study Pills or Taking >800 IU/d of Outside (Non-study) Vitamin D
eTable 6a. Hazard Ratios (HR) and 95% Confidence Intervals (CI) for the Primary and Secondary Outcomes, According to Randomized Assignment to Vitamin D3 or Placebo, with Additional Censoring at Incident CVD
eTable 6b. Hazard Ratios (HR) and 95% Confidence Intervals (CI) for the Primary and Secondary Outcomes, According to Randomized Assignment to Vitamin D3 or Placebo, with Additional Adjustment for CVD as a Time-Dependent Covariate
eTable 7a. Hazard Ratios (HR) and 95% Confidence Intervals (CI) for the Primary and Secondary Outcomes, According to Randomized Assignment to Vitamin D3 or Placebo, with Additional Censoring at Incident Cancer
eTable 7b. Hazard Ratios (HR) and 95% Confidence Intervals (CI) for the Primary and Secondary Outcomes, According to Randomized Assignment to Vitamin D3 or Placebo, with Additional Adjustment for Total Cancer as a Time-Dependent Covariate
Description of Results. From Sensitivity Analyses in eTable 6 and eTable 7
eTable 8. Subdistribution Hazard Models Comparing the Risk of Depression in the Vitamin D3 and Placebo Groups
eTable 9. Adjusted Differences in Change in PHQ-8 Scores Since Baseline, comparing Vitamin D3 to Placebo
eTable 10. Adjusted Means at Baseline and Mean Change (95% CI) in PHQ-8 Scores at Each Year Since Randomization Compared to Baseline, according to Vitamin D3 and Placebo Groups, Censoring PHQ-8 Scores at Date of Mood Safety Letter
Description of Results. From Sensitivity Analyses in eTable 10
eTable 11. Adjusted Means at Baseline and Mean Change (95% CI) in PHQ-8 Scores at Each Year Since Randomization Compared to Baseline, according to Vitamin D3 and Placebo Groups, Omitting Year 5 PHQ-8 Score
eTable 12. Sex-specific Total, Incident and Recurrent Rates of Depression, per 1000 Person-Years (p-y)
Description of Results. From eTable 12, Sex-Specific Depression Rates and Relation of Sex to Depression Risk
eTable 13. Total, Incident and Recurrent Rates of Depression, per 1000 Person-Years (p-y), by Vitamin D3 and Placebo Groups
eTable 14a. Association of Low Baseline 25(OH)D with Hazard Ratios and 95% Confidence Intervals for Primary Outcome (Total Depression)
eTable 14b. Association of Continuous Baseline 25(OH)D with Hazard Ratios and 95% Confidence Intervals for Primary Outcome (Total Depression)
eTable 14c. Association of Baseline 25(OH)D with Overall Mean Difference in Change (95% CI) in PHQ-8 Score Over Follow-up
Description of Results. From eTable 14
eTable 15. Means (SDs) of PHQ-8 Scores at Each Time Point, in Vitamin D3 and Placebo Groups
eFigure. Adjusted Differences in Change in Likelihood of PHQ-8 Item-Level Symptoms, comparing Vitamin D3 to Placebo
eMethods
eReferences
Data sharing statement