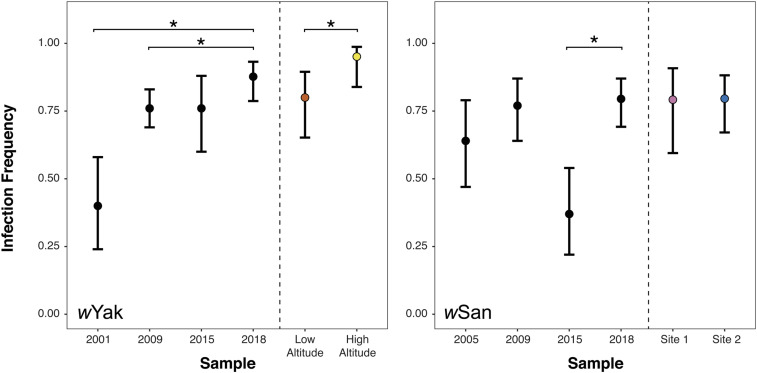
Figure 2.
Wolbachia infection frequencies on São Tomé. Data from the present study (2018) are compared to previous estimates of infection frequencies from 2001 to 2015 (Cooper et al. 2017). Error bars represent 95% binomial confidence intervals. To the right of vertical dashed lines, 2018 infection frequencies are separated by region for each species. Points are color-coded according to Figure 1. Asterisks indicate statistically significant differences between 2018 and prior years, or between regions in the 2018 sample at P < 0.05.

