Abstract
Objectives/Hypothesis
The aims of this work were 1) to investigate whether office laryngoscopy is an aerosol‐generating procedure with an optical particle sizer (OPS) during clinical simulation on healthy volunteers, and 2) to critically discuss methods for assessment of aerosolizing potentials in invasive interventions.
Study Design
Prospective quantification of aerosol and droplet generation during clinical simulation of rigid and flexible laryngoscopy.
Methods
Two healthy volunteers were recruited to undergo both flexible and rigid laryngoscopy. An OPS was used to quantify aerosols and droplets generated for four positive controls relative to ambient particles (speech, breathing, /e/ phonation, and /æ/ phonation) and for five test interventions relative to breathing and phonation (flexible laryngoscopy, flexible laryngoscopy with humming, flexible laryngoscopy with /e/ phonation, rigid laryngoscopy, and rigid laryngoscopy with /æ/ phonation). Particle counts in mean diameter size range from 0.3 to >10 μm were measured with OPS placed at 12 cm from the subject's nose/mouth.
Results
None of the laryngoscopy interventions (n = 10 each) generated aerosols above that produced by breathing or phonation. Breathing (n = 40, 1–3 μm, P = .016) and /æ/ phonation (n = 10, 1–3 μm, P = .022; 3–5 μm. P = .083; >5 μm, P = .012) were statistically significant producers of aerosols and droplets. Neither speech nor /e/ phonation (n = 10 each) were associated with statistically significant aerosols and droplet generation.
Conclusions
Using OPS to detect droplets and aerosols, we found that office laryngoscopy is likely not an aerosol‐generating procedure. Despite its prior use in otolaryngological literature, an OPS has intrinsic limitations. Our study should be complemented with more sophisticated methods of droplet distribution measurement.
Level of Evidence
3 Laryngoscope, 130:2637–2642, 2020
Keywords: Flexible laryngoscopy, rigid laryngoscopy, aerosol‐generating procedures, optical particle sizer, droplet quantification
INTRODUCTION
The novel coronavirus, SARS‐CoV‐2 (COVID‐19), has highlighted a multitude of deficiencies in our healthcare system and scientific knowledge. One of the most disconcerting of these has been our incomplete understanding of aerosol‐generating procedures (AGPs). Procedures and interventions involving the upper and lower airways have been linked to increased infection rates among healthcare professionals. 1 Although a number of studies have investigated the aerosol‐generating potential of specific procedures, 2 , 3 , 4 , 5 , 6 , 7 evidence has been ambiguous or contradictory.
Office laryngoscopy is a prime example, being a source of concern, debate, and speculation during this crisis. 8 Some organizations have listed it as potentially aerosol generating, 9 , 10 whereas others have stated the opposite, citing factors such as absence of sheer stresses needed to generate aerosols. 11 , 12 Currently, there is insufficient evidence to support either view. In addition, there is widespread misconception of the definition of AGPs within the otolaryngology community. By standard definition, AGPs are procedures that have the potential to create aerosols in addition to those that patients regularly form from breathing, coughing, sneezing, or talking. 13 Refining our understanding of the aerosol‐generating risk of various otolaryngological procedures is critical not only for the current COVID‐19 crisis, but also for future viral pandemics and endemic viral strains transmissions.
In this study, we quantify aerosolization associated with flexible and rigid office laryngoscopy, and critically review methods for measuring the aerosolizing potential of medical and surgical interventions.
MATERIALS AND METHODS
The protocols for this study was reviewed by the Weill Cornell Medical College Institutional Review Board and deemed exempt of formal supervision as a quality‐improvement initiative. One female and one male healthy adult volunteer were recruited. Both volunteers were members of the clinical faculty, and had tested negative for SARS‐CoV‐2 via reverse transcriptase polymerase chain reaction of nasopharyngeal swabs within 2 weeks of the simulation.
Following the standard definition of AGPs, we aimed to determine whether flexible or rigid laryngoscopy produce measurable aerosols and droplets, above and beyond breathing, coughing, sneezing, or talking, all of which have been demonstrated to be aerosol generating 14 , 15 , 16 , 17 and may be present in any clinical interaction, though cough and sneeze can be elicited by office laryngoscopy. The experimental design (Fig. 1) was constructed based on this definition.
Fig. 1.
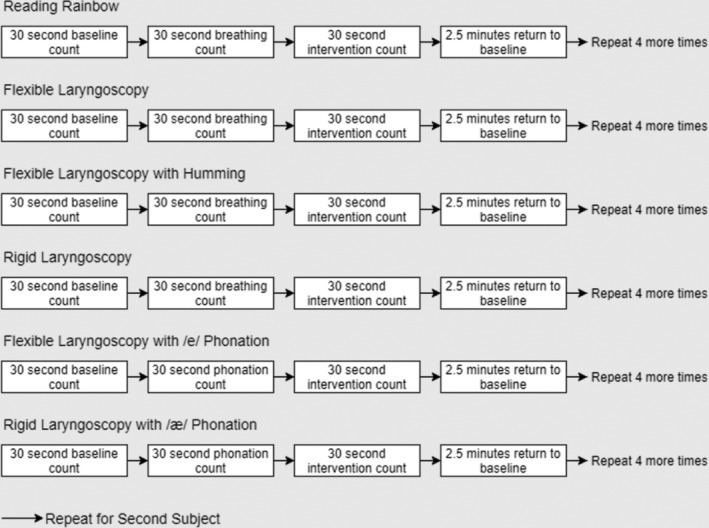
Experimental design.
Aerated particles were quantified using an optical particle sizer (OPS), AeroTrak 9306 (TSI, Shoreview, MN). An OPS utilizes an internal laser system to count the number of particles in the air based on amount of light scattered. Air is funneled through the isokinetic inlet at a rate of 2.83 L/min ± 5% accuracy. The counter adds the number of particles in the sampled air for a specified period of time; in this study, it was set for 30‐second interval measurements. Although the Aerotrak 9306 OPS is able to detect particles as small as 0.3 μm, we excluded those under 1 μm, as counting efficiency at the 0.3 μm range was 50%, and approached 100% around the 1 μm point. In addition, there was a substantial number of ambient particles under the 1 μm threshold causing unacceptable levels of noise. Particle counts were stratified by size: 1–3 μm, 3–5 μm, and >5 μm. The cutoff for droplets versus aerosols is controversial 13 ; however, we take particles <5 μm to represent aerosols, and those >5 μm to represent droplets following convention. 18 Prior to use, the device was calibrated using polystyrene latex spheres (Raeco, Bensenville, IL), and zero counts were confirmed before each subject using the high efficiency particulate air filter provided by TSI.
Each subject underwent six interventions for 30 seconds: 1) speech (Rainbow Passage reading), 19 2) flexible laryngoscopy, 3) flexible laryngoscopy with humming, 4) flexible laryngoscopy with /e/ phonation, 5) rigid laryngoscopy, and 6) rigid laryngoscopy with /æ/ phonation. Speech (Rainbow Passage reading) was included as a positive control. Flexible laryngoscopy with humming was included as a potential solution to reduce aerosolization during laryngoscopy, because oral vocalization is known to be aerosol generating. 13
Each intervention was repeated for each subject five times, for a total of 10 replicates per intervention. For each replicate, a 30‐second initial baseline recording was performed to document the number of ambient particles. Then, the isokinetic inlet of the particle counter was placed 12 cm anterior to the nares for flexible laryngoscopy and 12 cm anterior to the oral orifice for rigid laryngoscopy and speech (Fig. 2) to obtain a 30‐second recording of the number of particles generated by breathing alone. Prior to the recordings of laryngoscopy with phonation, particle counts during phonation of /e/ or /æ/ at a constant decibel level for 15 seconds was obtained. Each intervention was then performed concurrently with a 30‐second recording of particle counts. Between each replicate set, 3 minutes were allowed to elapse to allow for ambient particles to return to baseline. Subjects drank water intermittently during the simulation to maintain hydration of the oropharyngeal mucosa and laryngeal surfaces.
Fig. 2.
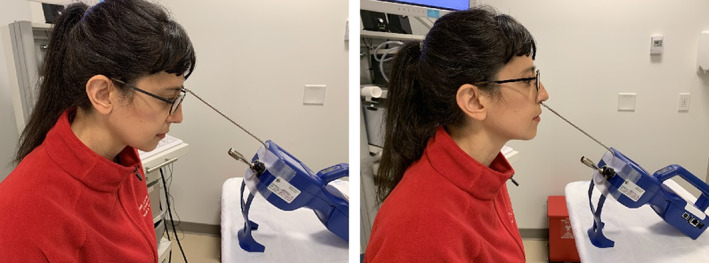
Experimental setup for flexible laryngoscopy (left) and rigid laryngoscopy and speech (right).
The experiments were conducted in two laryngology clinic rooms, 2.5 × 2.5 × 5 m in size operating at six air changes per hour. To reduce the number of ambient particles and optimize aerosol detection, room air filtration was performed with a Honeywell (Charlotte, NC) Allergen Air Filter (level 9 on the filter performance rating scale, model #HW9FPR09A09A1.1) for 1 hour prior to experiment start. The rooms' doors were kept closed during experiments, and airflow below the doors were sealed with a rubber stopper, such that the sole source of ambient particles was the rooms' ventilation systems.
Statistical analyses were performed using SPSS version 26.0 (IBM, Armonk, NY). Wilcoxon signed rank test was used to compare nine pairs of intervention counts to reference counts (i.e., intervention minus reference): four positive controls and five test groups. The four positive controls included 1) speech, 2) breathing, 3) /e/ phonation, and 4) /æ/ phonation, all relative to ambient particles. The five test groups included 1) flexible laryngoscopy, 2) flexible laryngoscopy with humming, 3) rigid laryngoscopy, 4) flexible laryngoscopy with /e/ phonation, and 5) rigid laryngoscopy with /æ/ phonation. Particles generated during interventions 1 to 3 were evaluated relative to those generated during breathing, and those generated during interventions 4 and 5 to /e/ and /æ/ phonation, respectively.
RESULTS
There was a statistically significant increases in particle counts between 1 and 3 μm (median difference = 7774, P = .016, Fig. 3, Table I) for breathing relative to background, and /æ/ phonation was also statistically significant (1–3 μm: median difference = 34,859, P = .022; 3–5 μm: median difference = 9,507, P = .083; >5 μm: median difference = 13,732, P = .012). Aerosols and droplets produced during two of the four positive controls, /e/ phonation and speech, were not statistically significant. There were no significant increases in aerosol and droplet counts for flexible laryngoscopy, flexible laryngscopy with humming, flexible laryngoscopy with /e/ sound, rigid laryngscopy, and rigid laryngoscopy with /æ/ sound relative to breathing or phonation for any particle size (Fig. 4, Table I). A statistically significant change was observed for rigid laryngoscopy with /æ/ phonation; however, this change was in the downward direction and was likely caused by decreased phonation duration related to gagging events in both subjects. Figure 5 presents an example experimental run for one subject.
Fig. 3.
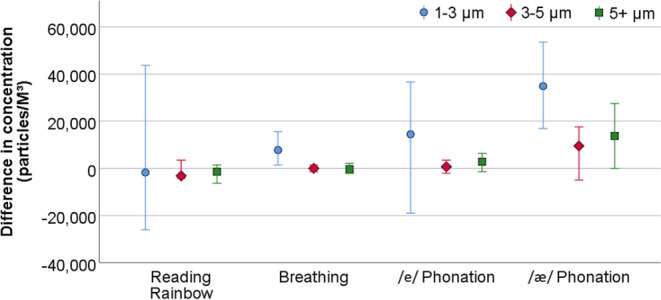
Difference between intervention and reference counts for positive controls stratified by particle size. Positive values represent higher intervention counts relative to background, and negative values represent lower intervention counts relative to background. Marker = median, error bars = 95% confidence interval.
TABLE I.
Summary of Statistical Comparisons Stratified by Particle Size and Intervention.
| N | 1–3 μm | 3–5 μm | >5 μm | ||||
|---|---|---|---|---|---|---|---|
| Median Difference (Particles/M3) | P Value | Median Difference (Particles/M3) | P Value | Median Difference (Particles/M3) | P Value | ||
| Positive controls (relative to background) | |||||||
| Speech | 10 | −1,761 | .838 | −3,169 | .284 | −1,408 | .192 |
| Breathing | 40 | 7,774 | .016* | 0 | .700 | −353 | .763 |
| Phonation with /e/ | 10 | 14,437 | .126 | 704 | .574 | 2,817 | .153 |
| Phonation with /æ/ | 10 | 34,859 | .022* | 9,507 | .083 | 13,732 | .012* |
| Test interventions | |||||||
| Flexible laryngoscopy (relative to breathing) | 10 | −3,873 | .386 | −1,408 | .201 | 1,408 | .329 |
| Flexible laryngoscopy with humming (relative to breathing) | 10 | −352 | .386 | 2,113 | .212 | −1,056 | .550 |
| Flexible laryngoscopy with /e/ sound (relative to /e/ phonation) | 10 | −8,451 | .169 | 0 | .779 | −704 | .646 |
| Rigid laryngoscopy (relative to breathing) | 10 | 10,915 | .475 | 1,761 | .594 | 3,169 | .333 |
| Rigid laryngoscopy with /æ/ sound (relative to /æ/ phonation) | 10 | −23,592 | .013 | −9,507 | .138 | −11,972 | .013 |
Positive values represent higher intervention counts relative to reference, and negative values represent lower intervention counts relative to reference.
Significant increase at P < .05.
Fig. 4.
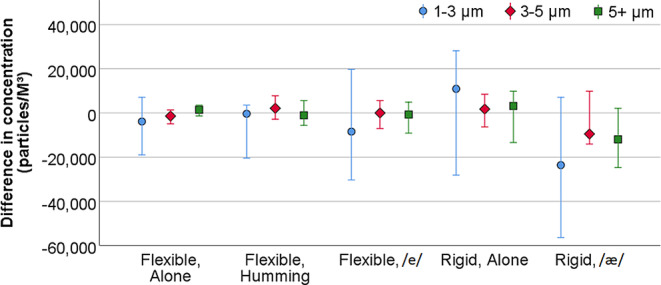
Difference between intervention and reference counts for test interventions stratified by particle size. Positive values represent higher intervention counts relative to background, and negative values represent lower intervention counts relative to background. Marker = median, error bars = 95% confidence interval.
Fig. 5.
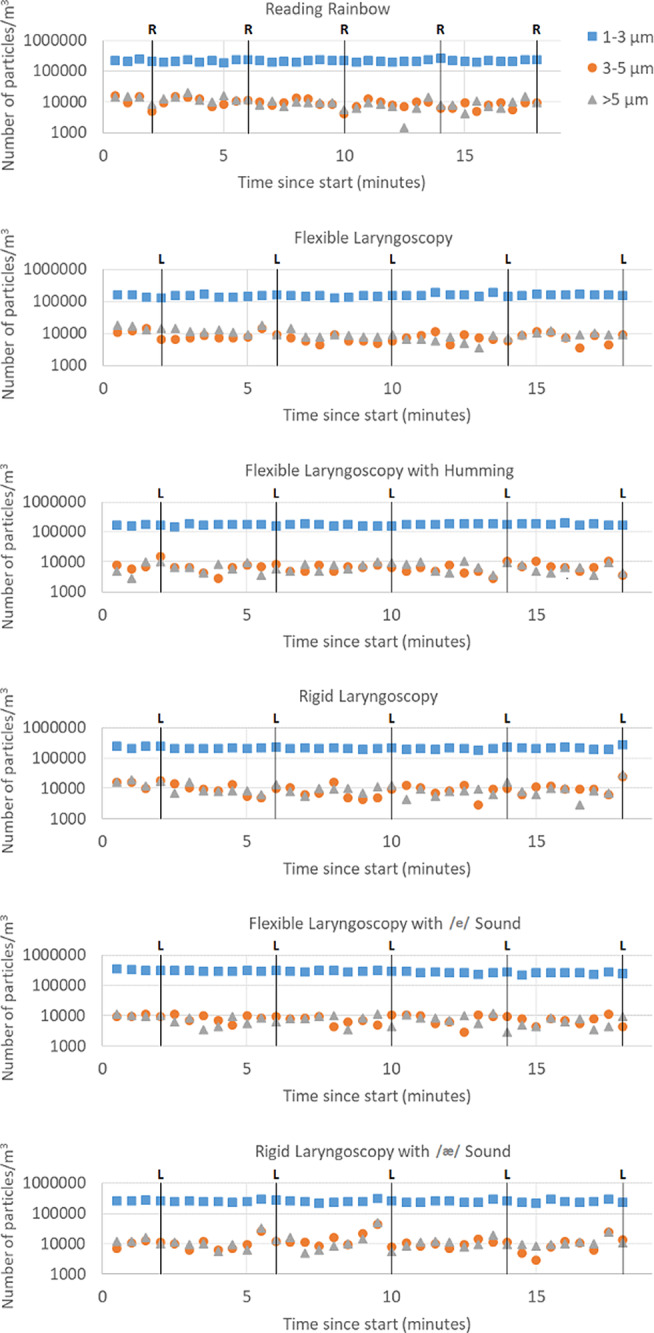
Experimental run for one subject. Markers indicate 30‐second recordings of particle counts. Black line with R (reading) and L (laryngoscopy) demarcate times of intervention. The marker immediately prior to intervention represent breathing or phonation, respectively.
DISCUSSION
Breathing, coughing, sneezing, and speaking are ubiquitous in the clinical setting. According to convention, an AGP is an intervention that generates significant additional particle material over and above these baseline risks. 20 By this standard, office laryngoscopy is likely not an AGP when assessed with OPS technology. An OPS has previously been used to assess the AGP potential of nasal endoscopy in a clinical simulation. 7 Nasal endoscopy was determined to be an AGP, although the comparison was to ambient particles rather than to normal breathing, a potentially misleading result when judged against work using the more broadly accepted standard. An OPS, a common instrument in construction and laboratory toolkits, has the advantage of accessibility and ease of use. However, it is not the only method for studying aerosol formation, and may be less accurate than alternatives. The technique is highly susceptible to errors in sizing and related miscounts, as its accuracy depends on the optical properties of the particles measured, such as color. 21 OPSs are usually calibrated against polystyrene latex spheres, which differ in refractive properties from respiratory aerosols and droplets, which are typically multiphase and not just transparent. Only transparent droplets can be quantified reliably with the OPS technique. 22
OPS evaluation of AGPs is best complemented with more sophisticated aerosol counting and distribution measurement techniques to minimize the possibility of false negative results leading to occupational hazard for healthcare professionals. Given the nature of their profession, it is crucial for otolaryngologists to generate high‐level evidence regarding aerosolization risk of their clinical and surgical procedures. Other modalities for the study of aerosols include microscopy, interferometric Mie imaging, aerodynamic particle sizing, scanning mobility particle spectrometry, and laser diffractometry. 22 Microscopy involves the introduction of dye into the mouth of a subject and collection of ejected materials on a celluloid slide, which can be examined under a microscope. 23 , 24 , 25 Interferometric Mie imaging uses a flattened laser sheet to enumerate the passing particles based on light scattering recorded by a charge‐coupled device camera. 26 Aerodynamic particle sizing uses a 655‐nm laser and photodetector to determine the diameter of expired particles also by light scatter. 27 , 28 , 29 Scanning mobility particle spectrometry sorts particles using an electromagnetic field, and subsequently counts these sorted particles using a condensation particle counter. 27 , 28 , 30 Lastly, laser diffractometry uses a system of lasers in a 100‐mm‐long × 10‐mm‐diameter cylinder to measure light scattering from passing particles. 31 Of these modalities, interferometric Mie imaging and laser diffractometry provide more accurate data on aerosol counts and distribution patterns, as they do not rely on airborne materials to be drawn into a sampling unit. 22
Our findings are based on a limited number of replicates in two healthy volunteers, due to study restrictions in the setting of the COVID‐19 pandemic. Additional studies will be useful in establishing the generalizability of our findings. Despite these limitations, our OPS results from this clinical simulation are provocative and suggest that office laryngoscopy may not meet the definition criteria of an AGP. Statistically significant increases in particle counts during breathing and phonation suggest that our study design is able to detect at least some baseline level of aerosol generation. Office laryngoscopy may not generate the frictional forces required to sheer and propagate aerosols and droplets from the respiratory mucosa. Nevertheless, laryngoscopy is still associated with increased risk of coughing and sneezing, and requires phonation, all of which are aerosol‐generating events in absolute terms. Respiratory precautions, including donning of surgical masks and consideration of N95 masks, should thus be applied during office laryngoscopy. Aerosols produced during flexible laryngoscopy may be reduced by requesting humming with the mouth closed, over oral phonation. Further evaluation of aerosolization risk with office laryngoscopy is needed, and we encourage interferometric Mie imaging or laser diffractometry for this purpose. We recommend more otolaryngology scholarship in the field of aerosol science, which could be fostered by collaboration with engineering departments.
CONCLUSION
Establishing an accurate analysis of AGPs in otolaryngology is critical in preparing for the next pandemic, and even in preventing endemic respiratory virus transmission. Our study suggests that office laryngoscopy may not be an AGP according to the standard medical definition, namely aerosol production more than normally expected from breathing, coughing, sneezing, and speaking. However, optical particle sizing, our method of aerosol quantification, is subject to significant limitations, and needs to be supplemented by more sophisticated aerosol measurement techniques.
This work was performed at the The Sean Parker Institute for the Voice, Weill Cornell Medicine, New York, New York, U.S.A.
a.r. is a cofounder and Chief Executive Officer of MyophonX, a wearable device used to restore speech in patients with limited phonation capacity. There was no financial support provided for this study.
Editor’s Note: This Manuscript was accepted for publication on July 01, 2020.
The authors have no other funding, financial relationships, or conflicts of interest to disclose.
BIBLIOGRAPHY
- 1. Tran K, Cimon K, Severn M, Pessoa‐Silva CL, Conly J. Aerosol generating procedures and risk of transmission of acute respiratory infections to healthcare workers: a systematic review. PLoS One 2012;7:e35797. [DOI] [PMC free article] [PubMed] [Google Scholar]
- 2. Thompson KA, Pappachan JV, Bennett AM, et al. Influenza aerosols in UK hospitals during the H1N1 (2009) pandemic—the risk of aerosol generation during medical procedures. PLoS One 2013;8:e56278. [DOI] [PMC free article] [PubMed] [Google Scholar]
- 3. Micik RE, Miller RL, Mazzarella MA, Ryge G. Studies on dental aerobiology: I. bacterial aerosols generated during dental procedures. J Dent Res 1969;48:49–56. [DOI] [PubMed] [Google Scholar]
- 4. O'Neil CA, Li J, Leavey A, et al. Characterization of aerosols generated during patient care activities. Clin Infect Dis 2017;65:1342–1348. [DOI] [PMC free article] [PubMed] [Google Scholar]
- 5. Bentley CD, Burkhart NW, Crawford JJ. Evaluating spatter and aerosol contamination during dental procedures. J Am Dent Assoc 1994;125:579–584. [DOI] [PubMed] [Google Scholar]
- 6. Simonds A, Hanak A, Chatwin M, et al. Evaluation of droplet dispersion during non‐invasive ventilation, oxygen therapy, nebuliser treatment and chest physiotherapy in clinical practice: implications for management of pandemic influenza and other airborne infections. Health Technol Assess 2010;14:131–172. [DOI] [PubMed] [Google Scholar]
- 7. Workman AD, Jafari A, Welling BD, et al. Airborne aerosol generation during endonasal procedures in the era of COVID‐19: risks and recommendations [published online May 26, 2020]. Otolaryngol Head Neck Surg 2020;019459982093180. 10.1177/0194599820931805 [DOI] [PMC free article] [PubMed] [Google Scholar]
- 8. Rameau A, Young VN, Amin MR, Sulica L. Flexible laryngoscopy and COVID‐19. Otolaryngol Head Neck Surg 2020;162:813–815. [DOI] [PubMed] [Google Scholar]
- 9. Boe M, Nowak S, Zier S. COVID‐19: aerosol‐generating procedures. Children's Minnesota. Available at: https://www.childrensmn.org/departments/infectioncontrol/pdf/covid-19-aerosol-generating-procedures.pdf. Accessed June 10, 2020.
- 10. Infection Prevention and Control . Vancouver Coastal Health. Available at: http://ipac.vch.ca/Documents/Acute%20Resource%20manual/Aerosol%20Generating%20Medical%20Procedures.pdf. Accessed June 10, 2020.
- 11. Morgenstern J. Aerosol generating procedures. First10EM website. Available at: https://first10em.com/aerosol-generating-procedures/. Accessed June 10, 2020.
- 12. Setzen G, Anne S, Brown EG, et al. Guidance for return to practice for otolaryngology‐head and neck surgery: part one. Available at: https://www.entnet.org/sites/default/files/guidance_for_return_to_practice_part_1_final_050520.pdf. Accessed June 10, 2020.
- 13. Davies A, Thomson G, Walker J, Bennett A. A review of the risks and disease transmission associated with aerosol generating medical procedures. J Infect Prev 2009;10:122–126. [Google Scholar]
- 14. Bourouiba L. Turbulent gas clouds and respiratory pathogen emissions: potential implications for reducing transmission of COVID‐19. JAMA 2020;323:1837–1838. [DOI] [PubMed] [Google Scholar]
- 15. Anfinrud P, Stadnytskyi V, Bax CE, Bax A. Visualizing speech‐generated oral fluid droplets with laser light scattering. N Engl J Med 2020;382:2061–2063. [DOI] [PMC free article] [PubMed] [Google Scholar]
- 16. Asadi S, Wexler AS, Cappa CD, Barreda S, Bouvier NM, Ristenpart WD. Aerosol emission and superemission during human speech increase with voice loudness. Sci Rep 2019;9:2348. [DOI] [PMC free article] [PubMed] [Google Scholar]
- 17. Milton DK, Fabian MP, Cowling BJ, Grantham ML, McDevitt JJ. Influenza virus aerosols in human exhaled breath: particle size, culturability, and effect of surgical masks. PLoS Pathog 2013;9:e1003205. [DOI] [PMC free article] [PubMed] [Google Scholar]
- 18. Tellier R. Review of aerosol transmission of influenza a virus. Emerg Infect Dis 2006;12:1657–1662. [DOI] [PMC free article] [PubMed] [Google Scholar]
- 19. Fairbanks G. Voice and Articulation Drillbook. 2nd ed. New York, NY: Harper & Row; 1960. [Google Scholar]
- 20. Judson SD, Munster VJ. Nosocomial transmission of emerging viruses via aerosol‐generating medical procedures. Viruses 2019;11:940. [DOI] [PMC free article] [PubMed] [Google Scholar]
- 21. Liu Y, Daum PH. The effect of refractive index on size distributions and light scattering coefficients derived from optical particle counters. J Aerosol Sci 2000;31:945–957. [Google Scholar]
- 22. Dudalski N. Experimental measurements of human cough airflows from healthy subjects and those infected with respiratory viruses [dissertation]. London, ON: University of Western Ontario; 2018.
- 23. Nicas M, Nazaroff WW, Hubbard A. Toward understanding the risk of secondary airborne infection: emission of respirable pathogens. J Occup Environ Hyg 2005;2:143–154. [DOI] [PMC free article] [PubMed] [Google Scholar]
- 24. Duguid J. The size and the duration of air‐carriage of respiratory droplets and droplet‐nuclei. Epidemiol Infect 1946;44:471–479. [DOI] [PMC free article] [PubMed] [Google Scholar]
- 25. Loudon R, Roberts R. Relation between the airborne diameters of respiratory droplets and the diameter of the stains left after recovery. Nature 1967;213:95–96. [Google Scholar]
- 26. Chao CYH, Wan MP, Morawska L, et al. Characterization of expiration air jets and droplet size distributions immediately at the mouth opening. J Aerosol Sci 2009;40:122–133. [DOI] [PMC free article] [PubMed] [Google Scholar]
- 27. Yang S, Lee GW, Chen C‐M, Wu C‐C, Yu K‐P. The size and concentration of droplets generated by coughing in human subjects. J Aerosol Med 2007;20:484–494. [DOI] [PubMed] [Google Scholar]
- 28. Morawska L, Johnson G, Ristovski Z, et al. Size distribution and sites of origin of droplets expelled from the human respiratory tract during expiratory activities. J Aerosol Sci 2009;40:256–269. [Google Scholar]
- 29. Johnson G, Morawska L, Ristovski Z, et al. Modality of human expired aerosol size distributions. J Aerosol Sci 2011;42:839–851. [Google Scholar]
- 30. Rengasamy S, Eimer BC, Szalajda J. A quantitative assessment of the total inward leakage of NaCl aerosol representing submicron‐size bioaerosol through N95 filtering facepiece respirators and surgical masks. J Occup Environ Hyg 2014;11:388–396. [DOI] [PMC free article] [PubMed] [Google Scholar]
- 31. Zayas G, Chiang MC, Wong E, et al. Cough aerosol in healthy participants: fundamental knowledge to optimize droplet‐spread infectious respiratory disease management. BMC Pulm Med 2012;12:1–11. 10.1186/1471-2466-12-11 [DOI] [PMC free article] [PubMed] [Google Scholar]


