Summary
A knowledge‐based cybernetic framework model representing the dynamics of SARS‐CoV‐2 inside the human body has been studied analytically and in silico to explore the pathophysiologic regulations. The following modeling methodology was developed as a platform to introduce a predictive tool supporting a therapeutic approach to Covid‐19 disease. A time‐dependent nonlinear system of ordinary differential equations model was constructed involving type‐I cells, type‐II cells, SARS‐CoV‐2 virus, inflammatory mediators, interleukins along with host pulmonary gas exchange rate, thermostat control, and mean pressure difference. This formalism introduced about 17 unknown parameters. Estimating these unknown parameters requires a mathematical association with the in vivo sparse data and the dynamic sensitivities of the model. The cybernetic model can simulate a dynamic response to the reduced pulmonary alveolar gas exchange rate, thermostat control, and mean pressure difference under a very critical condition based on equilibrium (steady state) values of the inflammatory mediators and system parameters. In silico analysis of the current cybernetical approach with system dynamical modeling can provide an intellectual framework to help experimentalists identify more active therapeutic approaches.
Keywords: Covid‐19, cybernetics, gas exchange, inflammatory mediators, pressure difference, thermostat
Abbreviations
- ACE‐2
angiotensin‐converting enzyme 2
- ARDS
acute respiratory distress syndrome
- BMP
bone morphogenetic protein
- Covid‐19
coronavirus disease‐2019
- HR
heart rate
- IL
interleukin
- MERS
Middle Eastern respiratory syndrome
- O2
oxygen
- RNA
ribonucleic acid
- RR
respiratory rate
- SARS‐CoV‐2
severe acute respiratory syndrome coronavirus 2
- SIRS
systemic inflammatory response syndrome
- SNS
sympathetic nervous system
- SSRNA
single‐stranded RNA
- TFN‐ α
tumor necrosis factor‐alpha
- TGF‐β
transforming growth factor‐β
- WHO
World Health Organization
- WOB
work of breathing
1. INTRODUCTION
The novel coronavirus 2 (SARS‐CoV‐2) causing Covid‐19 disease first appeared in December 2019 in China. 1 This severe acute respiratory syndrome rapidly spread to almost all countries in the world. As per the World Health Organization (WHO), 2 the total number of Covid‐19 cases until now is 7 410 510 and the number of deaths 418 294 worldwide. On 11 March 2020, WHO declared the Covid‐19 outbreak a global pandemic. This highly infectious disease is passing effortlessly from humans to humans in many ways such as droplets within a 1‐m radius, airborne transmission within 3 hours duration, surface transmission with 2 to 3 days duration, and fecal‐oral 3 . About 4.5 billion people across the world will be living under social distancing measures. The economic pandemonium associated with the Covid‐19 pandemic has wide‐ranging and severe impacts for financial markets worldwide.
Mike Ryan, Assistant Director‐General for Emergencies of the World Health Organization, has issued a fresh warning about the coronavirus in a virtual press conference on Covid‐19 on 13 May 2020. He said, “I think it's important to put this on the table; this virus may become just another endemic virus in our communities, and this virus may never go away.” 4
At present, the biggest challenge to the world is the prevention of SARS‐CoV‐2 spreading by developing an appropriate vaccine. Scientists worldwide are working hard to develop a proper vaccine to counter this deadly virus and human trials are already underway in the United Kingdom, China, Australia, United States, Italy, and Germany.
Chen et al 5 developed a Bats‐Hosts‐Reservoir‐People transmission network model. The model estimation shows the value of being of 2.30 from reservoir to person and 3.58 from person to person. Therefore, one Covid‐19 infected individual can able to infect about three to four other individuals. Wu et al reported that pandemic doubling times is 6.4 days. 6 It means that the transmissibility of SARS‐CoV‐2 (Covid‐19) is much higher than the Middle Eastern respiratory syndrome (MERS).
Figure 1 indicates that within a short period, one Covid‐19 infected person can infect another three in 6 days, and those three newly infected can spread the disease among nine more in 6 days, and so on.
FIGURE 1.
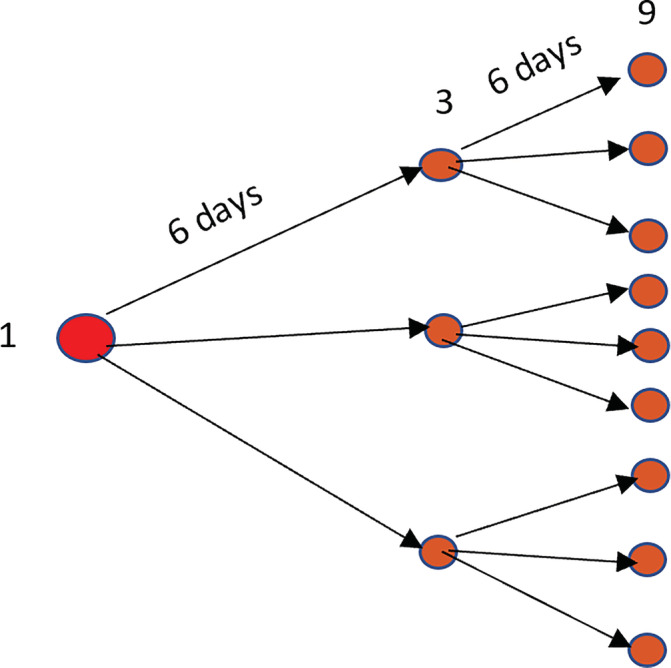
Disease spread by single infected human
Kissler et al 7 developed a model on SARS‐CoV‐2 transmission dynamics in temperate regions. Model analysis suggested that the total number incidence of the virus infection through 2025 will entirely depend upon the duration of human immunity development—of which there is absolutely no knowledge yet. The model also predicts that one‐time social distancing helps suppress disease transmission to keep within hospital capacity, but it could recur if these measures are relaxed.
Remdesivir has recently been licensed, but there is currently no other proven effective treatment available for Covid‐19 patients, including the immunopathogical components. 8
Guan et al reported that the median incubation period for Covid‐19 is 4 days with interquartile range, 2 to 7. The serial interval between two consecutive transmission generation pairs is between 3 days and 8 days. 9 , 10 , 11 , 12 Within 2 days of symptom starts, the SARS‐CoV‐2 viral load reaches a peak. Severe Covid‐19 patients develop acute respiratory distress syndrome (ARDS) on an average of around 8 to 9 days after symptoms when the gas exchange rate inside the respiratory system malfunctions. 13 , 14
In the present study, we aim to understand the chain of events after the SARS‐CoV‐2 virus invaded the human body, creating chaos in the respiratory system, thermostat control, and multiple organ failure systematic networks using the knowledge‐based cybernetic model. The benefit of using the cybernetic model is mainly its ability to analyze the capacities and limits of systems components. Virus and its host are within the same system.
In the next section, schematic diagrams (Figures 2, 3, 4, 5) show the network of events that leads to cytokine storm, ARDS, loss of thermostat control, and multiple organ failure.
FIGURE 2.
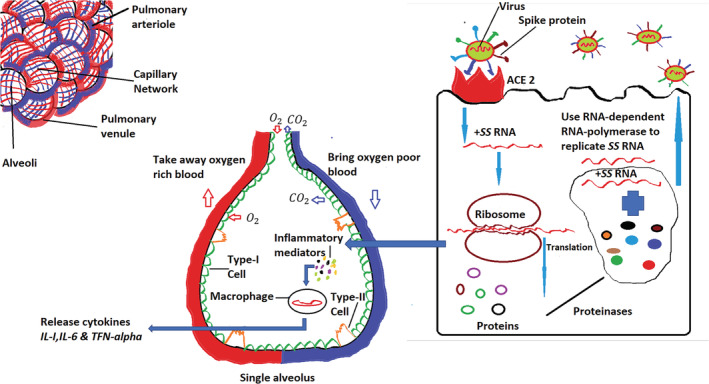
Explains the ways how the virus invades the human respiratory system and uses the existing mechanism of alveolus to replicate its +SS RNA and virus proliferation, inflammatory materials, and cytokines productions 15
FIGURE 3.
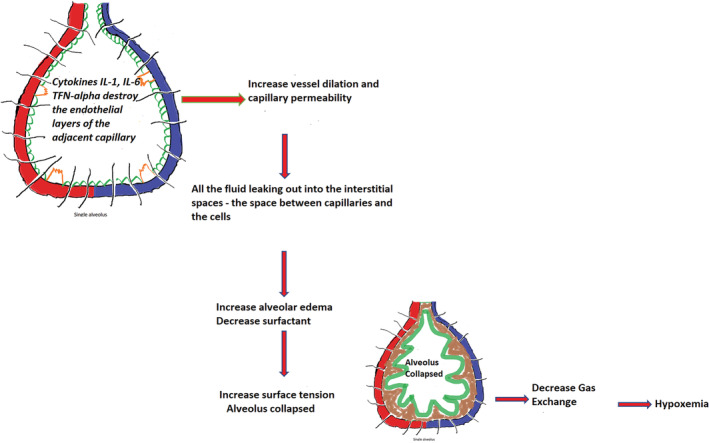
Explains the collapsing process of a single alveolus
FIGURE 4.
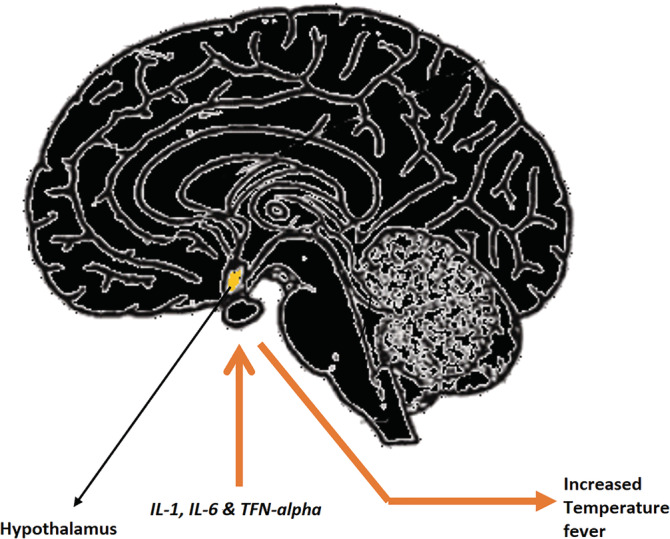
Cytokines instigate hypothalamus
FIGURE 5.
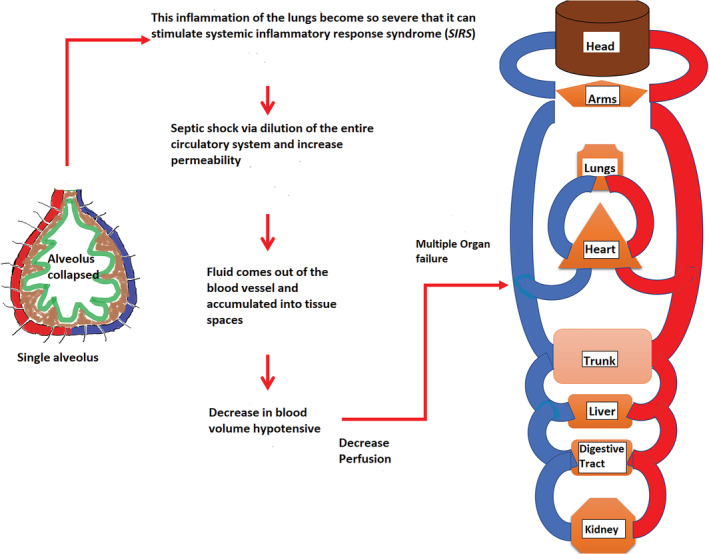
Demonstrates the sequence of activities leading to multiple organ failure due to severe inflammation of lungs through systematic inflammatory response syndrome (SIRS), and blood volume decreased
The model analysis then suggests to experimentalists possible measures to control these parameters for a better therapeutic outcome.
2. PATHOPHYSIOLOGY
In this section, we will discuss the functional pathophysiological changes associated with the human body system as a result of SARS‐CoV‐2 viral infection. Detailed studies on how Covid‐19 affect the host body systems, causing functional changes that can lead to serious health consequences, will be discussed in Figures 2, 3, 4, 5.
Figure 2 illustrates the network of sequential events after virus enters the lungs through respiratory channels. The virus takes advantage of the ACE‐2 receptor of the type‐II cell inside the alveolus by using its particular spike proteins to introduce its single‐stranded RNA (SS RNA) inside the cell 15 and using the cell's existing translation mechanisms to produce different types of proteins. The positive sense (+SS) RNA of the virus then uses the host cell RNA‐dependent RNA‐polymerase to replicate itself. With the help of proteinases, the newly formed proteins, together with nascent + SS RNA, creates a new virus by budding out of the type‐II cell. In this process, the virus replicates itself significantly in numbers, ultimately destroying the host cell. As a result, the host cell produces and releases inflammatory mediators that trigger alveolar macrophages to release cytokines including IL‐1, IL‐6, and TFN‐α. 16 , 17 , 18 , 19
Figure 3 shows that the released cytokines IL‐1, IL‐6, and TFN‐α travel toward the capillary around the alveolus and destroy the endothelial layer inside it that promotes vessel dilation and increases the capillary permeability. As a result, fluid leaks out into the interstitial space (space between capillaries and the cells). This alveolar edema reduces the production of surfactants and increases surface tension, leading to alveolar collapse and impaired gas exchange mechanism. Patients infected with the virus experience a severe symptom of hypoxemia. Many alveoli become filled up with debris that includes interstitial fluid, macrophages, different proteins, damaged type‐I, type‐II cells, and some neutrophils resulting in consolidation of the alveolus which alters gas exchange and work of breathing (WOB). 20
In Figure 4, the excess cytokines (IL‐1, IL‐6, and TNF‐ α ) travel to the hypothalamus through the blood vessel and direct it to reset the body temperature to a higher level (fever).
The consolidation and accumulation of alveolar debris inside alveoli produces mucus that stimulates coughing. Covid‐19 patients with hypoxemia and increased WOB decrease the partial pressure of oxygen (O 2) so stimulating the formation of chemoreceptors, which then trigger the sympathetic nervous system (SNS) to increase heart rate (HR) and increase respiratory rate (RR).
Figure 5 shows if the lung inflammation is severe, it can leach out into the bloodstream and stimulate systemic inflammatory response syndrome (SIRS), sometimes progressing to the point of septic shock. This causes vessel dilation and increased permeability allowing plasma fluid to leak into tissue space, decreasing blood volume and triggering hypotension. This decrease in perfusion may eventually lead to multiple organ failure 20 .
3. SYSTEMIC APPROACH
Based on the facts discussed above, we develop a simple schematic diagram (Figure 6) with accompanying mathematical model using a very simplistic cybernetic approach. It shows that the single RNA strand of the SARS‐CoV‐2 virus uses type‐II cells of the alveolus for its replication. At the same time, it uses existing cellular mechanisms inside the host cell to proliferate in significant numbers. The newly formed virus then escapes the host cell and targets another type‐II cell in different or same alveolus. During this process, the type‐II cell also produces inflammatory mediators that stimulate the macrophage inside the alveolus. As a result, different types of interleukins forms, such as IL‐1, IL‐6, and TNF‐ α.
FIGURE 6.
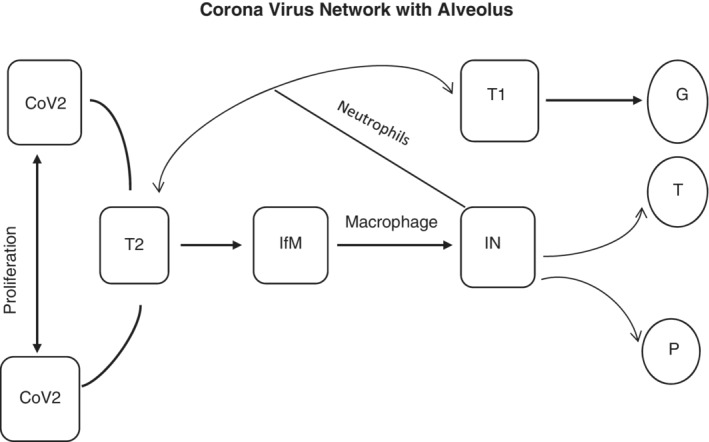
Cybernetic scheme of the system after SARS‐CoV‐2 virus interacts with a human immune system where CoV2 = Corona Virus, T1 = Type one cell within single alveolus, T2 = Type two cell within single alveolus, IfM = Inflammatory Mediators, IN = Different Interleukins, GE = Gas Exchange, TH = Thermostat control, and PD = Pressure Difference
Interleukins then dilate the endothelial layers of the adjacent blood vessel and increase permeability, triggering a cytokine storm and damaging both type‐I and type‐II cells eventually destroying the entire alveolus. Due to the loss of type‐I and type‐II cells, the gas exchange mechanism inside the respiratory system becomes dysfunctional. It affects the central nervous system through the hypothalamus because of its anterior connection to the blood vessel, which is full of excessive interleukins. As a result, the hypothalamus sets up a new thermostat control temperature. Due to cytokine storm as well as massive, excessive interleukin production, there could be enormous damage to the blood vessels of the entire body (dilation) that creates a pressure difference.
4. CYBERNETIC MODEL OF THE VIRUS DYNAMICS
The proposed mathematical model based on the above schematic network diagram is as follows:
| (1) |
| (2) |
| (3) |
| (4) |
| (5) |
| (6) |
| (7) |
| (8) |
where t stands for time in days, T 1 , T 2 , CoV 2, If M , and I N represent state variables as type‐I cell, type‐II cell, SARS‐CoV‐2 virus, inflammatory mediators, interleukin concentrations, respectively, at time t . The other variables are G E , T H , and P D gas exchange rate, thermostat temperature, and pressure difference at time t . α 1 and α 2 are the growth rate of type‐I and type‐II cells. In an adult lung, type II cells transmute into type I cells. 13 α 3 is the rate at which CoV 2 in contact with the type‐II cells for its replication and proliferation. α 4 is the rate at which CoV 2 is producing inflammatory mediators using type‐II cells. α 5 is the rate at which inflammatory materials stimulate the macrophage to produce different types of interleukins. Ψ represents the average amount of gas intake and outlet by a normal human without any respiratory problem. Ω is the initial temperature for the healthy human as set by the thermostat and ∑ is the mean area pressure in blood vessels for a healthy individual without Covid‐19. Crossby et al reported that early onset of SARS‐CoV‐2 virus rapid replication may cause apoptosis. 21 μ 1 and μ 2 represent the rate of apoptosis for type‐I and type‐II cells. δ 1 stands for the rate at which cytokine storm destroys type‐I cells inside alveolus. β 3, β 4, β 5, β 6 , β 7 , and β 8 are natural degradation factor parameters.
5. MODEL ANALYSIS
The system described in Equations (1) to (8) is not a simultaneous system. It means each event in the virus and host interactions are happening sequentially. Therefore, it is reasonable to identify that there exists a pseudo‐steady‐state within the system. Equations (2) to (4) demonstrate the dynamics of type‐II cell, SARS‐CoV‐2 virus, and inflammatory materials within a single alveolus. These are the three primary events inside alveolus that ignite the whole process leading to the chaos of the cytokine storm, ARDS, thermostat control, and multiple organ failure after the variables T 2 , CoV2, If M reach its equilibrium values (steady state). It is an intermediate steady state, we call it pseudo‐steady‐state .
| (9) |
The next events in the sequence are the dynamics of interleukins and type‐I cells. The solution of Equations (5) and (2) is
| (10) |
+
| (11) |
where baseline initial number of interleukins and type‐I cells (steady state) within an alveolus in normal situation before any SARS‐CoV‐2 virus enters.
Using Equation (10) in Equations (6) to (8), we have the following system:
| (12) |
| (13) |
| (14) |
From Equation (10) we recognize cytokines that can trigger the chaos under certain conditions. We define the term as the pivotal element that can stabilize or destabilize the system under certain conditions.
| (15) |
Cytokine concentrations will be decreasing in time. Eventually, body will not experience further complications even if person is infected with the virus.
| (16) |
As time increases, cytokine concentrations will be heading toward their initial values, the state where there is no infection.
| (17) |
This is the chaotic condition; cytokine storm is inevitable if this condition is fulfilled.
The time‐dependent solution to Equations (12) to (14) is as follows:
| (18) |
| (19) |
| (20) |
where and C GE , C TH and C PD are the integrating constants.
6. BIO‐REGULARITY SIMULATION
A challenge in this simulation approach is parameter estimation. Due to the limited availability of data among humans, a mathematical association was necessary between different biological molecule abundance data characterizing the interactions of SARS‐CoV‐2 in animal models.
Bove et al 22 observed approximately 31 population doublings for alveolar type‐II cell by 63 days after original seeding with base media alone or with feeder cells and a pharmacological inhibitor of the Rho kinase signaling pathway. Human alveolar type‐II cells plated with base media alone did not proliferate. Assuming the exponential growth model A t = A 0 e λt , where A t and A 0 are the final and initial population, we estimated a domain for the growth rate as 0.0545 < α 2 < 0.3466.
Alveolar type‐II cells in vitro quickly transdifferentiate on a default pathway into nonproliferative alveolar type‐I‐like cells under traditional culture conditions 22 . Zhao et al 23 observed in animal models that the transforming growth factor‐β (TGF‐β) and bone morphogenetic protein (BMP) are at inverse relationships during type‐II cells transdifferentiating into type‐I cells. Based on their experimental data with mathematical assumption of exponential growth or transdifferentiating phenomenon, we estimated it as 0.2682 < α 1 < 0.6824.
Apoptosis rate parameters for type‐I and type‐II cells are calculated in the same way as above from experimental work on alveolar epithelial type II cells on animal models. 21
The experimental work of Kim et al 24 on male and female ferret models infected with the coronavirus collected from Covid‐19 confirmed patient in Korea helps us to estimate the growth rate of SARS‐CoV‐2. The estimation technique is the same as described above. The inflammatory mediator growth rate has been estimated from the experimental results on chronic intermittent hypoxia of male mice over 4 weeks. 25 Interleukin production rate was estimated based on the experimental results of Channappanavar and Perlman. 26 The gas exchange rate was estimated based on the human lung's consumption of oxygen ( O 2). In an inactive state, a normal human can consume about 5 to 6 mL per minute at 28° C esophagus temperature. 27 The thermostat control threshold parameter is assumed to be between 37°C < Ω < 41°C 24 . The pressure difference constant is the mean area pressure represents the average pressure (force) that drives blood into the vessels. 28
It is equivalent to
The estimation of degradation parameters needs a substantial amount of experimental data. At this stage, there is very limited or nonavailability of experimental data on which one can estimate the degradation parameters. Therefore, baseline values are the only options for all the degradation parameters = 3,….,8.
7. IN SILICO RESULTS
A mathematical framework has been presented, which characterizes the biokinetic mechanism of SARS‐CoV‐2 virus and alveoli and the surrounding environment that includes blood vessels around it and other organs in the body. The overall impact of the virus influences the fundamental regulation of the host immune system, which leads to a cytokine storm under certain situations, heading toward an instability of the entire body by altering homeostasis drastically, which is chaotic.
The intermediate steady state of type‐II cells, SARS‐CoV‐2, and inflammatory mediators, known as the pseudo‐steady‐state, play a crucial role in these dynamics.
The pseudo‐steady‐state .
Figure 7 shows the pseudo‐steady‐state of type‐II cells, SARS‐CoV‐2, and inflammatory mediators depending upon the different parameter values within its specified domains, as mentioned in Table 1. It indicates that as the viral load in the steady‐state increase, the type‐II cell steady‐state values decrease, and inflammatory mediators steady values increase.
FIGURE 7.
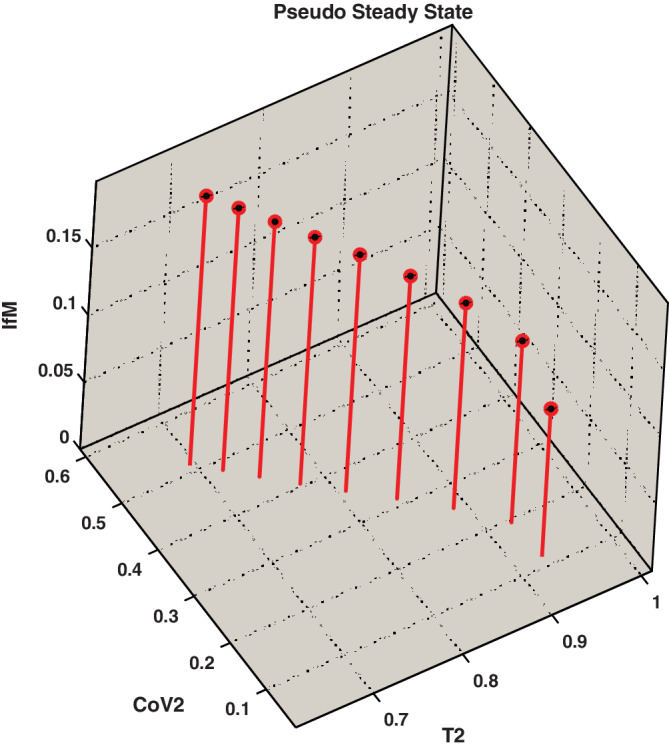
Existence of pseudo‐steady‐state for type‐II cells, SARS‐CoV‐2 virus, and inflammatory mediators for different parameter values within the allowable domains as specified in Table 1
TABLE 1.
Parametric input values of the presented cybernetic model as derived from in vivo sparse data
| Parameters | Range | Units | Source |
|---|---|---|---|
| Growth rate of type‐I cells | 0.2682 < α 1 < 0.6824 | Per day | Reference [23] |
| Growth rate of type‐II cells | 0.0545 < α 2 < 0.3466 | Per day |
Reference [22] |
| Apoptosis rate of type‐I cell | 0.4274 < μ 1 < 0.5680 | Per day | Reference [21] |
| Apoptosis rate of type‐II cells | 0.4274 < μ 2 < 0.5680 | Per day | Reference [21] |
| Growth rate CoV 2 | 0.0908 < α 3 < 2.5175 | Per day | Reference [24] |
| Production rate of inflammatory mediators | 0.0100 < α 4 < 0.0145 | Per day | Reference [25] |
| Production rate of interleukins | 1.3271 < α 5 < 2.1060 | Per day | Reference [26] |
| Gas exchange rate Ψ | 7.2 < Ψ < 8.64 | L/day | Reference [27] |
| Thermostat threshold Ω | 37 < Ω < 41 | °C | Reference [24] |
| Mean area pressure ∑ | 93.33 | mm Hg | Reference [28] |
In Figure 8, two different scenarios are observed for , interleukin concentration is very high within a short period that leads to the possibility of cytokine storm eventually causing further damage to the body. On the other hand, if , the interleukin concentration gradually diminishes, and further damage to the body may be avoidable. For , interleukin concentration remains in the same state as .
FIGURE 8.
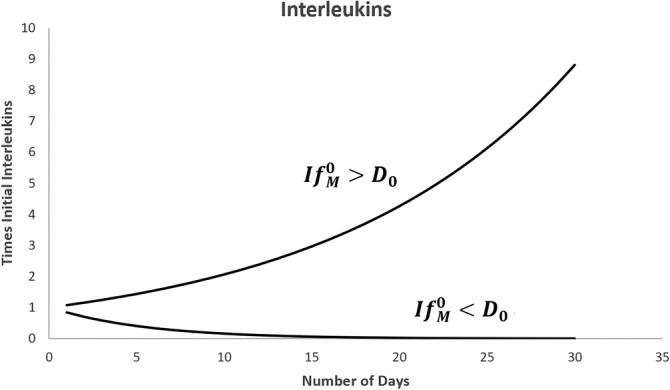
Growth curve of Interleukins for time in days in two different situations, namely and , where and is the initial interleukins concentration when there is no virus infection
Next, we will look at the gas exchange rate of the virus‐infected body in two scenarios and . For , it has been observed that the initial gas exchange rate is down to certain levels for the first few days, but eventually, it raises again to normal with 14 days. It indicates that if the inflammatory mediators concentrations are less than a certain threshold ( D 0), then the amount of interleukins it can produce from macrophages is not capable of long‐term and severe damage to the adjacent capillaries around the alveoli inside lungs (Figure 9).
FIGURE 9.
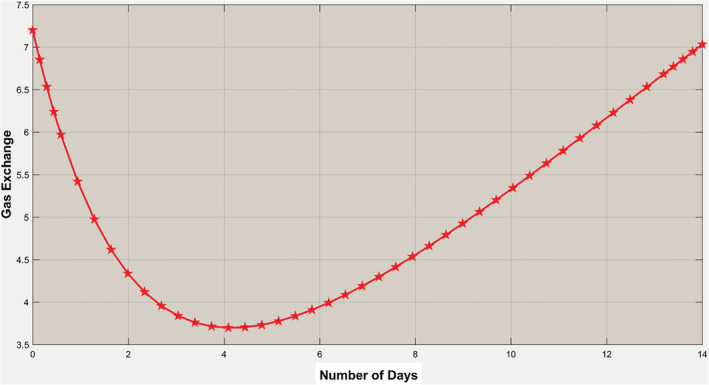
Gas exchange rate when . Although it shows the exchange rate is going down initially, it is eventually coming back to normal within a few days
In the case when , it has been observed that the gas exchange rate is continuously going down to a very minimal point in 14 days. It indicates that if the inflammatory mediators concentrations are greater than a certain threshold ( D 0), then the amount of interleukins it can produce from macrophages is capable of doing severe damage to the adjacent capillaries around the alveoli inside lungs. It will eventually ignite the possibility of a cytokine storm, and the body will experience extreme hypoxemia (Figure 10).
FIGURE 10.
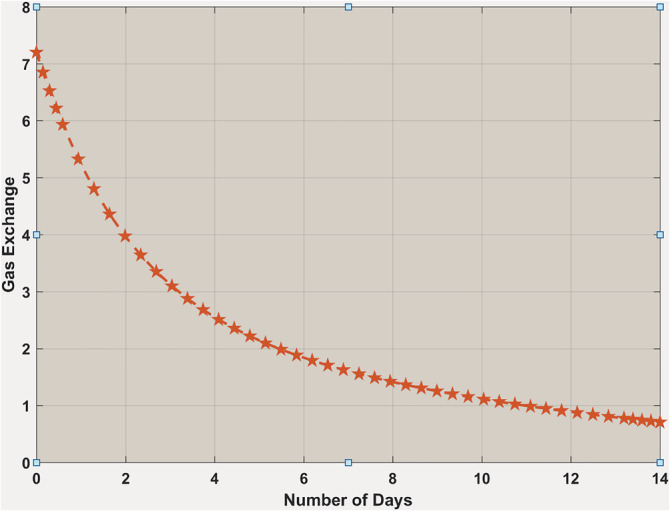
Gas exchange rate when . It is showing that the exchange rate is continuously going down much below the expected level of the body's gas exchange rate
Thermostat control shows two different temperature setups for and . In the case of , interleukins did not create a massive peak to reset the body's temperature too high. From Figure 11, one can see it picks up initially a little high and then comes back to the normal body temperature. On the other hand, when , the situation is different (Figure 12) because the body's temperature is continuously increasing to its highest levels. It means the production of interleukins is so high that it starts damaging the blood vessels around the body, which influences the hypothalamus to reset the temperature to a new high.
FIGURE 11.
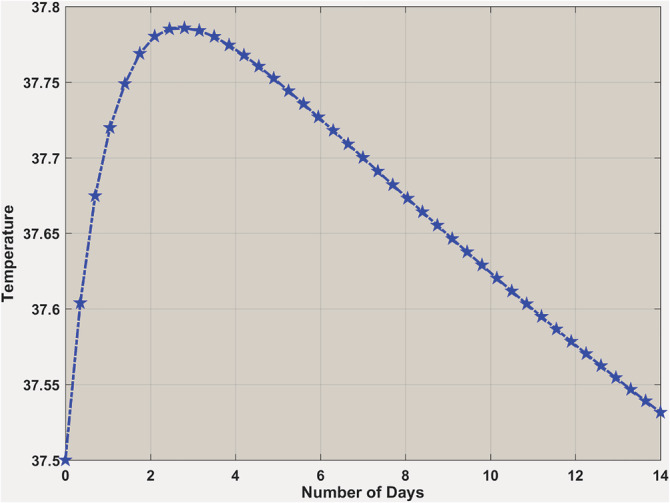
Body temperature when . Body temperature is going up slightly in the beginning, and then it is coming down to normal within 14 days
FIGURE 12.
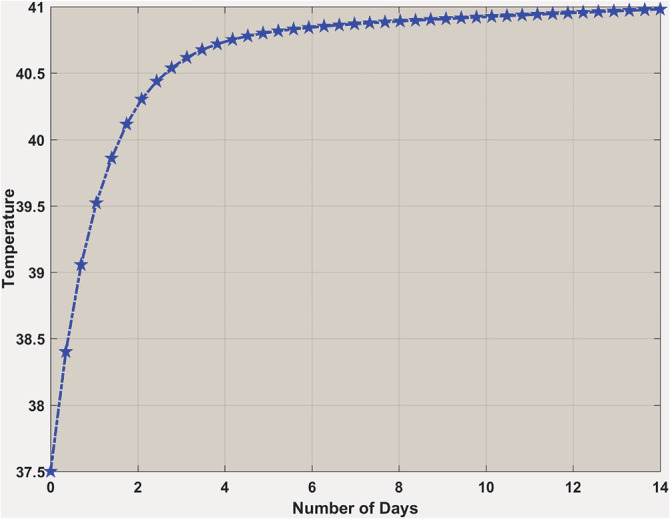
Body temperature when . Body temperature is going up vigorously within a short period
Now we want to see the pressure difference for and . Figure 13 shows if , an increase of mean area pressure for an initial few days, when it comes down to its normal within 14 days. It means that there is minimal damage to the blood circulatory system by interleukins. The body remains into its normal state with 14 days, even if a virus infects it.
FIGURE 13.
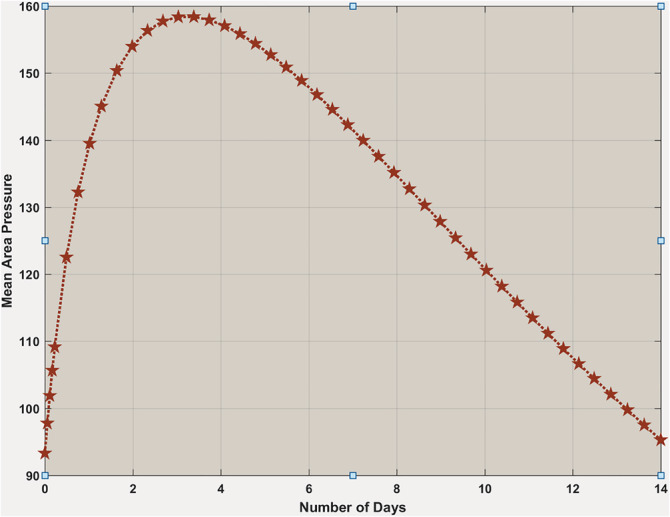
Body's mean area pressure when . Mean area pressure is going up a bit in the beginning, and then it is coming down to the normal within 14 days
Figure 14 shows a continuous fall of mean area pressure in the blood circulatory system when within 14 days. It means that there is very severe damage to the blood circulatory system by interleukins due to cytokine storm that may incur further damage to other organs inside the body.
FIGURE 14.
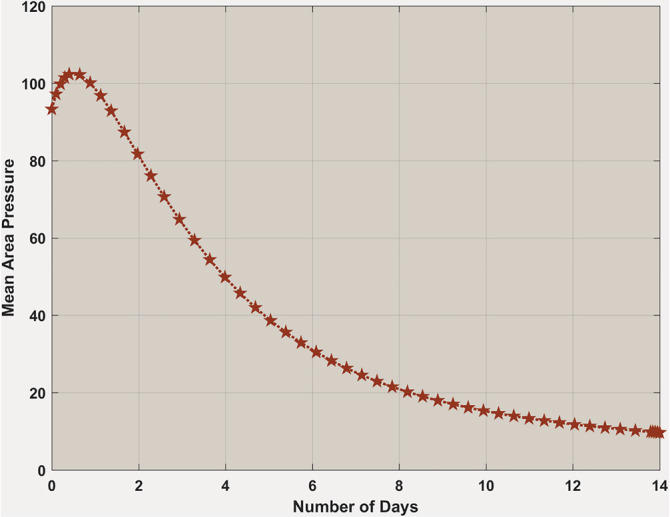
Body's mean area pressure when . Mean area pressure is continuously going down significantly within 14 days
8. PERSPECTIVE
The enormous complexity of viral dynamics and burgeoning volumes of laboratory data pose a real challenge to researchers in biology and healthcare to assimilate it as real knowledge to tackle the infection. 29 Cybernetical approach with system dynamical modeling can provide an intellectual framework that can transform data into knowledge. It may be one of the many ways to understand the dynamics of the virus.
This model provides a fundamental foundation in developing therapies for Covid‐19 patients. It can be suggested that implementing an anti‐inflammatory or antiviral therapy may help in preventing further injury. 30 In general, the prognosis and recovery from Covid‐19 in its critical stages are poor. Prompt recognition of Covid‐19 and application of therapies such as anti‐inflammatory and anti‐viral modalities are likely to limit disease pathogenesis and improve clinical outcomes of Covid‐19. The time period in which anti‐inflammatory treatments can be successfully administered to patients is currently unknown. However, prompt initiation of treatment is essential as an early response preventative measure for Covid‐19 pathogenesis in patients. This model examines the relationship between time and the onset of physiological outcomes. Hence, experimentalists are able to use this model as a platform to examine the most effective time window to administer therapies such as anti‐inflammation therapy to patients. Further analysis can suggest when the subsequent duration of treatment to optimize favorable outcomes.
CONFLICT OF INTEREST
The authors have no competing interest.
ACKNOWLEDGMENTS
The authors acknowledge the technical assistance of Professor S. N. Sarbadhikari, Expert member, Roster for Digital Health, World Health Organization (WHO) and Professor Paul Griffiths, Professor of Virology, University College London for reviewing and editing.
Saha A, Saha B. Novel coronavirus SARS‐CoV‐2 (Covid‐19) dynamics inside the human body. Rev Med Virol. 2020;30:e2140. 10.1002/rmv.2140
Funding information University College London; World Health Organization
REFERENCES
- 1. Müller O, Neuhann F, Razum O. Epidemiology and control of COVID‐19. Dtsch Med Wochenschr. 2020;145:670‐674. 10.1055/a-1162-1987. [Epub ahead of print. [DOI] [PMC free article] [PubMed] [Google Scholar]
- 2.WHO situation Report 115, https://www.who.int/docs/default-source/coronaviruse/situation-reports/20200612-covid-19-sitrep-144.pdf?sfvrsn=66ff9f4f_2. Accessed 12 June 2020.
- 3.WebMD, https://www.webmd.com/lung/coronavirus-transmission-overview#3. Accessed 01 May 2020.
- 4.WHO, COVID‐19 Virtual Press Conference, May 13, 2020. https://www.who.int/docs/default-source/coronaviruse/transcripts/who-pressconference-13may2020.pdf?sfvrsn=ee0d2cde_2. Accessed 15 May 2020.
- 5. Chen TM, Rui J, Wang QP, Zhao ZY, Cui JA, Yin L. A mathematical model for simulating the phase‐based transmissibility of a novel coronavirus. Infect Dis Poverty. 2020;9:24. 10.1186/s40249-020-00640-3. [DOI] [PMC free article] [PubMed] [Google Scholar]
- 6. Wu JT, Leung K, Leung GM. Nowcasting and forecasting the potential domestic and international spread of the 2019‐nCoV outbreak originating in Wuhan, China: a modelling study. Lancet. 2020;395(10225):689‐697. [DOI] [PMC free article] [PubMed] [Google Scholar]
- 7. Kissler SM, Tedijanto C, Goldstein E, Grad YH, Lipsitch M. Projecting the transmission dynamics of SARS‐CoV‐2 through the postpandemic period. Science. 2020;368(6493):860–868. 10.1126/science.abb5793. [DOI] [PMC free article] [PubMed] [Google Scholar]
- 8. Laura Geggel L. SARS‐CoV‐2 may be exploiting our immune system's 'first responder' cells. Live Sci. 2020; https://www.livescience.com/coronavirus-immune-interferon-response.html. [Google Scholar]
- 9. Guan W, Ni Z, Huet Y, et al. Clinical characteristics of coronavirus disease 2019 in China. New Engl J Med. 2020;382(18):1708‐1720. [DOI] [PMC free article] [PubMed] [Google Scholar]
- 10. Pung R, Chiew CJ, Young BE, et al. Investigation of three clusters of COVID‐19 in Singapore: implications for surveillance and response measures. Lancet. 2020;395:1039‐1046. [DOI] [PMC free article] [PubMed] [Google Scholar]
- 11. Lauer SA, Grantz KH, Bi Q, et al. The incubation period of coronavirus disease 2019 (COVID‐19) from publicly reported confirmed cases: estimation and application. Ann Intern Med. 2020;172:577‐582. 10.7326/M20-0504. [DOI] [PMC free article] [PubMed] [Google Scholar]
- 12. Li Q, Guan X, Wu P, et al. Early transmission dynamics in Wuhan, China, of novel coronavirus‐infected pneumonia. N Engl J Med. 2020;382:1199‐1207. [DOI] [PMC free article] [PubMed] [Google Scholar]
- 13. Huang C, Wang Y, Liet X, et al. Clinical features of patients infected with 2019 novel coronavirus in Wuhan, China. Lancet. 2020;395:497‐506. [DOI] [PMC free article] [PubMed] [Google Scholar]
- 14. Chen G, Wu D, Guo W, et al. Clinical and immunologic features of severe and moderate coronavirus disease. J Clin Invest. 2019;130(5):2620‐2629. 10.1172/jci137244. [DOI] [PMC free article] [PubMed] [Google Scholar]
- 15. Mason RJ. Pathogenesis of COVID‐19 from a cell biologic perspective. Eur Respir J. 2020;55:2000607. 10.1183/13993003.00607-2020. [DOI] [PMC free article] [PubMed] [Google Scholar]
- 16. Tang NL, Chan PK, Wong CK, et al. Early enhanced expression of interferon‐inducible protein‐10 (CXCL‐10) and other chemokines predicts adverse outcome in severe acute respiratory syndrome. Clin Chem. 2005;51(12):2333‐2340. [DOI] [PMC free article] [PubMed] [Google Scholar]
- 17. Hancock AS, Stairiker CJ, Boesteanu AC, et al. Transcriptome analysis of infected and bystander type 2 alveolar epithelial cells during influenza a virus infection reveals in vivo Wnt pathway Downregulation. J Virol. 2018;92(21):92. 10.1128/JVI.01325-18. [DOI] [PMC free article] [PubMed] [Google Scholar]
- 18. Qian Z, Travanty EA, Oko L, et al. Innate immune response of human alveolar type II cells infected with severe acute respiratory syndrome‐coronavirus. Am J Respir Cell Mol Biol. 2013;48(6):742‐748. [DOI] [PMC free article] [PubMed] [Google Scholar]
- 19. Wang J, Nikrad MP, Phang T, et al. Innate immune response to influenza a virus in differentiated human alveolar type II cells. Am J Respir Cell Mol Biol. 2011;45(3):582‐591. [DOI] [PMC free article] [PubMed] [Google Scholar]
- 20. Guite H, COVID‐19: what happens inside the body? Medical News Today 2020. April 20, 2020. https://www.medicalnewstoday.com/articles/covid-19-what-happens-inside-the-body. Accessed 25 April 2020
- 21. Crosby LM, Luellen C, Zhang Z, Tague LL, Sinclair SE, Waters CM. Balance of life and death in alveolar epithelial type II cells: proliferation, apoptosis, and the effects of cyclic stretch on wound healing. Am J Physiol Lung Cell Mol Physiol. 2011;301(4):L536‐L546. 10.1152/ajplung.00371.2010. [DOI] [PMC free article] [PubMed] [Google Scholar]
- 22. Bove PF, Dang H, Cheluvaraju C, et al. Breaking the in vitro alveolar type II cell proliferation barrier while retaining ion transport properties. Am J Respir Cell Mol Biol. 2014;50(4):767‐776. 10.1165/rcmb.2013-0071OC. [DOI] [PMC free article] [PubMed] [Google Scholar]
- 23. Zhao L, Yee M, O'Reilly MA. Transdifferentiation of alveolar epithelial type II to type I cells is controlled by opposing TGF‐β and BMP signalling. Am J Physiol Lung Cell Mol Physiol. 2013;305(6):L409‐L418. 10.1152/ajplung.00032.2013. [DOI] [PMC free article] [PubMed] [Google Scholar]
- 24. Kim Y‐II, Kim SG, Kim SM, et al. Infection and rapid transmission of SARS‐CoV‐2 in ferrets. Cell Host Microbe. 2020;27:704‐709.e2. 10.1016/j.chom.2020.03.023 (In Press). [DOI] [PMC free article] [PubMed] [Google Scholar]
- 25. Lee EJ, Heo W, Kim JY, et al. Alteration of inflammatory mediators in the upper and lower airways under chronic intermittent hypoxia: preliminary animal study. Mediators Inflamm. 2017;2017:4327237. 10.1155/2017/4327237. [DOI] [PMC free article] [PubMed] [Google Scholar]
- 26. Channappanavar R, Perlman S. Evaluation of activation and inflammatory activity of myeloid cells during pathogenic human coronavirus infection. In: Vijay R, ed. MERS Coronavirus: Methods and Protocols, Methods in Molecular Biology. New York, US: Springer Science+Business Media, LLC, part of Springer Nature; 2020. [DOI] [PMC free article] [PubMed] [Google Scholar]
- 27. Loer SA, Scheeren TW, Tarnow J. How much oxygen does the human lung consume? Anesthesiology. 1997;86(3):532‐537. [DOI] [PubMed] [Google Scholar]
- 28. https://courses.lumenlearning.com/suny-ap2/chapter/blood-flow-blood-pressure-and-resistance-no-content/. Accessed 01 May 2020.
- 29. Webster G. Biologists flirt with models. Drug Discov World. 2009;10(2):53‐58. [Google Scholar]
- 30. Zhang W, Zhao Y, Zhang F, et al. The use of anti‐inflammatory drugs in the treatment of people with severe coronavirus disease 2019 (COVID‐19): the perspectives of clinical immunologists from China. Clin Immunol. 2020;214:108393. 10.1016/j.clim.2020.108393. [DOI] [PMC free article] [PubMed] [Google Scholar]


