

Abstract
Background
The coronavirus disease 2019 (COVID‐19) has become a global pandemic, with 10%‐20% of severe cases and over 508 000 deaths worldwide.
Objective
This study aims to address the risk factors associated with the severity of COVID‐19 patients and the mortality of severe patients.
Methods
289 hospitalized laboratory‐confirmed COVID‐19 patients were included in this study. Electronic medical records, including patient demographics, clinical manifestation, comorbidities, laboratory tests results, and radiological materials, were collected and analyzed. According to the severity and outcomes of the patients, they were divided into three groups: nonsurvived (n = 49), survived severe (n = 78), and nonsevere (n = 162) groups. Clinical, laboratory, and radiological data were compared among these groups. Principal component analysis (PCA) was applied to reduce the dimensionality and visualize the patients on a low‐dimensional space. Correlations between clinical, radiological, and laboratory parameters were investigated. Univariate and multivariate logistic regression methods were used to determine the risk factors associated with mortality in severe patients. Longitudinal changes of laboratory findings of survived severe cases and nonsurvived cases during hospital stay were also collected.
Results
Of the 289 patients, the median age was 57 years (range, 22‐88) and 155 (53.4%) patients were male. As of the final follow‐up date of this study, 240 (83.0%) patients were discharged from the hospital and 49 (17.0%) patients died. Elder age, underlying comorbidities, and increased laboratory variables, such as leukocyte count, neutrophil count, neutrophil‐to‐lymphocyte ratio (NLR), C‐reactive protein (CRP), procalcitonin (PCT), D‐dimer, alanine aminotransferase (ALT), aspartate aminotransferase (AST), and blood urea nitrogen (BUN) on admission, were found in survived severe cases compared to nonsevere cases. According to the multivariate logistic regression analysis, elder age, a higher number of affected lobes, elevated CRP levels on admission, increased prevalence of chest tightness/dyspnea, and smoking history were independent risk factors for death of severe patients. A trajectory in PCA was observed from "nonsevere" toward "nonsurvived" via "severe and survived" patients. Strong correlations between the age of patients, the affected lobe numbers, and laboratory variables were identified. Dynamic changes of laboratory findings of survived severe cases and nonsurvived cases during hospital stay showed that continuing increase of leukocytes and neutrophil count, sustained lymphopenia and eosinopenia, progressing decrease in platelet count, as well as high levels of NLR, CRP, PCT, AST, BUN, and serum creatinine were associated with in‐hospital death.
Conclusions
Survived severe and nonsurvived COVID‐19 patients had distinct clinical and laboratory characteristics, which were separated by principle component analysis. Elder age, increased number of affected lobes, higher levels of serum CRP, chest tightness/dyspnea, and smoking history were risk factors for mortality of severe COVID‐19 patients. Longitudinal changes of laboratory findings may be helpful in predicting disease progression and clinical outcome of severe patients.
Keywords: clinical characteristics, coronavirus disease 2019, mortality, risk factors, severity
This study compares the clinical, radiological, and laboratory characteristicsand longitudinal variations in laboratory parameters of the 289 hospitalized patients with COVID‐19 with different severity and clinical outcomes. We propose that elder age, a greater number of affected lobe(s), elevated C‐CRP level and increased prevalence of chest tightness/dyspnea and smoking history may be associated with the fatal outcome of patients with severe COVID‐19. We identify strong correlations between age, affected lobe numbers, and laboratory variables. Abbreviations: BUN, blood urea nitrogen; COVID‐19, coronavirus infectious disease 2019; CRP, C‐reactive protein; NLR, neutrophil‐to‐leucocyte ratio; PC1/2, principal component 1/2; PCT, procalcitonin.
1. INTRODUCTION
The coronavirus disease 2019 (COVID‐19) pandemic, an infectious disease caused by a novel strain of human coronavirus, the severe acute respiratory syndrome coronavirus 2 (SARS‐CoV‐2), 1 has become the focus of attention worldwide. Since its first report in late December 2019 in Wuhan, China, 2 COVID‐19 has aggressively spread across the world and dramatically impacted people's health and daily life. As of July 1, 2020, according to the Situation Report issued by the World Health Organization (WHO), the number of confirmed COVID‐19 cases reported in over two hundred regions exceeded 10.3 million with around 508 000 deaths. 3 The clinical patterns of COVID‐19 ranged from asymptomatic cases to critically ill patients. 4 Fever, dry cough, and radiological changes in lungs tend to be common clinical manifestations in COVID‐19 patients. Severe viral pneumonia with respiratory failure and the deterioration of underlying diseases are the main cause of death in severe patients. According to data provided by the China National Health Commission, the mortality rate of COVID‐19 patients was 7.7% in Wuhan, 5 which was higher than the world average (4.9%). 3
As the number of infected and fatal cases is rising across the globe, there is a pressing need to investigate the clinical, radiological, and laboratory characteristics, and more importantly, the mortality risk factors in severe COVID‐19 patients. Our previous study found that higher levels of C‐reactive proteins (CRP), D‐dimer, and procalcitonin (PCT) were associated with severe patients when compared to nonsevere patients. 6 However, the mortality risk factors of COVID‐19 patients have not yet been previously reported in detail. Elder age, comorbidities, leukocytosis, high levels of D‐dimer, lactate dehydratase (LDH), and low platelet counts were reported to be risk factors associated with in‐hospital death of severe patients. 7 , 8 , 9 , 10 , 11 Due to the distinct criteria used for severe and/or critically ill patients, the predictive value of these risk factors for death in severe patients may vary.
The aim of this study is to compare the clinical, radiological, and laboratory characteristics, and longitudinal variations in laboratory parameters of 289 hospitalized patients with COVID‐19 with different severities and clinical outcomes. Potential risk factors and clinical findings associated with death in severe COVID‐19 patients were analyzed.
2. METHODS
2.1. Study design and patients’ enrollment
Adult hospitalized patients admitted to Zhongnan hospital of Wuhan University (n = 178) and No.7 hospital of Wuhan (n = 241) (admission date between December 29, 2019 and February 16, 2020) diagnosed as “viral pneumonia” according to clinical symptoms and chest CT images were primarily enrolled in this study. 289 patients with positive real‐time reverse transcription‐polymerase chain reaction (rRT‐PCR) results of SARS‐CoV‐2 nucleic acid test were diagnosed as COVID‐19 and included in the analysis set. According to the disease severity and clinical outcome, these patients were divided into three groups: nonsurvived, survived severe, and nonsevere. All the patients were treated following the guidelines issued by the China National Health Commission (trial version 3‐5). 12 General treatments included supportive therapy, anti‐viral agents (eg, Arbidol, Oseltamivir, and Lopinavir/Ritonavir) and oxygen supplementation. Critically ill patients were admitted to an intensive care unit (ICU) and supported by intubation and mechanical ventilation. In accordance with the criteria stated in the clinical guidelines for hospital discharge of a COVID‐19 patient, 13 all the following four conditions should be met: (a) normal temperature lasting longer than 3 days, (b) significantly improved respiratory symptoms, (c) substantially improved acute exudative lesions on chest CT images, and (d) two consecutive negative nucleic acid test results of respiratory tract samples (at least 24 hours apart). It should be noted that part of the clinical data of these patients has been previously reported as a Letter to Editor in the journal Allergy, but it only focused on the differences in clinical characteristics between patients with initially negative and then positive nucleic acid results for SARS‐CoV‐2. 6 , 14 This study was approved by the Zhongnan Hospital of Wuhan University institutional ethics board (No. 2020015 and No. 2020028).
2.2. Data collection
The electronic medical records of each patient were extracted and analyzed by four independent researchers with a standardized data collection form. Patients’ demographic and baseline characteristics (including age, sex, exposure history, comorbidities, surgery history, and smoking history), symptomatic and radiological characteristics [including signs and symptoms, and chest computed tomography (CT) results], as well as the laboratory findings on admission (including complete blood cells counts and percentages, and biochemical parameters), and follow‐up data of laboratory parameters in severe survived and nonsurvived patients were obtained and analyzed. The clinical outcome of each patient (ie, nonsurvived, discharged, or remained in hospital) as of March 28, 2020 (final follow‐up date) and the time intervals of initial onset of symptoms (ie, the day when the symptoms were noticed) to hospital admission for each patient were also recorded.
Information was collected regarding disease severity, occurrence of complications (shock, respiratory failure, or acute renal failure), and co‐infection status with other pathogens during hospital stay. The available chest CT images of each patient were reviewed by a senior radiologist blinded to the clinical data, in order to confirm detailed abnormality of radiological characteristics of these patients. The presence or absence of the three following features was recorded for each patient: (a) ground‐glass opacity (GGO), (b) subpleural lesions and pleural effusion, (c) number of affected pulmonary lobes.
Exposure history was defined as any close contact with patients diagnosed with COVID‐19 (eg, familial cluster occurrence or occupational exposure of healthcare professionals) or visited Huanan wet market since December 2019. COVID‐19 was diagnosed as severe if the patients met one of the following criteria: (a) respiratory distress with respiratory frequency ≥30/min, (b) pulse oximeter oxygen saturation ≤93% at rest, and (c) oxygenation index (artery partial pressure of oxygen/inspired oxygen fraction, PaO2/FiO2) ≤300 mmHg.
2.3. Laboratory tests
The SARS‐CoV‐2 viral nucleic acid test on the pharyngeal swab specimens of each patient from the two hospitals were processed by technicians from the Zhongnan Hospital of Wuhan University using a rRT‐PCR assay. 15 According to the recommendations issued by the National Institute for Viral Disease Control and Prevention (China), 16 a cycle threshold value (Ct‐value) less than 37 was defined as a positive test result, whereas a Ct‐value of 40 or more was defined as negative. All rRT‐PCR assays were performed with the same kit.
Complete blood counts, biochemical parameters, and variables reflecting hepatic and renal functions on admission and data of follow‐up laboratory tests during hospital stay were collected for each patient, including leukocytes, platelets, neutrophils, lymphocytes, monocytes, eosinophils, basophils, C‐reactive protein (CRP), serum amyloid A (SAA), procalcitonin (PCT), D‐dimer, serum creatinine kinase (CK), creatinine kinase‐MB (CK‐MB), alanine aminotransferase (ALT), aspartate aminotransferase (AST), blood urea nitrogen (BUN), and serum creatinine.
Serum and respiratory samples, such as pharyngeal swabs, were collected to detect co‐infection with other pathogens, such as Mycoplasma pneumoniae, Chlamydia pneumoniae, Coxsackie virus group B, adenovirus, echovirus, respiratory syncytial virus, Epstein‐Barr virus, influenza A virus, influenza B virus, parainfluenza, cytomegalovirus, Gram‐positive or Gram‐negative bacteria, and fungi.
2.4. Statistical analysis
Categorical variables were expressed as frequencies and percentages (%), and the frequencies of nonsurvived, survived severe, and nonsevere patient groups (total patient number = 289) were compared by partition of chi‐square test. Continuous variables were described as median and interquartile range (IQR) values. One‐way ANOVA test and Kruskal‐Wallis test were used, as appropriate, to compare the data from the three groups. A two‐sided α of 0.0167 (after adjustment) was considered statistically significant for partition of chi‐square test when comparing differences between categorical variables among the three groups. On the other hand, a two‐sided α of 0.05 was considered statistically significant for one‐way ANOVA test and Kruskal‐Wallis test when comparing differences between continuous variables among the three groups.
Principal component analysis (PCA) was used for dimensionality reduction and visualization of the patients after imputing missing values using the implementation "ppca" in pcaMethods package. 17 Euclidean distance and complete linkage were used for the heatmap between different laboratory parameters in three groups. Statistical analyses and figures were generated and plotted using GraphPad Prism version 7.00 software (GraphPad Software Inc), SPSS statistical software (version 26.0, IBM), and R software (version 3.4.3, supported by the R Foundation for Statistical Computing).
2.5. Logistic regression analysis
Potential risk factors for nonsurvived COVID‐19 patients (n = 49) compared to survived severe patients (n = 78) were analyzed by a multivariate binary logistic model using Forward Stepwise (Wald) model method. Missing values of laboratory data for the logistic regression analysis, including affected lobe numbers, CRP, PCT, and D‐dimer, were replaced via multiple imputation. The cut‐off value of neutrophil‐to‐lymphocyte ratio (NLR = 7.726) was calculated by receiver operating characteristics (ROC) analysis, with an area under the curve (AUC) of 0.6614, and NLR was analyzed as categorical variables for the logistic regression analysis. All variables were subject to univariate logistic regression, and odds ratios (ORs) were calculated between nonsurvived and survived severe groups, with a 95% confidence interval. Variables were included in binary logistic regression if corresponding P value was less than .05. Binary logistic regression analysis was used to develop a multivariate model to determine the risk factors of death among critically ill patients.
Univariate analysis and multivariate regression analysis were performed by SPSS software (version 26.0, IBM) and R software (version 3.4.3, supported by R Foundation for Statistical Computing).
3. RESULTS
3.1. Distinct characteristics of patients with different disease severity and clinical outcomes
A total of 289 patients with COVID‐19 were included in this study. Until March 28, 2020, all 78 (27.0%) severe and 162 (56.0%) nonsevere patients were discharged from the two hospitals and 49 (17.0%) patients died. The demographics, clinical symptoms, and radiological characteristics of these patients on admission are shown in Tables 1, 2, 3.
TABLE 1.
Demographics and baseline characteristics of patients with COVID‐19
| All patients (n = 289) | Disease severity and prognosis | P values | |||||
|---|---|---|---|---|---|---|---|
| A) Nonsurvived (n = 49) | B) Severe & Survived (n = 78) | C) Nonsevere (n = 162) | A vs B | B vs C | A vs C | ||
| Age ‐median (range) | 57 (22—88) | 69 (36—88) | 62 (30—87) | 49 (22—84) | 0.029 | <0.001 | <0.001 |
| Age groups ‐No. (%) | — | <0.001 | <0.001 | ||||
| <30 y | 16 (5.5) | 0 (0.0) | 0 (0.0) | 16 (9.9) | — | — | — |
| 30‐49 y | 90 (31.1) | 4 (8.2) | 19 (24.4) | 67 (41.4) | — | — | — |
| 50‐69 y | 119 (41.2) | 21 (42.9) | 34 (43.6) | 64 (39.5) | — | — | — |
| ≥70 y | 64 (22.1) | 24 (49) | 25 (32.1) | 15 (9.3) | — | — | — |
| Sex ‐No. (%) | 0.200 | 0.022 | 0.001 | ||||
| Female | 135 (46.7) | 14 (28.6) | 31 (39.7) | 90 (55.6) | — | — | — |
| Male | 154 (53.3) | 35 (71.4) | 47 (60.3) | 72 (44.4) | — | — | — |
| Exposure History ‐No. (%) | 0.390 | 0.001 | <0.001 | ||||
| Yes | 83 (28.7) | 6 (12.2) | 14 (17.9) | 63 (38.9) | — | — | — |
| No | 206 (71.3) | 43 (87.8) | 64 (82.1) | 99 (61.1) | — | — | — |
| Comorbidity ‐No. (%) | 169 (58.5) | 39 (79.6) | 61 (78.2) | 69 (42.6) | 0.852 | <0.001 | <0.001 |
| Hypertension | 81 (28.0) | 23 (46.9) | 30 (38.5) | 28 (17.3) | 0.346 | <0.001 | <0.001 |
| Diabetes mellitus | 27 (9.3) | 7 (14.3) | 10 (12.8) | 10 (6.2) | 0.813 | 0.081 | 0.078 |
| Coronary heart disease | 18 (6.2) | 8 (16.3) | 6 (7.7) | 4 (2.5) | 0.130 | 0.082 | 0.001 |
| Drug hypersensitivity (self‐reported) | 10 (3.5) | 2 (4.1) | 2 (2.6) | 6 (3.7) | 0.639 | 1.000 | 1.000 |
| COPD | 6 (2.1) | 3 (6.1) | 2 (2.6) | 1 (0.6) | 0.373 | 0.247 | 0.040 |
| Urticaria | 2 (0.7) | 0 (0.0) | 0 (0.0) | 2 (1.2) | — | 1.000 | 1.000 |
| Asthma | 1 (0.3) | 1 (2.0) | 0 (0.0) | 0 (0.0) | 0.386 | — | 0.232 |
| Others | 63 (21.8) | 11 (22.4) | 23 (29.5) | 29 (17.9) | 0.383 | 0.041 | 0.477 |
| Surgery history ‐No. (%) | 88 (30.4) | 19 (28.8) | 32 (41.0) | 37 (22.8) | 0.801 | 0.004 | 0.027 |
| Tumor surgery | 15 (5.2) | 2 (4.1) | 8 (10.3) | 5 (3.1) | 0.315 | 0.031 | 0.665 |
| Craniocerebral surgery | 6 (2.1) | 2 (4.1) | 1 (1.3) | 3 (1.9) | 0.559 | 1.000 | 0.329 |
| Cardiac intervention | 10 (3.5) | 6 (12.2) | 4 (5.1) | 0 (0.0) | 0.183 | 0.011 | <0.001 |
| Others | 61 (21.1) | 11 (22.4) | 20 (25.6) | 30 (18.5) | 0.684 | 0.203 | 0.542 |
| Smokers ‐No. (%) | 28 (9.7) | 12 (24.5) | 8 (10.3) | 8 (4.9) | 0.032 | 0.122 | <0.001 |
| Past Smokers | 18 (6.2) | 8 (16.3) | 4 (5.1) | 6 (3.7) | 0.648 | 0.608 | 1.000 |
| Current Smokers | 10 (3.5) | 4 (8.2) | 4 (5.1) | 2 (1.2) | — | — | — |
Data are shown as median (range) or No. (%). COVID‐19, coronavirus disease 2019; SARS‐CoV‐2, severe acute respiratory syndromes coronavirus 2; COPD, chronic obstructive pulmonary disease. P values denoted the comparison between subgroups; α' = 0.0167 (after adjustment) for partition of chi‐squared test when compare differences between categorical variables among three groups.
TABLE 2.
Symptomatic and radiological characteristics of patients with COVID‐19
| All patients (n = 289) | Disease severity and prognosis | P value | |||||
|---|---|---|---|---|---|---|---|
| A) Nonsurvived (n = 49) | B) Severe & Survived (n = 78) | C) Nonsevere (n = 162) | A vs B | B vs C | A vs C | ||
| Onset of symptom to hospital admission‐median (IQR), days Onset of symptom to hospital admission‐median (IQR), days | 7 (4‐10) | 7 (4.5‐10) | 7 (6‐11) | 4.75 (7‐10) | 0.774 | 0.287 | 0.864 |
| Signs and symptoms ‐No. (%) Signs and symptoms ‐No. (%) | |||||||
| Fever | 241 (83.4) | 44 (89.8) | 70 (89.7) | 127 (78.4) | 0.992 | 0.032 | 0.074 |
| Cough | 188 (65.1) | 32 (65.3) | 60 (76.9) | 96 (59.3) | 0.154 | 0.448 | 0.007 |
| Fatigue | 175 (60.6) | 34 (69.4) | 49 (62.8) | 92 (56.8) | 0.449 | 0.374 | 0.115 |
| Chest tightness/dyspnea | 101 (34.9) | 32 (65.3) | 29 (37.2) | 40 (24.7) | 0.002 | 0.045 | <0.001 |
| Myalgia | 41 (14.2) | 5 (10.2) | 8 (10.3) | 28 (17.3) | 0.992 | 0.153 | 0.232 |
| Gastrointestinal symptoms | 107 (37.0) | 26 (53.1) | 35 (44.9) | 46 (28.4) | 0.369 | 0.011 | 0.001 |
| Nausea | 34 (11.8) | 6 (12.2) | 8 (10.3) | 20 (12.3) | 0.728 | 0.637 | 0.985 |
| Diarrhea | 29 (10.0) | 4 (8.2) | 12 (15.4) | 13 (8.0) | 0.233 | 0.080 | 1.000 |
| Loss of appetite | 48 (16.6) | 19 (38.8) | 15 (19.2) | 14 (8.6) | 0.015 | 0.018 | <0.001 |
| Abdominal pain | 16 (5.5) | 3 (6.1) | 7 (9.0) | 6 (3.7) | 0.740 | 0.126 | 0.437 |
| Belching | 5 (1.7) | 1 (2.0) | 2 (2.6) | 2 (1.2) | 1.000 | 0.598 | 0.549 |
| Emesis | 18 (6.2) | 2 (4.1) | 5 (6.4) | 11 (6.8) | 0.706 | 0.912 | 0.737 |
| No symptoms | 5 (1.7) | 0 (0.0) | 0 (0.0) | 5 (3.1) | — | 0.177 | 0.592 |
| Complications ‐No. (%) | |||||||
| Shock | 42 (14.5) | 38 (77.6) | 4 (5.1) | 0 (0.0) | <0.001 | 0.011 | <0.001 |
| Respiratory failure | 68 (23.5) | 46 (93.9) | 22 (28.2) | 0 (0.0) | <0.001 | <0.001 | <0.001 |
| Acute renal failure | 28 (9.7) | 25 (51.0) | 3 (3.8) | 0 (0.0) | <0.001 | 0.033 | <0.001 |
| No complication | 216 (74.7) | 0 (0.0) | 54 (69.2) | 162 (100.0) | <0.001 | <0.001 | <0.001 |
| Co‐infection with other pathogens ‐No. (%) | 0.063 | 0.017 | <0.001 | ||||
| Yes | 65 (22.5) | 21 (42.9) | 21 (26.9) | 23 (14.2) | — | — | — |
| No | 224 (77.5) | 28 (57.1) | 57 (73.1) | 139 (85.8) | — | — | — |
| Chest CT images ‐No./total No. (%) | |||||||
| Normal | 12/228 (5.3) | 0/35 (0.0) | 0/65 (0.0) | 12/128 (9.4) | — | 0.011 | 0.060 |
| Abnormal | 216/228 (94.7) | 35/35 (100.0) | 65/65 (100.0) | 116/128 (90.6) | — | — | — |
| Bilateral lung | 176/216 (81.5) | 35/35 (100.0) | 59/65 (90.8) | 82/116 (70.7) | 0.064 | <0.001 | 0.002 |
| Unilateral lung | 40/216 (18.5) | 0/35 (0.0) | 6/65 (9.2) | 34/116 (29.3) | — | — | — |
| GGO | 100/216 (46.3) | 11/35 (31.4) | 32/65 (49.2) | 57/116 (49.1) | 0.086 | 0.990 | 0.065 |
| Subpleural lesions | 104/216 (48.1) | 5/35 (14.3) | 21/65 (32.3) | 78/116 (67.2) | 0.050 | <0.001 | <0.001 |
| Affected pulmonary lobe number(s) | 0.148 | <0.001 | <0.001 | ||||
| 1 | 38/216 (17.6) | 0/35 (0.0) | 5/65 (7.7) | 33/116 (28.4) | — | — | — |
| 2 | 23/216 (10.6) | 1/35 (2.9) | 5/65 (7.7)) | 17/116 (14.7) | — | — | — |
| 3 | 15/216 (6.9) | 1/35 (2.9) | 5/65 (7.7) | 9/116 (7.8) | — | — | — |
| 4 | 20/216 (9.3) | 1/35 (2.9) | 5/65 (7.7) | 14/116 (12.1) | — | — | — |
| 5 | 120/216 (55.6) | 32/35 (91.4) | 45/65 (69.2) | 43/116 (37.1) | — | — | — |
Data are shown as median (interquartile range, IQR), No. (%) or No./total No. (%). COVID‐19, coronavirus disease 2019; SARS‐CoV‐2, severe acute respiratory syndromes coronavirus 2; CT, computed tomography; GGO, ground‐glass opacity; IQR, inter quartile range; P values denoted the comparison between subgroups; α' = 0.0167 (after adjustment) for partition of chi‐square test when compare differences between categorical variables among three groups.
TABLE 3.
Laboratory results of patients with COVID‐19
| Laboratory parameters | All patients (n = 289) | Disease severity and prognosis | P value | ||||
|---|---|---|---|---|---|---|---|
| A) Nonsurvived (n = 49) | B) Severe & Survived (n = 78) | C) Nonsevere (n = 162) | A vs B | B vs C | A vs C | ||
| Blood counts parameters | |||||||
| Leukocytes (×109/L) (normal range 3.5‐9.5) | 4.5 (3.41‐6.81) | 6.69 (4.65‐10.69) | 5.0 (3.61‐8.28) | 3.99 (3.23‐5.21) | .061 | .001 | <.001 |
| Increased No. (%) | 35 (12.1) | 16 (32.7) | 14 (17.9) | 5 (3.1) | .058 | <.001 | <.001 |
| Decreased No. (%) | 78 (27.0) | 7 (14.3) | 19 (24.4) | 52 (32.1) | .171 | .219 | .015 |
| Neutrophils (×109/L) (normal range 1.8‐6.3) | 3.05 (2.07‐5.37) | 5.97 (3.31‐9.07) | 3.74 (2.38‐7.20) | 2.49 (1.87‐3.55) | .040 | <.001 | <.001 |
| Increased No. (%) | 55 (19.0) | 22 (44.9) | 22 (28.2) | 11 (6.8) | .054 | <.001 | <.001 |
| Decreased No. (%) | 51 (17.6) | 3 (6.1) | 10 (12.8) | 38 (23.5) | .225 | .054 | .007 |
| Neutrophil percentage (%) (normal range 40‐75) | 70.0 (58.7‐83.6) | 86.4 (76.5‐91.8) | 77.4 (65.9‐85.9) | 63.6 (54.7‐74.4) | .016 | <.001 | <.001 |
| Increased No. (%) | 117 (40.5) | 38 (77.6) | 42 (53.8) | 37 (22.8) | .007 | <.001 | <.001 |
| Decreased No. (%) | 2 (0.7) | 1 (2.0) | 0 (0.0) | 1 (0.6) | .386 | 1.000 | .411 |
| Neutrophil‐to‐lymphocyte ratio (NLR) | 3.38 (2.04‐8.22) | 10.34 (4.54‐19.47) | 5.69 (2.59‐10.46) | 2.57 (1.60‐4.34) | .0451 | <.001 | <.001 |
| Increased (>7.726) | 78 (27.0) | 34 (69.4) | 27 (34.6) | 17 (10.5) | <.001 | <.001 | <.001 |
| Lymphocytes (×109/L) (normal range 1.1‐3.2) | 0.86 (0.57‐1.16) | 0.59 (0.34‐1.05) | 0.73 (0.49‐1.03) | 1.00 (0.67‐1.23) | .784 | .540 | .784 |
| Decreased No. (%) | 202 (69.9) | 40 (81.6) | 61 (78.2) | 101 (62.3) | .641 | .014 | .012 |
| Lymphocyte percentage (%) (normal range 20‐50) | 20.3 (10.0‐29.1) | 8.4 (4.7‐15.2) | 14.0 (8.7‐24.7) | 24.9 (17.3‐34.2) | .014 | <.001 | <.001 |
| Decreased No. (%) | 144 (49.8) | 40 (81.6) | 50 (64.1) | 54 (33.3) | .034 | <.001 | <.001 |
| Monocytes (×109/L) (normal range 0.1‐0.6) | 0.36 (0.25‐0.50) | 0.35 (0.24‐0.53) | 0.38 (0.24‐0.51) | 0.36 (0.26‐0.49) | .928 | .667 | .947 |
| Decreased No. (%) | 7 (2.4) | 3 (6.1) | 1 (1.3) | 3 (1.9) | .298 | 1.000 | .139 |
| Monocyte percentage (%) (normal range 3‐10) | 8.0 (5.1‐10.4) | 4.5 (3.1‐7.3) | 6.6 (4.3‐9.9) | 9.4 (6.6‐11.1) | .006 | .002 | <.001 |
| Decreased No. (%) | 25 (8.7) | 10 (20.4) | 9 (11.5) | 6 (3.7) | .173 | .025 | .001 |
| Eosinophils (×109/L) (normal range 0.02‐0.52) | 0.01 (0.0‐0.05) | 0.0 (0.00‐0.02) | 0.01 (0.00‐0.6) | 0.01 (0.00‐0.05) | .831 | 1.000 | .782 |
| Decreased No. (%) | 170 (58.8) | 36 (73.5) | 50 (64.1) | 84 (51.9) | .053 | .452 | .007 |
| Eosinophils percentage (%) (normal range 0.4‐8.0) | 0.2 (0.0‐0.9) | 0.0 (0.0‐0.2) | 0.1 (0.0‐0.7) | 0.3 (0.1‐1.1) | .098 | .015 | <.001 |
| Decreased No. (%) | 173 (59.9) | 40 (81.6) | 50 (64.1) | 83 (51.2) | .003 | .398 | <.001 |
| Basophils (×109/L) (normal range 0.0‐0.06) | 0.0 (0.0‐0.01) | 0.0 (0.0‐0.02) | 0.0 (0.0‐0.01) | 0.0 (0.0‐0.01) | .268 | .990 | .238 |
| Increased No. (%) | 3 (1.0) | 1 (2.0) | 1 (1.3) | 1 (0.6) | 1.000 | .545 | .411 |
| Basophils percentage (%) (normal range 0.0‐1.0) | 0.0 (0.0‐0.2) | 0.0 (0.0‐0.2) | 0.0 (0.0‐0.1) | 0.0 (0.0‐0.3) | .592 | .232 | .955 |
| Increased No. (%) | 0 (0.0) | 0 (0.0) | 0 (0.0) | 0 (0.0) | — | — | — |
| Platelets (×109/L) (normal range 125‐350) | 169.0 (127.0‐218.5) | 156 (114‐200) | 164.5 (111.5‐206.0) | 178.0 (141.8‐224.3) | .860 | .433 | .235 |
| Increased No. (%) | 13 (4.5) | 2 (4.1) | 6 (7.7) | 5 (3.1) | .484 | .183 | .665 |
| Decreased No. (%) | 65 (22.5) | 15 (30.6) | 28 (35.9) | 22 (13.6) | .540 | <.001 | .006 |
| Biochemical Parameters | |||||||
| C‐reactive protein (CRP) (mg/L) (normal range 0‐3) | 27.9 (9.0‐60.6) | 105.2 (53.3‐160.3) | 36.3 (18.3‐72.5) | 15.9 (4.5‐38.1) | <.001 | <.001 | <.001 |
| Increased No./total No. (%) | 249/283 (88.0) | 46/46 (100.0) | 74/77 (96.1) | 129/160 (80.6) | .175 | .001 | .001 |
| Serum amyloid A (SAA) (mg/L) (normal range 0‐10) | 83.9 (17.9‐160.1) | 142.4 (78.85‐199.8) | 100.6 (48.8‐159.6) | 48.8 (11.2‐156.0) | .740 | .128 | .016 |
| Increased No./total No. (%) | 148/176 (84.1) | 19/20 (95.0) | 41/43 (95.3) | 88/113 (77.9) | .952 | .010 | .075 |
| Procalcitonin (PCT) (ng/mL) (normal range 0‐0.1) | 0.05 (0.0‐0.13) | 0.26 (0.10‐0.60) | 0.09 (0.04‐0.24) | 0.03 (0.0‐0.05) | .004 | <.001 | <.001 |
| Increased No./total No. (%) | 84/272 (30.9) | 35/47 (74.5) | 32/71 (45.1) | 17/154 (11.0) | .002 | <.001 | <.001 |
| D‐Dimer (μg/mL) (normal range 0‐0.5) | 0.22 (0.13‐0.52) | 0.90 (0.38‐3.41) | 0.27 (0.17‐0.58) | 0.14 (0.10‐0.24) | .005 | <.001 | <.001 |
| Increased No./total No. (%) | 58/231 (25.1) | 25/44 (56.8) | 18/61 (29.5) | 15/126 (11.9) | .005 | .003 | <.001 |
| Serum creatinine kinase (U/L) (normal range 40‐200) | 78.5 (54.0‐129.3) | 109.0 (63.5‐241.5) | 84.0 (46.8‐176.0) | 70.0 (53.0‐111.0) | .532 | .791 | .028 |
| Increased No./total No. (%) | 28/190 (14.7) | 10/37 (27.0) | 10/46 (21.7) | 8/107 (7.5) | .576 | .012 | .004 |
| Creatinine kinase‐MB (ng/mL) (normal range 0.0‐6.22) | 1.1 (0.6‐2.2) | 2.2 (1.1‐3.6) | 1.5 (0.7‐3.1) | 0.8 (0.5‐1.4) | .723 | .011 | .003 |
| Increased No./total No. (%) | 5/145 (3.4) | 1/18 (5.6) | 4/45 (8.9) | 0/82 (0.0) | 1.000 | .014 | .180 |
| Hepatic and renal function parameters | |||||||
| Alanine aminotransferase (ALT) (U/L) (normal range 9‐50) | 22 (15‐39) | 46 (27‐63) | 26 (15.5‐51.5) | 18 (13‐26) | .023 | .001 | <.001 |
| Increased No./total No. (%) | 49/267 (18.4) | 19/47 (40.0) | 18/65 (27.7) | 12/155 (7.7) | .157 | <.001 | <.001 |
| Aspartate aminotransferase (AST) (U/L) (normal range 15‐40) | 28 (20‐41) | 39 (26‐55) | 33 (22‐50.5) | 25 (20‐33) | .586 | .002 | <.001 |
| Increased No./total No. (%) | 76/267 (28.5) | 23/47 (48.9) | 26/65 (40.0) | 27/155 (17.4) | .347 | <.001 | <.001 |
| Blood urea nitrogen (BUN) (mmol/L) (normal range 2.8‐7.6) | 4.44 (3.38‐6.01) | 7.92 (5.01‐14.41) | 4.77 (3.90‐6.90) | 3.94 (3.11‐5.09) | .003 | .002 | <.001 |
| Increased No./total No. (%) | 35/267 (13.1) | 22/47 (46.8) | 12/65 (18.5) | 1/155 (0.6) | .001 | <.001 | <.001 |
| Serum creatinine (μmol/L) (normal range 64‐104) | 66.4 (54.0‐80.7) | 80.0 (66.0‐112.0) | 67.6 (55.9‐85.2) | 62.9 (52.0‐75.0) | .028 | .208 | <.001 |
| Increased No./total No. (%) | 25/267 (9.4) | 14/47 (29.8) | 9/65 (13.8) | 2/155 (1.3) | .039 | <.001 | <.001 |
Data are shown as median (IQR), No. (%) or No./total No. (%). IQR, inter quartile range; COVID‐19, coronavirus disease 2019; SARS‐CoV‐2, severe acute respiratory syndromes coronavirus 2; P values denoted the comparison between subgroups; α' = 0.0167 (after adjustment) for partition of chi‐squared test when compare differences between categorical variables among three groups; α = 0.05 for one‐way ANOVA test and Krustal‐Wallis test when compare differences between continuous variables among three groups.
Compared with survived severe patients (group B in Tables 1, 2, 3), nonsurvived patients (group A in Tables 1, 2, 3) were older in age (P = .029) and had a higher prevalence of symptoms, including chest tightness/dyspnea (P = .002), gastrointestinal symptoms manifested as loss of appetite (P = .015), higher neutrophil counts (P = .004) and percentages (P = .016), higher lymphocyte percentages (P = .014), larger NLR (P = .045), higher monocyte percentages (P = .006), higher levels of C‐reactive protein (P < .001), procalcitonin (P = .002), D‐dimer (P = .005), ALT (P = .023), BUN (P = .003), and serum creatinine (P = .028). Common clinical characteristics of nonsurvived patients included increased neutrophil percentages (P = .007), PCT (P = .002), D‐dimer (P = .005), and BUN (P = .001), and decreased eosinophil percentages (P = .003) (Tables 1, 2, 3).
In comparison with survived severe patients (group B), nonsevere patients (group C in Tables 1, 2, 3) were relatively younger (P < .001) and had less exposure history (P < .001), underlying comorbidities (P < .001), surgery history (P = .004), and gastrointestinal symptoms (P = .011). Leukocyte and neutrophil counts, and NLR were lower in nonsevere patients than in survived severe patients. Nonsevere patients had lower serum levels of CRP, PCT, D‐dimer, CK‐MB, ALT, AST, and BUN (Figure 1, Tables 1, 2, 3). Lymphopenia, thrombocytopenia, and elevated biochemical parameters including liver and renal function‐related markers (all P < .001) were found in significantly low or normal levels in nonsevere patients (Tables 1, 2, 3).
FIGURE 1.
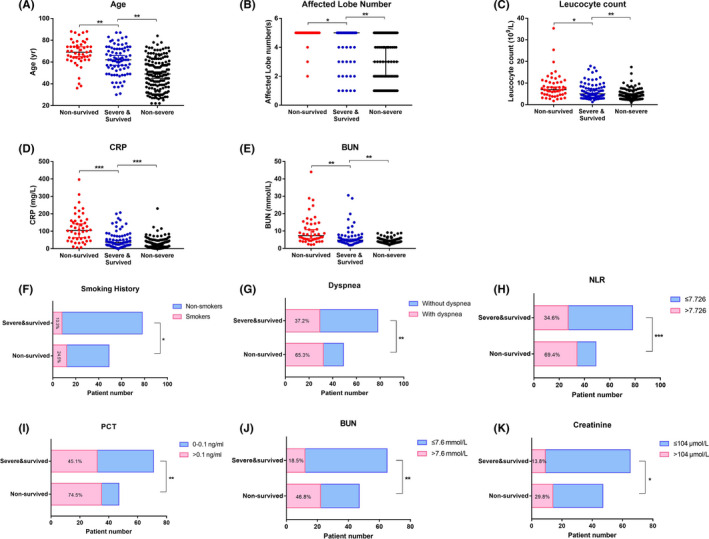
Difference in risk factors of death among three groups of COVID‐19 patients with different severity and outcomes. Demographic parameters and variables of laboratory tests (data on admission) with significant differences among the three groups of patients are illustrated, including continuous variables (A‐E) and categorical variables (F‐K). Elder age (A), increased number of affected lobes (B), increased leukocyte count (C), elevated levels of CRP (D) and BUN (E), higher prevalence of patients with smoking history (F), dyspnea (G), a larger proportion of patients with increased NLR (H), PCT (I), BUN (J), and serum creatinine (K) were identified in the nonsurvived group compared to the survived severe group. Percentages in the bars of F‐K represent the percentages of patients with specific demographic/abnormal laboratory findings in each subgroup. Continuous variables of the three groups (A‐E) were compared using one‐way ANOVA test or Kruskal‐Wallis test, as appropriate. Categorical variables of the nonsurvived and survived severe groups (F‐K) were compared via chi‐square test or Fisher's exact test, as appropriate. * denotes a P value of ≤.05, ** denotes P ≤ .01, *** denotes P ≤ .001. BUN, blood urea nitrogen; CRP, C‐reactive protein; NLR, neutrophil‐to‐lymphocyte ratio; PCT, procalcitonin
Radiologically, ground‐glass opacity [99 (46.3%)] and subpleural lesions [103 (48.1%)] were common CT signs and distributed in different numbers of lobes (Fig. S1). In addition, nonsevere patients had a higher incidence of normal chest CT images or fewer infected pulmonary lobes compared to survived severe patients (P = .01). As expected, there were significant differences in the clinical characteristics, laboratory findings, and CT images between nonsurvived and nonsevere patients (Tables 1, 2, 3).
3.2. Predictions of disease severity
To assess the similarities and differences between patients with different severities, principal component analysis (PCA) was applied to reduce the dimensionality and visualize the patients on a low‐dimensional space. On the Figure 2 biplot, a trajectory from "nonsevere" toward "nonsurvived" via "severe and survived" patients was observed. These results are in agreement with the blood count and biochemical parameters as potential indicators of disease severity. Interestingly, the heterogeneity within the "nonsurvived" group is much larger than in the "nonsevere" group, suggesting multiple reasons for disease severity. A heatmap of the overview of changes of laboratory results between the three groups is presented in Figure S2.
FIGURE 2.
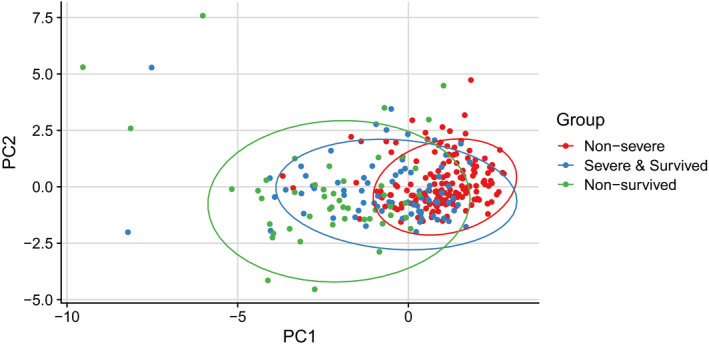
Principal Component Analysis (PCA). Principal Component Analysis (PCA) was used for dimensionality reduction and visualization of the patients. All patients were included in the analysis; parameters including laboratory results on admission, age, and affected lobe numbers were used in the analysis; results are represented by colored dots separated by three groups of severity. Despite no clear separation between the three groups, there was a clear trajectory from "nonsevere" toward "nonsurvived" via " survived severe"
3.3. Risk factors of death in severe COVID‐19 patients
127 severe patients (49 nonsurvivors and 78 survivors) were included in the univariate and multivariate logistic regression analysis. In the univariate analysis, odds of in‐hospital death were higher in patients with chest tightness/dyspnea and smoking history (Table 4). Additional findings associated with death included patients’ age, affected lobe numbers, leukocyte counts, CRP levels, and elevated levels of NLR, PCT, BUN, and serum creatinine (Table 4). Multivariate analysis indicated that the age of patients (OR, 1.04; 95% CI, 1.00‐1.08), smoking history (OR, 5.21; 95% CI, 1.39‐19.52), chest tightness/dyspnea (OR, 3.03; 95% CI, 1.18‐7.79), number of affected lobes on admission (OR, 1.71; 95% CI, 1.06‐2.78), and CRP levels on admission (OR, 1.01; 95% CI, 1.00‐1.02) were risk factors associated with death in cases with severe COVID‐19 (Table 4, Figure 1).
TABLE 4.
Risk factors associated with death in critically ill a COVID‐19 patients
| Univariable OR (95% CI) | P value | Multivariable OR (95% CI) | P value | |
|---|---|---|---|---|
| Demographics and baseline characteristics | ||||
| Age | 1.04 (1.01, 1.08) | .0049 | 1.04 (1.00‐1.08) | .0290 |
| Female sex (vs male) | 0.61 (0.28, 1.31) | .2018 | — | — |
| Exposure history | 0.33 (0.07, 1.61) | .1700 | — | — |
| Comorbidities | 1.09 (0.45, 2.62) | .8525 | — | — |
| Surgery history | 0.91 (0.44, 1.89) | .8012 | — | — |
| Smokers (vs nonsmokers) | 2.84 (1.07, 7.56) | .0368 | 5.21 (1.39‐19.52) | .0143 |
| Symptomatic and radiological characteristics | ||||
| Fever | 1.01 (0.31, 3.27) | .9924 | — | — |
| Cough | 0.56 (0.26, 1.24) | .1560 | — | — |
| Chest tightness/Dyspnea | 3.18 (1.51, 6.71) | .0024 | 3.03 (1.18‐7.79) | .0214 |
| Fatigue | 1.34 (0.63, 2.87) | .4496 | — | — |
| Myalgia | 0.99 (0.31, 3.23) | .9924 | — | — |
| GI tract symptom | 1.39 (0.68, 2.84) | .3692 | — | — |
| Loss of appetite | 0.27 (0.07, 1.00) | .0503 | — | — |
| Affected lobe numbers b | 1.94 (1.07, 3.50) | .0278 | 1.71 (1.06‐2.78) | .0293 |
| Subpleural lesion | 0.35 (0.12, 1.03) | .0562 | — | — |
| Laboratory findings | ||||
| Leukocyte count (×109/L) | 1.10 (1.01, 1.20) | .0245 | — | — |
| <3.5 | 0.64 (0.24, 1.72) | .3740 | — | — |
| 3.5‐9.5 | 1 (ref) | — | — | — |
| >9.5 | 1.98 (0.83, 4.70) | .1221 | — | — |
| Neutrophil count (109/L) | 1.03 (0.97, 1.08) | .3476 | — | — |
| <1.8 | 0.58 (0.14, 2.29) | .4324 | — | — |
| 1.8‐6.3 | 1 (ref) | — | — | |
| >6.3 | 1.92 (0.89, 4.14) | .0977 | — | — |
| Lymphocyte count (×109/L) | 1.08 (0.78, 1.48) | .6545 | — | — |
| <1.1 | 1.50 (0.57, 3.97) | .4153 | — | — |
| 1.1‐3.2 | 1 (ref) | — | — | |
| >3.2 | 4.57 (0.35, 59.11) | .2445 | — | — |
| Eosinophil count (×109/L) | 0.21 (0.00, 60.64) | .5886 | — | — |
| <0.02 | 1.55 (0.71, 3.40) | .2733 | — | — |
| 0.02‐0.52 | 1 (ref) | — | — | |
| Platelet (×109/L) | 1.00 (1.00, 1.00) | .6498 | — | — |
| <125 | 0.74 (0.34, 1.60) | .4395 | — | — |
| 125‐350 | 1 (ref) | — | — | — |
| >350 | 0.46 (0.09, 2.42) | .3581 | — | — |
| NLR | 1.03 (1.00, 1.06) | .0633 | — | — |
| ≤7.726 | 1 (ref) | — | — | — |
| >7.726 | 4.28 (1.99, 9.21) | .0002 | — | — |
| CRP (mg/L) | 1.02 (1.01, 1.02) | <.0001 | 1.01 (1.00‐1.02) | .0094 |
| ≤3 | 1 (ref) | — | — | — |
| >3 | — | .9907 | — | — |
| SAA (mg/L) | 1.00 (1.00, 1.01) | .2400 | — | — |
| ≤10 | 1 (ref) | — | — | — |
| >10 | 0.93 (0.08, 10.86) | .9518 | — | — |
| PCT (ng/mL) | 1.22 (0.95, 1.55) | .1204 | — | — |
| 0‐0.1 | 1 (ref) | — | — | — |
| >0.1 | 3.55 (1.59, 7.95) | .0020 | 2.15 (0.77‐6.02) | .1464 |
| D‐dimer (μg/mL) | 1.06 (1.00, 1.12) | .0624 | — | — |
| Within normal range c | 1 (ref) | — | — | — |
| Increased c | 1.20 (0.54, 2.68) | .6579 | — | — |
| CK (U/L) | 1.00 (1.00, 1.00) | .2859 | — | — |
| ≤200 | 1 (ref) | — | — | — |
| >200 | 1.33 (0.53, 3.33) | .5384 | — | — |
| CK‐MB (ng/mL) | 1.07 (0.88, 1.31) | .4985 | — | — |
| ≤6.22 | 1 (ref) | — | — | — |
| >6.22 | 0.60 (0.06, 5.80) | .6613 | — | — |
| ALT (U/L) | 1.01 (1.00, 1.02) | .0755 | — | — |
| ≤50 | 1 (ref) | — | — | — |
| >50 | 1.77 (0.80, 3.93) | .1593 | — | — |
| AST (U/L) | 1.00 (0.99, 1.01) | .3504 | — | — |
| ≤40 | 1 (ref) | — | — | — |
| >40 | 1.44 (0.67, 3.07) | .3475 | — | — |
| BUN (mmol/L) | 1.10 (1.02, 1.18) | .0082 | 1.06 (0.99‐1.14) | .1004 |
| ≤7.6 | 1 (ref) | — | — | — |
| >7.6 | 3.89 (1.66, 9.08) | .0017 | — | — |
| Serum creatinine (μmol/L) | 1.00 (1.00, 1.01) | .2323 | — | — |
| ≤104 | 1 (ref) | — | — | — |
| >104 | 2.64 (1.03, 6.77) | .0433 | — | — |
Chi‐square test or Fisher's exact test was used, as appropriate, to evaluate the difference between nonsurvived and severe & survived patients.
Abbreviations: ALT, alanine aminotransferase; AST, aspartate aminotransferase; BUN, blood urea nitrogen; CK, serum creatinine kinase; CK‐MB, creatinine kinase‐MB; CRP, C‐reactive protein; GI tract, gastrointestinal tract; NLR, neutrophil‐to‐lymphocyte ratio; OR, odds ratio; PCT, procalcitonin; SAA, serum amyloid A.
Critically ill patients include nonsurvived (n = 49) and severe & survived (n = 78) patients.
Affected lobe number(s) was analyzed as a continuous variable.
The normal range of D‐dimer was adjusted according to the age of each patient.
3.4. Correlations between radiological and laboratory parameters
In these 289 patients, according to the heatmap of Spearman correlation of laboratory results on admission, together with age and affected lobe numbers (as shown in Figure 3), three clusters of correlation were found. The first cluster had moderate correlations among lymphocyte, eosinophils, platelet, monocytes, leukocytes, and neutrophils in all patients. The second cluster had correlations among biochemical parameters including PCT, BUN, NLR, CRP, serum creatinine, CK, CK‐MB, D‐dimer, SAA, ALT, and AST, as well as age and numbers of affected pulmonary lobes. Many of these markers showed weak and moderate correlations; however, some of them showed a strong correlation, such as NLR, neutrophils, ALT, and AST. The third cluster had negative correlations among blood cell components, biochemical parameters, age, and affected lobe numbers. Most of the variables showed weak correlations, except a strong correlation between NLR and lymphocyte counts. Increased inflammatory parameters suggesting a cytokine storm and multiorgan injury showed a negative correlation, particularly with numbers of lymphocytes and eosinophils, but also platelets and basophils. Scatter plots of different correlations between age, affected lobe numbers, and other laboratory parameters are shown in Figure 4, as well as Figures S3‐S5.
FIGURE 3.
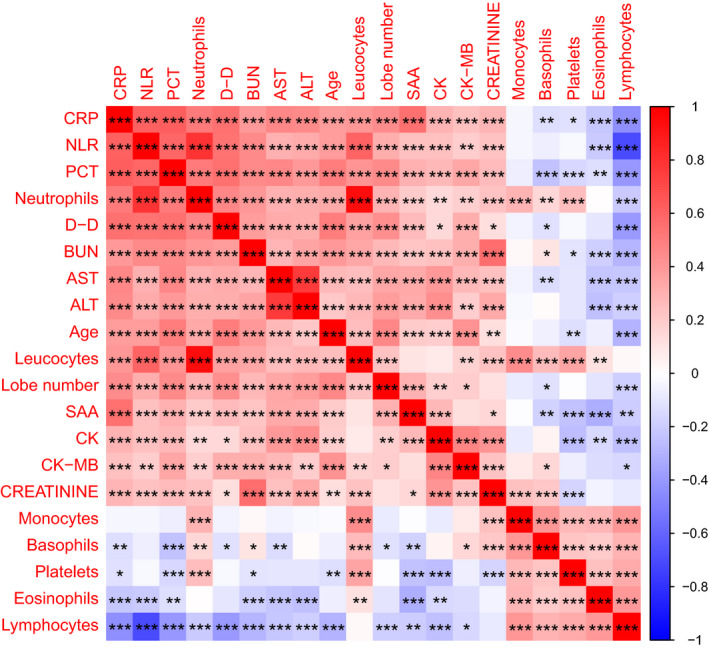
Heatmap of Spearman correlations among laboratory results, as well as with age and affected lobe numbers. Spearman correlation heatmap with correlation coefficient and significance levels based on the laboratory results on admission, as well as patients’ age and affected lobe number. Positive correlations are marked in red and negative ones in blue (color scale on the right side). * denotes P ≤ .05, ** denotes P ≤ .01, *** denotes P ≤ .001. ALT, alanine aminotransferase; AST, aspartate aminotransferase; BUN, blood urea nitrogen; CK, serum creatinine kinase; CK‐MB, creatinine kinase‐MB; CRP, C‐reactive protein; D‐D, D‐dimer; NLR, neutrophil‐to‐lymphocyte ratio; PCT, procalcitonin; SAA, serum amyloid A
FIGURE 4.
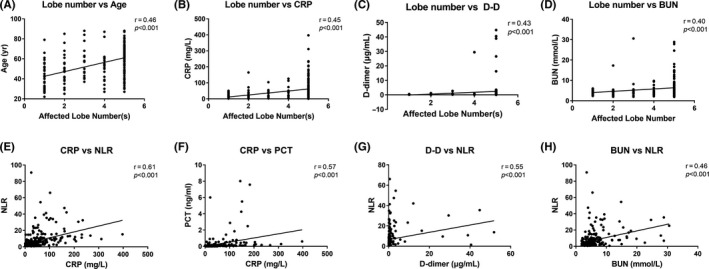
Selected Spearman correlations between the number of affected lobe number(s), age of patients and laboratory parameters in COVID‐19 patients. Scatter plots showing the correlations between affected lobe numbers, age of patients, and laboratory variables (data on admission). Strong positive correlations were observed in all plots. Spearman's test was used to evaluate the correlations. BUN, blood urea nitrogen; CRP, C‐reactive protein; D‐D, D‐dimer; NLR, neutrophil‐to‐lymphocyte ratio; PCT, procalcitonin
3.5. Longitudinal variations of laboratory findings
Differences in longitudinal trends of the laboratory findings between nonsurvived and survived severe patients were observed as the disease progressed. As shown in Figure 5, leukocyte and neutrophil counts increased in the early stage of hospitalization (3‐7 days) and gradually decreased during the late stage of hospitalization (8‐14 days) in severe survived patients, but continuously increased in nonsurvived patients. Even though lymphopenia was observed in both groups during hospitalization, the lymphocyte count was significantly lower in the nonsurvived group compared to the survived severe group. It should be noted that sustained eosinopenia and progressing thrombocytopenia were observed in nonsurvived patients, but both blood cell numbers were partially relieved in survived severe patients. Sustained high levels of NLR, CRP, PCT, AST, BUN, and serum creatinine were associated with fatal clinical outcome of severe patients.
FIGURE 5.
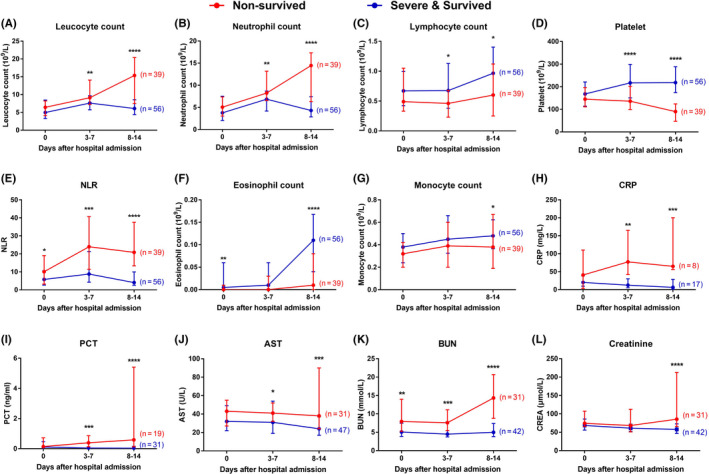
Differences in longitudinal course of laboratory findings between nonsurvived and survived severe cases. Severe COVID‐19 patients were divided into nonsurvived and survived severe groups according to the clinical outcomes as of March 28, 2020. Data from patients with available laboratory results on admission, 3‐7 days after admission, and 8‐14 days after admission are shown; “n” represents the number of patients with available follow‐up data for each parameter. The red lines represent the values of nonsurvived patients of each parameter, and the blue lines show the values of survived severe patients; * denotes P ≤ .05, ** denotes P ≤ .01, *** denotes P ≤ .001. AST, aspartate aminotransferase; BUN, blood urea nitrogen; CRP, C‐reactive protein; NLR, neutrophil‐to‐lymphocyte ratio; PCT, procalcitonin
4. DISCUSSION
Of the 289 laboratory‐confirmed COVID‐19 cases in this study, most of the patients were more than 50 years old, with an almost 1:1 female‐male ratio. The prevalence of underlying comorbidities, including hypertension, diabetes mellitus, and coronary heart disease, was similar to those demonstrated in previous studies. 14 , 18 , 19 , 20
The mortality of the 289 hospitalized cases in the present study was 17.0% (49/289), which was lower than that reported by Zhou et al [54/191 (28.3%)], 19 but much higher than that reported by Guan et al (1.4%) 20 and in a large‐scale analysis reported by the Chinese Center for Disease Control and Prevention [1023/44672 (2.3%)]. 21 The difference may be due to the different sample sizes and case inclusion criteria used in these studies.
For the first time, we found that the number of affected lobes on CT scans was associated with disease severity. In accordance with previous reports, 18 , 22 bilateral lung involvement was predominant in patients with abnormal chest CT images, mainly manifested as multiple ground‐glass opacities and subpleural lesions. Five pulmonary lobes were affected in more than half of the patients with abnormal chest CT images. Affected lobe numbers correlated with age, CRP, D‐dimer, and BUN, which also correlated with each other. Based on these observations, continuous monitoring of chest CT images is useful for the evaluation of the disease course. However, it is not easy to obtain a second chest CT scan in critically ill patients during hospitalization, especially in intubated and ventilated patients. In this situation, bedside X‐ray can be an alternative option. Most of the nonsurvived patients in this study lacked a second CT scan.
The mortality risk factors for severe patients identified in this study using a logistic regression model include elderly age, higher CRP levels, number of affected lobes, chest tightness/dyspnea, and smoking history. Although neutrophil counts and biochemical parameters were significantly different between survived severe and nonsurvived patients, these variables were not found to be an independent risk factor for mortality of COVID‐19 patients.
The present study supports the association of elderly age and increased mortality rate in COVID‐19 patients, in accordance with a previous study. 19 Elderly age is known to be associated with a dampened immune function and more underlying comorbidities, which may lead to the poor outcome of these patients. 23
Several studies have reported that hypertension, hypoxia, leukocytosis, lymphopenia, and high serum LDH levels were independent predictors for in‐hospital death. 7 , 8 , 9 , 10 However, in the present study, only dyspnea and leukocytosis were found to be independent risk factors of death in critically ill COVID‐19 patients. Previous reports identified that lower baseline levels and/or progressively decreasing platelet counts were associated with higher mortality of COVID‐19 patients. 11 This is similar to our observations of nonsurvived patients in the current study.
CRP is a widely used inflammatory marker in clinical studies. Elevated CRP levels indicate inflammation caused by various conditions, including infections. Elevated IL‐6, which is the trigger of CRP synthesis in the liver, was also observed in COVID‐19 patients. 24 A cytokine storm has been suggested as a culprit for poor prognosis of critically ill COVID‐19 patients. In the current study, higher CRP levels were found to be associated with poor clinical outcome of severe patients. Wang et al identified higher levels of CRP in nonsurvivors compared with survivors within 15 days of COVID‐19 hospitalization. 10 Additionally, Wu et al found that elevated high‐sensitivity CRP was significantly associated with higher risks of acute respiratory distress syndrome (ARDS) in COVID‐19 patients. 7 The data suggested that CRP was a marker of a developing cytokine storm in COVID‐19 patients and was associated with disease mortality.
In a recent study, 25 higher NLR was suggested to be independent risk factors of mortality in hospitalized COVID‐19 patients. However, logistic regression analysis indicated that the odd ratio of in‐hospital death was higher in patients with higher NLR but it was not an independent risk factor of death for severe patients in the current study.
Interestingly, the prevalence of patients with smoking history is 9.7%, which is close to that reported in the latest scientific brief published by the World Health Organization (WHO). 26 The presence of smoking history was found to be a risk factor of death in critically ill patients. Similarly, Mehra et al 27 demonstrated that current smokers had higher in‐hospital death rate in COVID‐19 patients. A systemic review also concluded that smoking is most likely associated with poor disease progression and adverse outcomes. 28 In view of these results, smoking should not be considered a preventive measure for COVID‐19 and as a public health issue should be discouraged at all times. Although smoking is a major cause of chronic obstructive pulmonary disease (COPD), a recent study reported that COPD did not increase the risk of COVID‐19 patients requiring admission to the intensive care unit (ICU). 29 This was in contrast to the recent findings in a meta‐analysis which identified COPD as an independent risk factor of disease progression. 30 Angiotensin‐converting enzyme 2 (ACE2) is highly expressed in airway epithelial cells and plays an important role in SARS‐CoV‐2 infection as it has been demonstrated to serve as a receptor for SARS‐CoV‐2. 31 The higher levels of ACE2 expression in the lower respiratory tract of current smokers may contribute to the increased risk of developing severe COVID‐19. 32 , 33 The strong positive correlations identified between the affected lobe numbers, patients’ age, neutrophil, and lymphocyte counts indicate that more severe pneumonia was associated with elderly age and higher degree of lymphopenia, indicating that the numbers of affected lobes could be a possible risk factor for severe cases and in‐hospital mortality of severe COVID‐19 patients. Leukocytosis, eosinopenia, and lymphopenia may be associated with the progression of inflammatory status. More severe illness was associated with older patients, given the increased levels of CRP, SAA, PCT, and D‐dimer.
Comparison of the dynamic profile of laboratory findings in severe patients revealed a sustained increase in leukocyte count, neutrophil count, biological markers, as well as continued decrease in platelet count, lymphopenia and eosinopenia in these patients. As previously reported, eosinopenia may be an indicator for SARS‐CoV‐2 infection, 14 and the degree of eosinopenia was associated with the severity of COVID‐19. 34 , 35 Persistent eosinopenia may be a predictor of disease severity and adverse clinical outcome during hospitalization, which is consistent with the results reported by Xie et al. 34 The anti‐viral effect exhausts eosinophils and may be the cause of eosinopenia in COVID‐19 patients. 36 Moreover, the recovery from eosinopenia was associated with favorable clinical outcome in severe patients. Lymphopenia is prominent in adult COVID‐19 patients, but not in pediatric patients. 37 In this study, the recovery from lymphopenia in survived severe patients was not as significant as that of eosinopenia (Figure 5C,F). Similarly, a recent study showed an increasing trend of eosinophils, lymphocyte, and platelet in severe survivors but remained constant at lower levels in nonsurvivors, which is consistent with our results. 38
Significant differences in levels of D‐dimer on admission were identified between nonsurvived and survived severe patients. However, multivariate regression analysis did not identify D‐dimer as an independent risk factor of the mortality in severe COVID‐19 patients. This was consistent with a previous study conducted by Chen et al, 38 but different from the result from Zhou et al, which showed that elevated D‐dimer was associated with poor prognosis of hospitalized COVID‐19 patients. 19 High level of D‐dimer is indicative of developing thrombosis. A recent study on COVID‐19 patients in Wuhan revealed an extremely high incidence of thrombosis (41/48, 85.4%) in severe patients with a death rate of 31.7% (13/41). 39 Endothelial damage is presumed to be an important mechanism of the development of thrombosis. 40 In addition, elevated D‐dimer levels could occur in deep venous thrombosis (DVT) and in capillary microthrombi, secondary to pulmonary capillary endothelial injury, contributing to the death of severe COVID‐19 patients. 41 Venous thromboembolism (VTE) had a higher incidence in ICU COVID‐19 patients than those on the wards, and the incidence increased along with the duration of hospitalization. 42 A study of 184 ICU COVID‐19 patients reported that computed tomography pulmonary angiography (CTPA) and/or ultrasonography confirmed VTE was 27% and arterial thrombotic events was 3.7%. 43 The study also concluded that pulmonary embolism (PE) was the most frequent thrombotic complication (81%) and that age and coagulopathy were independent predictors of thrombotic complications. 43 Poissy et al found that PE occurred in 22 (20.6%) of 107 patients. However, only 1 DVT was identified in these patients, indicating that pulmonary thrombosis but not embolism is the cause for PE. 44 The contribution of capillary microthrombi to PE is unclear since it was difficult to identify capillary microthrombi in clinical practice.
This study was limited to the relatively small number of patients which may limit the statistical power and the inclusion of hospitalized patients exclusively (nonhospitalized patients were not included in the analysis). These limitations may cause statistical bias and hence the significant difference identified in demographic and symptomatic characteristics, as well as the laboratory findings between the groups. Missing data on some variables, such as information of CT images and biochemical parameters, may cause bias in the identification of risk factors for mortality in severe patients.
In summary, this retrospective, bi‐center study revealed that elder age, CRP levels, number of affected pulmonary lobes, clinical symptoms manifested as chest tightness/dyspnea, and smoking history were independent risk factors of mortality for nonsurvived patients compared with severe and survived patients. Assessment of these parameters may help to identify severe COVID‐19 patients at a high risk of death. Earlier medical intervention and support on these patients with high risk may reduce the fatality of this disease.
CONFLICT OF INTEREST
CA reports grants from Allergopharma, Idorsia, Swiss National Science Foundation, Christine Kühne‐Center for Allergy Research and Education, European Commission's Horizon's 2020 Framework Programme, Cure, Novartis Research Institutes, AstraZeneca, Scibase, and advisory role in Sanofi/Regeneron. All other authors declare no conflict of interest outside the submitted work.
AUTHOR CONTRIBUTIONS
Jinjin Zhang, Yiyuan Cao, Ge Tan, and Yadong Gao collected, organized the clinical data, and prepared the manuscript. Xiang Dong and Binchen Wang contributed to the collection of patient cases and statistical analysis, and Yiyuan Cao collected and interpreted the radiological materials. Jun Lin and Youqin Yan were involved in the clinical and organization work. Yadong Gao and Cezmi A. Akdis designed the study and reviewed the manuscript, along with Guang‐hui Liu and Mübeccel Akdis.
Supporting information
Fig S1‐S5
ACKNOWLEDGMENTS
We would like to express our gratitude and respect to all healthcare professionals and others who have dedicated themselves to combating COVID‐19.
Zhang J‐J, Cao Y‐Y, Tan G, et al. Clinical, radiological, and laboratory characteristics and risk factors for severity and mortality of 289 hospitalized COVID‐19 patients. Allergy.2021;76:533–550. 10.1111/all.14496
Jin‐jin Zhang, Yi‐yuan Cao and Ge Tan contributed equally to this work.
Contributor Information
Cezmi A. Akdis, Email: akdisac@siaf.uzh.ch.
Ya‐dong Gao, Email: gaoyadong@whu.edu.cn.
REFERENCES
- 1. Coronaviridae Study Group of the International Committee on Taxonomy of Viruses . The species Severe acute respiratory syndrome‐related coronavirus: classifying 2019‐nCoV and naming it SARS‐CoV‐2. Nat Microbiol 2020;5:536‐544. [DOI] [PMC free article] [PubMed] [Google Scholar]
- 2. Zhu NA, Zhang D, Wang W, et al. A novel coronavirus from patients with pneumonia in China, 2019. N Engl J Med 2020;382:727‐733. 10.1056/NEJMoa2001017 [DOI] [PMC free article] [PubMed] [Google Scholar]
- 3. World Health Organization (WHO) . Coronavirus disease (COVID‐2019) situation reports. https://www.who.int/emergencies/diseases/novel‐coronavirus‐2019/situation‐reports. Accessed July 2, 2020.
- 4. Dong X, Cao YY, Lu XX, et al. Eleven faces of coronavirus disease 2019. Allergy 2020;75(7):1699‐1709. [DOI] [PMC free article] [PubMed] [Google Scholar]
- 5. Health Commission of Hubei Province . Epidemic situation report of COVID‐19 in Hubei Province on May 30, 2020. In Chinese. http://wjw.hubei.gov.cn/fbjd/dtyw/202005/t20200531_2372659.shtml. Accessed June 8, 2020.
- 6. Zhang JJ, Cao YY, Dong X, et al. Distinct characteristics of COVID‐19 patients with initial rRT‐PCR positive and negative results for SARS‐CoV‐2. Allergy 2020;75:1809‐1812. [DOI] [PMC free article] [PubMed] [Google Scholar]
- 7. Wu C, Chen X, Risk CY, et al. Factors associated with acute respiratory distress syndrome and death in patients with coronavirus disease 2019 pneumonia in Wuhan, China. JAMA Intern Med 2020;180(7):934. 10.1001/jamainternmed.2020.0994 [DOI] [PMC free article] [PubMed] [Google Scholar]
- 8. Yang X, Yu Y, Xu J, et al. Clinical course and outcomes of critically ill patients with SARS‐CoV‐2 pneumonia in Wuhan, China: a single‐centered, retrospective, observational study. Lancet Respir Med 2020;8(5):475‐481. 10.1016/S2213-2600(20)30079-5 [DOI] [PMC free article] [PubMed] [Google Scholar]
- 9. Li X, Xu S, Yu M, et al. Risk factors for severity and mortality in adult COVID‐19 inpatients in Wuhan. J Allergy Clin Immunol 2020;146(1):110‐118. 10.1016/j.jaci.2020.04.006 [DOI] [PMC free article] [PubMed] [Google Scholar]
- 10. Wang K, Zhang Z, Yu M, Tao Y, Xie M. 15‐day mortality and associated risk factors for hospitalized patients with COVID‐19 in Wuhan, China: an ambispective observational cohort study. Intensive Care Med 2020;46(7):1472‐1474. 10.1007/s00134-020-06047-w [DOI] [PMC free article] [PubMed] [Google Scholar]
- 11. Liu Y, Sun W, Guo Y, et al. Retrospective cohort study. Platelets 2019;2020:1‐7. [DOI] [PMC free article] [PubMed] [Google Scholar]
- 12. China National Health Commission . Diagnosis and treatment of 2019‐nCoV pneumonia in China (trial version 5). In Chinese. Beijing: Author. Published February 8, 2020. http://www.nhc.gov.cn/yzygj/s7653p/202002/d4b895337e19445f8d728fcaf1e3e13a.shtml. Accessed June 6, 2020. [Google Scholar]
- 13. China National Health Commission . Diagnosis and treatment of 2019‐nCoV pneumonia in China (trial version 6). In Chinese. Beijing: Author. Published February 19, 2020. http://www.nhc.gov.cn/yzygj/s7653p/202002/8334a8326dd94d329df351d7da8aefc2.shtml. Accessed June 6, 2020. [Google Scholar]
- 14. Zhang JJ, Dong X, Cao YY, et al. Clinical characteristics of 140 patients infected with SARS‐CoV‐2 in Wuhan, China. Allergy 2020;75(7):1730‐1741. 10.1111/all.14238 [DOI] [PubMed] [Google Scholar]
- 15. Wang D, Hu BO, Hu C, et al. Clinical characteristics of 138 hospitalized patients with 2019 novel coronavirus‐infected pneumonia in Wuhan, China. JAMA 2020;323:1061‐1069. [DOI] [PMC free article] [PubMed] [Google Scholar]
- 16. China National Institute for viral disease control and prevention . Specific primers and probes for detection 2019 novel coronavirus (21 January 2020). http://ivdc.chinacdc.cn/kyjz/202001/t20200121_211337.html. Accessed June 6, 2020.
- 17. Stacklies W, Redestig H, Scholz M, Walther D, Selbig J. pcaMethods–a bioconductor package providing PCA methods for incomplete data. Bioinformatics 2007;23:1164‐1167. [DOI] [PubMed] [Google Scholar]
- 18. Huang C, Wang Y, Li X, et al. Clinical features of patients infected with 2019 novel coronavirus in Wuhan. China. Lancet 2020;395:497‐506. [DOI] [PMC free article] [PubMed] [Google Scholar]
- 19. Zhou F, Yu T, Du R, et al. Clinical course and risk factors for mortality of adult inpatients with COVID‐19 in Wuhan, China: a retrospective cohort study. Lancet 2020;395(10229):1054‐1062. 10.1016/S0140-6736(20)30566-3 [DOI] [PMC free article] [PubMed] [Google Scholar]
- 20. Guan WJ, Ni ZY, Hu Y, et al. Clinical characteristics of coronavirus disease 2019 in China. N Engl J Med 2020;382(18):1708‐1720. 10.1056/NEJMoa2002032 [DOI] [PMC free article] [PubMed] [Google Scholar]
- 21. The Novel Coronavirus Pneumonia Emergency Response Epidemiology Team . The epidemiological characteristics of an outbreak of 2019 novel coronavirus diseases (COVID‐19) — China, 2020. China CDC Weekly 2020;2:113‐122. [PMC free article] [PubMed] [Google Scholar]
- 22. Chen N, Zhou M, Dong X, et al. Epidemiological and clinical characteristics of 99 cases of 2019 novel coronavirus pneumonia in Wuhan, China: a descriptive study. Lancet 2020;395:507‐513. [DOI] [PMC free article] [PubMed] [Google Scholar]
- 23. Opal SM, Girard TD, Ely EW. The immunopathogenesis of sepsis in elderly patients. Clin Infect Dis 2005;41(Suppl 7):S504‐S512. [DOI] [PubMed] [Google Scholar]
- 24. Slaats J, Ten Oever J, van de Veerdonk FL, Netea MG. IL‐1β/IL‐6/CRP and IL‐18/ferritin: distinct inflammatory programs in infections. PLoS Pathog 2016;12:e1005973. [DOI] [PMC free article] [PubMed] [Google Scholar]
- 25. Liu Y, Du X, Chen J, et al. Neutrophil‐to‐lymphocyte ratio as an independent risk factor for mortality in hospitalized patients with COVID‐19. J Infect 2020;81(1):e6‐e12. 10.1016/j.jinf.2020.04.002 [DOI] [PMC free article] [PubMed] [Google Scholar]
- 26. World Health Organization (WHO), Smoking and COVID‐19 . Scientific brief. Published 30 June, 2020. https://www.who.int/news‐room/commentaries/detail/smoking‐and‐covid‐19. Accessed July 2, 2020.
- 27. Mehra MR, Desai SS, Kuy S, Henry TD, Patel AN. Cardiovascular disease, drug therapy, and mortality in Covid‐19. N Engl J Med 2020;382(25):e102. 10.1056/NEJMoa2007621 [DOI] [PMC free article] [PubMed] [Google Scholar] [Retracted]
- 28. van Zyl‐Smit RN, Richards G, Leone FT. Tobacco smoking and COVID‐19 infection. Lancet Respir Med 2020;8(7):664‐665. 10.1016/S2213-2600(20)30239-3 [DOI] [PMC free article] [PubMed] [Google Scholar]
- 29. Avdeev S, Moiseev S, Brovko M, et al. Low prevalence of bronchial asthma and chronic obstructive lung disease among intensive care unit patients with COVID‐19. Allergy 2020;75:2703‐2704. [DOI] [PMC free article] [PubMed] [Google Scholar]
- 30. Wang B, Li R, Lu Z, Huang Y. Does comorbidity increase the risk of patients with COVID‐19: evidence from meta‐analysis. Aging 2020;12:6049‐6057. 10.18632/aging.103000 [DOI] [PMC free article] [PubMed] [Google Scholar]
- 31. Lu R, Zhao X, Li J, et al. Genomic characterisation and epidemiology of 2019 novel coronavirus: implications for virus origins and receptor binding. Lancet 2020;395:565‐574. [DOI] [PMC free article] [PubMed] [Google Scholar]
- 32. Leung JM, Yang CX, Tam A, et al. ACE‐2 expression in the small airway epithelia of smokers and COPD patients: implications for COVID‐19. Eur Respir J 2020;55(5):2000688. 10.1183/13993003.00688-2020 [DOI] [PMC free article] [PubMed] [Google Scholar]
- 33. Radzikowska U, Ding M, Tan G, et al. Distribution of ACE2, CD147, CD26 and other SARS‐CoV‐2 associated molecules in tissues and immune cells in health and in asthma, COPD, obesity, hypertension, and COVID‐19 risk factors. Allergy 2020;75:2828‐2844. [DOI] [PMC free article] [PubMed] [Google Scholar]
- 34. Xie G, Ding F, Han L, Yin D, Lu H, Zhang M. The role of peripheral blood eosinophil counts in COVID‐19 patients. Allergy 2021;76:471‐482. [DOI] [PMC free article] [PubMed] [Google Scholar]
- 35. Zhao L, Zhang YP, Yang X. Liu X. Eosinopenia is associated with greater severity in patients with coronavirus disease 2019. Allergy 2021;76:562‐564. [DOI] [PMC free article] [PubMed] [Google Scholar]
- 36. Jesenak M, Banovcin P, Diamant Z. COVID‐19, chronic inflammatory respiratory diseases and eosinophils – observations from reported clinical case series. Allergy 2020;75:1819‐1822. [DOI] [PubMed] [Google Scholar]
- 37. Du H, Dong X, Zhang JJ, et al. Clinical characteristics of 182 pediatric COVID‐19 patients with different severities and allergic status. Allergy 2021;76:510‐532. [DOI] [PMC free article] [PubMed] [Google Scholar]
- 38. Chen R, Sang L, Jiang M, et al. Longitudinal hematologic and immunologic variations associated with the progression of COVID‐19 patients in China. J Allergy Clin Immunol 2020;146(1):89‐100. 10.1016/j.jaci.2020.05.003 [DOI] [PMC free article] [PubMed] [Google Scholar]
- 39. Ren B, Yan F, Deng Z, et al. Extremely high incidence of lower extremity deep venous thrombosis in 48 patients with severe COVID‐19 in Wuhan. Circulation 2020;142(2):181‐183. 10.1161/CIRCULATIONAHA.120.047407 [DOI] [PubMed] [Google Scholar]
- 40. Ackermann M, Verleden SE, Kuehnel M, et al. Pulmonary vascular endothelialitis, thrombosis, and angiogenesis in Covid‐19. N Engl J Med 2020;. 10.1056/NEJMoa2015432 [DOI] [PMC free article] [PubMed] [Google Scholar]
- 41. Riggioni C, Comberiati P, Giovannini M, et al. A compendium answering 150 questions on COVID‐19 and SARS‐CoV‐2. Allergy 2020;75:2503‐2541. [DOI] [PMC free article] [PubMed] [Google Scholar]
- 42. Middeldorp S, Coppens M, van Haaps TF, et al. Incidence of venous thromboembolism in hospitalized patients with COVID‐19. J Thromb Haemost 2020. 10.1111/jth.14888 [Epub ahead of print]. [DOI] [PMC free article] [PubMed] [Google Scholar]
- 43. Klok FA, Kruip M, van der Meer N, et al. Confirmation of the high cumulative incidence of thrombotic complications in critically ill ICU patients with COVID‐19: an updated analysis. Thromb Res 2020;191:148‐150. 10.1016/j.thromres.2020.04.041 [DOI] [PMC free article] [PubMed] [Google Scholar]
- 44. Poissy J, Goutay J, Caplan M, et al. Pulmonary embolism in COVID‐19 patients: awareness of an increased prevalence. Circulation 2020. 10.1161/CIRCULATIONAHA.120.047430 [Epub ahead of print]. [DOI] [PubMed] [Google Scholar]
Associated Data
This section collects any data citations, data availability statements, or supplementary materials included in this article.
Supplementary Materials
Fig S1‐S5