

Abstract
Chloroquine and hydroxychloroquine are quinoline derivatives used to treat malaria. To date, these medications are not approved for the treatment of viral infections, and there are no well‐controlled, prospective, randomized clinical studies or evidence to support their use in patients with coronavirus disease 2019 (COVID‐19). Nevertheless, chloroquine and hydroxychloroquine are being studied alone or in combination with other agents to assess their effectiveness in the treatment or prophylaxis for COVID‐19. The effective use of any medication involves an understanding of its pharmacokinetics, safety, and mechanism of action. This work provides basic clinical pharmacology information relevant for planning and initiating COVID‐19 clinical studies with chloroquine or hydroxychloroquine, summarizes safety data from healthy volunteer studies, and summarizes safety data from phase II and phase II/III clinical studies in patients with uncomplicated malaria, including a phase II/III study in pediatric patients following administration of azithromycin and chloroquine in combination. In addition, this work presents data describing the proposed mechanisms of action against the severe acute respiratory distress syndrome coronavirus–2 and summarizes clinical efficacy to date.
Since coronavirus disease 2019 (COVID‐19), caused by the severe acute respiratory distress syndrome (ARDS) coronavirus–2 (SARS‐CoV‐2), first emerged in late 2019, there has been a widespread search for effective preventive and treatment options to ameliorate the devastating pandemic. As vaccine availability is likely 12 or more months away, there is an immediate need to identify therapeutic options. Early interest, experimental usage, clinical studies, and emergency use authorizations have focused on several potential therapies including antivirals such as remdesivir or antimalarial agents such as chloroquine 1 and hydroxychloroquine 2 with or without the antibacterial agent azithromycin, 3 which has been previously used in the treatment of chloroquine‐resistant malaria given reported in vitro synergy. 4
With the recent results from the Randomised Evaluation of COVID‐19 Therapy (RECOVERY) trial (NCT04381936) as well as the announced suspension of hydroxychloroquine arms in several other trials, there is decreasing support for its use in hospitalized or severely ill patients. However, many trials, particularly in prevention or early treatment settings, or in specific subpopulations, are ongoing. This publication seeks to summarize the current state of knowledge for both chloroquine and hydroxychloroquine, including pharmacokinetic (PK) properties, known pharmacology, and evidence related to use in treatment of COVID‐19. Prior to the current pandemic, more studies had been reported with use of chloroquine than hydroxychloroquine; thus there is notably more information available for chloroquine regarding metabolism, safety, and overall use.
Chemical Structures
Both chloroquine and hydroxychloroquine are orally administered 4‐aminoquinoline antimalarial compounds. The chemical structures of chloroquine and hydroxychloroquine are shown in Figure 1 . Chloroquine is administered as chloroquine phosphate and has a molecular weight of 515.9 g/mol (base: 319.9 g/mol). Hydroxychloroquine is administered as hydroxychloroquine sulfate and has a molecular weight of 433.95 g/mol (base: 335.9 g/mol).
Figure 1.
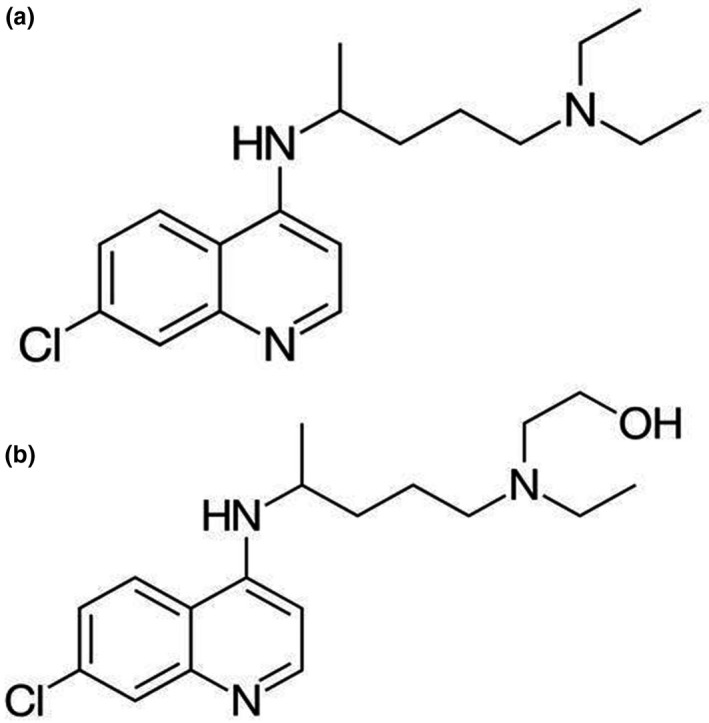
Chemical structure of chloroquine (a) and hydroxychloroquine (b).
Clinical Pharmacology Summary
Table S1 summarizes limited information on the clinical PK of chloroquine and hydroxychloroquine that is available from Aralen (chloroquine phosphate, USP) 5 and Plaquenil (hydroxychloroquine sulfate tablets, USP) 6 US product labels.
Information on the PK of pharmacologically active metabolites of chloroquine and hydroxychloroquine is discussed in multiple publications. 7 , 8 , 9 , 10 , 11 , 12 , 13 , 14 , 15 , 16 , 17 , 18 , 19 , 20 , 21 A summary of the compiled information is provided below.
Absorption
Chloroquine
The majority of the available PK data in literature are from healthy volunteers receiving a single oral dose containing 300 mg or 600 mg chloroquine base (Table 1 ). Cross study comparisons of exposure parameter estimates (maximum concentration (Cmax), area under the concentration‐time curve (AUC), and time to reach Cmax (Tmax)) were not pursued, as different formulations were used across the different studies. Gustafsson et al. reported the mean (± SD) bioavailability of chloroquine from oral tablet as 89 ± 16%. 22 Tmax ranged from 1 to 6 hours across studies, and this variability could be due to in vivo PK variability, formulation differences, and/or administration conditions. In addition, despite being in use for years, the available PK data on the effect of food on chloroquine absorption are limited.
Table 1.
Mean ± SD pharmacokinetic estimates for chloroquine a
| CQ base dose | Study population (Age range in years) | N (nF) | Cmax, µg/mL | Tmax b, h | AUC (Time Durationc), h*µg/mL | T1/2, Days | CL | Vd | Bioanalytical method type: reported LLOQ | References |
|---|---|---|---|---|---|---|---|---|---|---|
| Following administration via IV infusion | ||||||||||
| 15 mg/kg as 4‐hour IV infusion | HV (18–46) | 10 (2) | P: 0.9 ± 0.5 | NA | NA | NA | P: 36 ± 14 L/h | P: 132 ± 50 L/kg | HPLC: NA | 23 |
| Malaria Patients (15–35) | 9 (2) | P: 1.7 ± 0.6 | NA | NA | NA | P: 32 ± 15 L/h | P: 136 ± 64 L/kg | HPLC: NA | ||
| 300 mg as 12–24 min IV infusion | HV (20–36) | 11 (0) | P: 0.8 ± 0.3 | NA | P: 7.5 ± 2.4 (168 h) | P: 12 | P: 43 ± 10 L/h | P: 204 ± 86 L/kg | HPLC: 1 ng/mL | 22 |
| Following single dose administration via oral route | ||||||||||
| 150‐mg tablet | HV (37–42) | 5 (1) | NA | NA |
B: 21.6 P: 1.9 (225 days) |
B: 27 P: 33 |
B: 0.1 L/kg/h P: 1.1 L/kg/h |
B: 79 L/kg P: 869 L/kg |
HPLC: 1.5 Nmol/L in blood, 0.5 Nmol/L | 21 |
| 300‐mg tablet | NA | NA |
B: 29.6 P: 5.2 (225 days) |
B: 53 P: 63 |
B: 0.1 L/kg/h P: 0.8 L/kg/h |
B: 185 L/kg P: 882 L/kg |
||||
| 600‐mg tablet | NA | NA |
B: 92.1 P: 9.4 (225 days) |
B: 52 P: 58 |
B: 0.1 L/kg/h P: 0.9 L/kg/h |
B: 81 L/kg P: 710 L/kg |
||||
| 300‐mg tablet | HV (20–36) | 11 | P: 0.08 ± 0.01 | P: 1–6 |
P: 6 ± 1.3 (168 h) |
P: 12 | NA | NA | HPLC: 1 ng/mL | 22 |
| 300 mg in solution | P: 0.07 ± 0.01 | P: 1–6 |
P: 5 ± 0.9 (168 h) |
P: 9 | NA | NA | ||||
| 300‐mg tablet | HV (23–30) | 8 (3) | P: 0.4 ± 0.1 | P: 1–6 | NA | P: 4.4 ± 0.4 | P: 5 ± 0.4 L/kg/h | P: 16 ± 3 L/kg | HPLC: 1 ng/mL | 8 |
| 600‐mg tablet | HV with history of CQ‐induced pruritus (19–23) | 8 (0) | P: 0.4 ± 0.2 | P: 4–6 |
P: 19 ± 2 (168 h) |
NA | P: 16 ± 5 L/hd | NA | HPLC: 10 ng/mL | 13 |
| HV without history of CQ‐induced pruritus (19–23) | 6 (0) | P: 0.2 ± 0.06 | P: 2–6 |
P: 17 ± 2 (168 h) |
NA | P: 17 ± 5 L/hd | NA | |||
| 600‐mg tablet | HV (20–47) | 16 (12) | P: 0.3 (0.1–0.5c) | P: 1–6 |
P: 15 (11–25 b ) (∞) |
P: 6 (3–14) | P: 40 (25–57b) L/h | P: 7,600 (4,450–12,400)l | HPLC: 5 ng/mL | 14 |
| Following multiple doses administration via oral tablets | ||||||||||
| 300‐mg dose/week for 3 weeks | HV (41e) | 5 (2) | NA | NA |
P: 25 (42 Days) |
P: 16 ± 5f | P: 0.4 ± 0.1L/kg/h | P: 250 ± 116L/kg | HPLC: 1 ng/mL | 24 |
| 200‐mg dose twice/week for 3 weeks | HV (31e) | 4 (0) | NA | NA | P: 14 (42 Days) | P: 16 ± 6 f | P: 0.6 ± 0.1L/kg/h | P: 302 ± 102L/kg | ||
| 50‐mg dose/day for 3 weeks | HV (30e) | 5 (0) | NA | NA | P: 13 (42 Days) | P: 2 0 ± 14 f | P:0.6 ± 0.1L/kg/h | P: 283 ± 112L/kg | ||
AUC, area under the concentration‐time curve; B, blood; CL, apparent clearance; Cmax, maximum plasma concentration; CQ, chloroquine; h, hours; HPLC, high‐performance liquid chromatography; HV, healthy volunteers; IV, intravenous; LLOQ, lower limit of quantification; min, minutes; N, number of subjects/patients; NA, information not available/reported; nF, number of female subjects/patients; P, plasma; SD, standard deviation; T1/2, elimination or terminal half‐life; Tmax, time to reach Cmax; Vd, apparent volume of distribution.
Estimates were adjusted for unit uniformity and rounded.
Range reported.
If specific time duration for AUC is not reported, approximate time duration reported based on sampling duration or reported last concentrations.
Renal clearance estimates.
Mean age reported.
AUC estimates corrected to a single 600‐mg dose.
Hydroxychloroquine
Most of the available PK data in literature are from healthy volunteers receiving a single oral dose of 155 mg hydroxychloroquine base (Table 2 ). Cross‐study comparisons of exposure parameter estimates (Cmax, AUC, and Tmax) were not pursued, as the exact information on different formulations that were used across the different studies was not available. Tett et al. reported the mean (± SD) fraction of the oral dose absorbed as 0.74 (± 0.13) based on the blood and urine PK data. 16 McLachlan et al. reported similar findings with the reported mean fraction absorbed as 0.79 in nine patients with rheumatoid arthritis who received two doses of 155 mg racemic hydroxychloroquine base each, as a tablet and by intravenous infusion. 25 In a separate study, McLachlan et al. reported the lack of food‐effect on the extent of absorption of hydroxychloroquine, except that the absorption lag‐time appeared to be significantly prolonged in the presence of food. 26 Tett et al. evaluated between‐subject and within‐subject PK variability in six healthy volunteers and reported that the between‐subject variability (BSV) in relative bioavailability was (27–38%) higher than the within‐subject variability (11–16%). 27 Based on these findings, Tett et al. suggest a need for individualization of dosing to target concentrations associated with optimal outcomes and may minimize variability in response. 27 The available PK data for hydroxychloroquine are limited to ascertain PK linearity.
Table 2.
Mean ± SD pharmacokinetic parameter estimates for hydroxychloroquine a
| HCQ dose | Study population (Age range in years) | N (nF) | Cmax, µg/mL | Tmax b, h | AUC (Time Durationc), h*µg/mL | T1/2, Days | CL (L/h) | Vd | Bioanalytical method type: Reported LLOQ | References |
|---|---|---|---|---|---|---|---|---|---|---|
| Following administration via IV infusion | ||||||||||
| 155 mg: IV infusion over 0.5 h | HV (19–27) | 5 (3) | P: 0.8 (0.4–1.1b) | NA | NA | P: 26 ± 10 | P: 50 ± 23 | P: 36757 ± 11102 | HPLC: 1 ng/mL | 15 |
| B: 1.9 (1.1–2.4b) | B: 44 ± 12 | B: 6 ± 1 | B: 5791 ± 2566 | |||||||
| 310 mg: IV infusion over 0.5 h | 4 (NA) | P: 1.7 (1.4–2.4b) | P: 53 ± 22 | P: 30 ± 6 | P: 51757 ± 30311 | |||||
| B: 3.3 (2.3–4.2b) | B: 43 ± 22 | B: 6 ± 1 | B: 5254 ± 2021 | |||||||
| Following single dose administration via oral route | ||||||||||
| 155‐mg tablet | HV (19–27) | 5 (3) | P: 0.05 (0.03–0.08b) | 2–4.5 | NA | P: 32 ± 9 | NA | NA | HPLC: 1 ng/mL | 16 |
| B: 0.2 (0.2–0.4b) | B: 50 ± 16 | |||||||||
| 155‐mg tablet with food | HV (26.1 ± 6.9d) | 9 (4) | B: 0.2 (0.1–0.3b) | B: 2.5–6 | NA | NA | NA | NA | HPLC: NA | 26 |
| 155 mg in aqueous solution with food, | B: 0.2 (0.07–0.4c) | B: 2.3–5.2 | ||||||||
| 155‐mg tablet | HV (20–36) | 24 (0) | B: 0.1 ± 0.04 | B: 3–4 | B: 6.4 ± 0.5 (168 h) | NA | B: 2.7 ± 1.6d | NA | HPLC: 5 ng/mL | 17 |
| 155‐mg tablet | HV (20–48) | 10 (4) | B: 0.2 ± 0.01 | B: 1.5–4.6 | B: 1.8 ± 0.9 (32 h) | NA | NA | NA | HPLC: 1 ng/mL | 28 |
| 155 mg in aqueous solution | B: 0.2 ± 0.01 | B: 0.5–5.7 | B: 1.7 ± 1 (32 h) | |||||||
| 155 mg two different tablet formulation | HV (21–29) | 20 (0) | P: 0.03 ± 0.001 | P: 4 ± 1d | P: 1.8 ± 0.4 (∞) | P: 11 ± 3 | NA | NA | LC‐MS/MS: 0.2 ng/mL | 29 |
| P: 0.04 ± 0.03 | P: 4 ± 1d | P: 2 ± 0.4 (∞) | P: 12 ± 4 | |||||||
AUC, area under the concentration‐time curve; B, blood; CL, apparent clearance; Cmax, maximum plasma concentration; CQ, chloroquine; h, hours; HCQ, hydroxychloroquine; HPLC, high‐performance liquid chromatography; HV, healthy volunteers; IV, intravenous; LC‐MS/MS, liquid chromatography with tandem mass spectrometry; LLOQ, lower limit of quantification; N, number of subjects/patients; NA, information not available/reported; nF, number of female subjects/patients; P, plasma; SD, standard deviation; T1/2, elimination or terminal half‐life; Tmax, time to reach Cmax; Vd, apparent volume of distribution.
Estimates were adjusted for unit uniformity and rounded.
Range reported.
If specific time duration for AUC is not reported, approximate time duration reported based on sampling duration or reported last concentrations.
Renal clearance estimates.
McLachlan et al. evaluated blood and plasma concentrations of the enantiomers of hydroxychloroquine in a separate study and reported that (R)‐hydroxychloroquine had higher blood (ratio = 2.2, range = 1.6–2.9) and plasma (ratio = 1.6, range = 1.2–1.9) concentrations compared with the (S)‐enantiomer. 30 Ducharme et al. noted similar findings with reported 62 ± 3% (mean ± SD) of the AUC of rac‐hydroxychloroquine AUC for R(‐)‐hydroxychloroquine. 17
Distribution
Chloroquine
Estimates reported for apparent volume of distribution (V/F) for chloroquine are relatively large and with notable variation (Table 1 ). Edwards et al. reported that chloroquine concentrations in packed cells were higher than the concentrations in plasma with a median ratio (cell:plasma) between 3 and 4. Similar estimates were reported by Gustafsson et al. with a mean ratio (cell:plasma) of 4.8 (range: 2–5). 22 Preclinical studies indicate it is widely distributed in the liver, spleen, kidney, and lung, with concentrations several hundred‐fold above plasma concentrations. 5 Walker et al. evaluated plasma protein binding for chloroquine using equilibrium dialysis and reported mean protein binding as 61 ± 9% (range 46–74%) in plasma from healthy subjects and 64 ± 7% (range 55–79%) in plasma from patients with rheumatoid arthritis. 31 Ofori‐Adjei et al. also evaluated protein binding of chloroquine enantiomers using equilibrium dialysis and reported mean protein binding estimates of 59% for chloroquine that is within the range reported by Walker et al. 32 The findings reported by Ofori‐Adjei et al. suggest chloroquine protein binding is concentration independent over the range of 25–400 ng/mL and (S)‐chloroquine binds more to plasma (~ 67%) than (R)‐chloroquine (~ 49%). Chloroquine is also reported to transfer via placenta and into milk. 33 , 34
Hydroxychloroquine
The reported mean (± SD) blood‐to‐plasma hydroxychloroquine concentration ratio is 7.2 (± 4.2). 15 Estimated protein binding is between 30% and 50%, and hydroxychloroquine is reported to bind to both albumin and alpha‐1‐acid glycoprotein. 35 , 36 The findings reported by McLachlan et al. 35 suggest hydroxychloroquine demonstrates stereoselective protein binding, with (S)‐hydroxychloroquine binding more to plasma (~ 64%) than (R)‐hydroxychloroquine (~ 37%), resulting in approximately 52% average protein binding for racemic mixture. Hydroxychloroquine is reported to transfer via placenta and into milk. 19 , 37 , 38 , 39
Metabolism and drug interaction
Chloroquine
Information on the metabolism and excretion of chloroquine is scarce in the literature, including information on specific metabolism pathways. Ducharme et al. discussed the chloroquine metabolism data from literature and concluded that cytochrome P450 3A isozymes (CYP3As) and CYP2D6 are two enzymes affected or involved in chloroquine metabolism. 40 Projean et al. concluded based on the investigations of chloroquine metabolism in human liver microsomes and recombinant human CYP450s that chloroquine would be metabolized into N‐desethylchloroquine primarily via CYP2C8 and CYP3A4. 41 The same study noted that at low chloroquine concentrations, CYP2D6 may also play a significant role. Based on literature review, it is proposed that the coadministration of drugs that modulate CYP2C8, CYP3A4, and CYP2D6 could have potential effects on the PK of chloroquine. 42 Based on in vitro studies, chloroquine is a weak inhibitor of CYP2D6 but is unlikely to have a significant effect on the PK of other CYP2D6 substrates in humans. 42 Additional information on the potential of drug–drug interaction with chloroquine as object and precipitant is detailed by Kiang et al. 43 , 44 , 45 Table 3 presents results of clinical drug interaction studies involving chloroquine as the precipitant and as the object.
Table 3.
Drug–drug interaction studies involving chloroquine as the object and the precipitant
| Object/Precipitant | Object/Precipitant dose | Change in AUC (%) | Chloroquine dose | References |
|---|---|---|---|---|
| Object | ||||
| Acetaminophen (paracetamol) | 1.5 g | 21.7 | 250 mg chloroquine phosphate IM (150 mg chloroquine base) single dose | 46 |
| Levonorgestrel | 150 µg | 56.7 | 300 mg (formulation not mentioned) single dose | 47 |
| Primaquine | 30 mg (base) | 21 | 1,000 mg chloroquine phosphate (600 mg base) single dose | 14 |
| Tafenoquine | 450 mg | 23.5 | 1,000 mg chloroquine phosphate q.d. (600 mg base) for 2 days | 48 |
| Ethinylestradiol | 30 µg | −4.6 | 300 mg (formulation not mentioned) single dose | 47 |
| Azithromycin | 1,000 mg | 3.0 | 1,000 mg chloroquine phosphate (600 mg base) q.d. on Days 1 and 2, 500 mg chloroquine phosphate (300 mg base) on Day 3 | 49 |
| Precipitant | ||||
| Acetaminophen (paracetamol) |
500 mg single dose |
23.9 |
600 mg (formulation not mentioned) single dose |
50 |
| Cimetidine |
400 mg q.d. for 12 days |
113 | chloroquine sulfate (600 mg base) | 8 |
| Metamizole (dipyrone) |
500 mg single dose |
22.9 |
600 mg (formulation not mentioned) single dose |
8 |
| Acetylsalicylic acid (aspirin) |
325 mg single dose |
0.9 |
600 mg (formulation not mentioned) single dose |
8 |
| Azithromycin |
1,000 mg q.d. for 3 days |
−3.8 |
1,000 mg chloroquine phosphate (600 mg base) q.d. on Days 1 and 2, 500 mg chloroquine phosphate (300 mg base) on Day 3 |
50 |
| Methylene blue |
130 mg b.i.d. for 3 days |
−17.9 |
Males: 1,000 mg chloroquine phosphate q.d. (600 mg base) on Days 1 and 2 and 500 mg (300 mg base) on Day 3 Females: 750 mg chloroquine phosphate (450 mg base) on Days 1 and 2 and 375 mg (225 mg base) on Day 3 |
51 |
| Primaquine |
30 mg (base) single dose |
6.7 |
1,000 mg chloroquine phosphate (600 mg base) single dose |
48 |
| Tafenoquine |
450 mg q.d. 2 days |
−4 | 1,000 mg chloroquine phosphate (600 mg base) q.d. on Days 1 and 2, 500 mg chloroquine phosphate (300 mg base) on Day 3 | 49 |
| Tafenoquine |
450 mg single dose |
−3.7 |
1,000 mg chloroquine phosphate (600 mg base) q.d. for 2 days |
49 |
| Tafenoquine |
450 mg q.d. Days 2 and 3 |
5.6 |
1,000 mg chloroquine phosphate (600 mg base) q.d. on Days 1 and 2, 500 mg chloroquine phosphate (300 mg base) on Day 3 |
49 |
|
Roselle (Hibiscus sabdariffa) Sudanese beverage |
300 mL single dose |
−71.3 |
600 mg (formulation not mentioned) single dose |
52 |
|
Sweet lemon (Citrus limetta) Sudanese beverage |
300 mL single dose |
−68 |
600 mg (formulation not mentioned) single dose |
52 |
|
Tamarind (Tamarindus indica) Sudanese beverage |
300 mL single dose |
−65.4 |
600 mg (formulation not mentioned) single dose |
52 |
All doses administered orally unless otherwise stated.
Precipitant term refers to the drug that causes an effect on the substrate drug by inhibiting or inducing enzymes.
Object term refers to the drug whose exposure may or may not be changed by a precipitant drug.
AUC, area under the concentration‐time curve; IM, intramuscular; q.d., once daily.
Source: UW Drug Interaction Database (DIDB), Copyright University of Washington, accessed: April 6–14, 2020.
Hydroxychloroquine
Similar to chloroquine, information on the metabolism and excretion of hydroxychloroquine is scarce in the literature, including information on specific metabolism pathways. Hydroxychloroquine demonstrates similar PK properties to chloroquine. Hydroxychloroquine’s major metabolite is desethylhydroxychloroquine due to its metabolism by cytochrome P450 enzymes CYP2D6, 2C8, 3A4, and 3A5. 53 Hydroxychloroquine is primarily eliminated through the kidneys. Rainsford, et al. discuss the information on hydroxychloroquine metabolism pathway and potential drug interactions from the literature. 19 In this review, the most significant drug interactions of relevance noted are with methotrexate. Based on the findings from the two studies, 28 , 50 Rainsford, et al. concluded coadministration of hydroxychloroquine with methotrexate causes reduced Cmax while delaying Tmax and lack of any significant drug interactions related to effects on the PK of hydroxychloroquine by methotrexate. In addition, hydroxychloroquine is considered a weak inhibitor of CYP2D6, and 400 mg daily hydroxychloroquine dose increased metoprolol by 50.7%. 54 , 55 Table 4 presents results of clinical drug interaction studies involving hydroxychloroquine as the precipitant and the object, respectively.
Table 4.
Drug–drug interaction studies involving hydroxychloroquine as the object and the precipitant
| Object/ Precipitant | Object/ Precipitant dose | Change in AUC (%) | HCQ dose | HCQ interval | References |
|---|---|---|---|---|---|
| Object | |||||
| Methotrexate | 15 mg | 51.8 | 200 mg | Single dose | 28 |
| Metoprolol | 100 mg | 50.7 | 400 mg (8 days) | Twice daily | 55 |
| MK‐2206 | 200 mg (21‐day cycles) | 16.4 | 400 mg (21‐day cycles) | Twice daily | 56 |
| MK‐2206 | 150 mg (21‐day cycles) | 31.7 | 200 mg (21‐day cycles) | Twice daily | 56 |
| MK‐2206 | 200 mg (21‐day cycles) | 56.2 | 200 mg (21‐day cycles) | Twice daily | 56 |
| MK‐2206 | 135 mg (21‐day cycles) | 92.2 | 400 mg (21‐day cycles) | Twice daily | 56 |
| Precipitant | |||||
| Methotrexate | 15 mg (single dose) | −6.8 | 200 mg (single dose) | 28 | |
Precipitant term refers to the drug that causes an effect on the substrate drug by inhibiting or inducing enzymes.
Object term refers to the drug whose exposure may or may not be changed by a precipitant drug.
AUC, area under the concentration‐time curve; HCQ, hydroxychloroquine.
Source: UW Drug Interaction Database (DIDB), Copyright University of Washington, accessed: April 6–14, 2020.
Excretion
Chloroquine
The estimates for elimination half‐life for chloroquine vary significantly (Table 1 ). Following multiple doses, chloroquine elimination half‐life is reported to range from 30 to 60 days. 57 , 58 Krishna et al. concluded that due to the large V/F (= 100 L/kg), distribution rather than elimination processes determine the blood concentration profile of chloroquine in patients with acute malaria. 57 Other potential reasons for high variability in elimination half‐life for chloroquine could be differences in PK follow‐up duration, improvement in sensitivity of analytical methods over time, and/or different methodologies of calculations. Regarding chloroquine apparent clearance (CL/F), the reported mean estimates ranged from 16 to 40 L/hour (Table 1 ). Estimated urinary recovery of chloroquine is reported to be 46% and 55%. 20 , 22 Augustijns et al. evaluated whole blood PK of chloroquine enantiomers in humans after a single oral dose of the separate enantiomers and reported that the total body clearance was lower for the (R)‐enantiomer (8 ± 2 L/hour) than for the (S)‐enantiomer (14 ± 4 L/hour). 10 The study also reported that terminal half‐life and mean residence time were longer for (R)‐chloroquine (12 days and 16 days, respectively) than for (S)‐chloroquine (10 days and 11 days, respectively).
Hydroxychloroquine
Similar to chloroquine, information on the metabolism and excretion of hydroxychloroquine is scarce in the literature including information on specific metabolism pathways. Fan et al. reported the mean estimated elimination half‐life for hydroxychloroquine to be 11 to 12 days when estimated with hydroxychloroquine plasma concentration over 62 days and 1 to 2 days when estimated with hydroxychloroquine plasma concentration over 72 hours. 29 These findings suggest the impact of PK follow‐up duration on the reported high variability in elimination half‐life for hydroxychloroquine across the studies.
The reported mean amount of hydroxychloroquine excreted unchanged in the urine ranges between 23–27%. 15 , 16 , 69 McLachlan et al. evaluated renal clearance of the hydroxychloroquine enantiomers and reported that (S)‐hydroxychloroquine had a mean (± SD) renal clearance from blood of 41 ± 11 mL/min, approximately twice that of (R)‐hydroxychloroquine. 30 Ducharme et al. note similar findings with the reported total urinary excretion of (S)‐hydroxychloroquine to be higher than that of (R)‐hydroxychloroquine. 17 In the same study, the estimated elimination half‐life of (S)‐hydroxychloroquine (19 ± 5 days) was significantly shorter than that of (R)‐hydroxychloroquine (22 ± 6 days), partly due to its faster urinary excretion and hepatic metabolism. Its renal clearance was twice that of (R)‐hydroxychloroquine (4.61 ± 4.01 vs 1.79 ± 1.30 L/hour).
Population Pharmacokinetic Models
With respect to the use of population PK (POP‐PK) analysis approach, three studies for chloroquine 60 , 61 , 62 and four studies for hydroxychloroquine were identified during the literature search. 18 , 63 , 64 , 65 These studies are summarized in Table 5 , and key information is summarized below. It is noteworthy that the intensity of the PK sampling, sensitivity of bio‐analytical method used, and/or sampling duration may affect the PK model selection process. In addition, the lack of variability in intrinsic and extrinsic factors within the patient/subject population, whose PK data are being utilized for POP‐PK analysis, may affect the ability to identify relationships between covariates and PK.
Table 5.
Population pharmacokinetic studies for chloroquine and hydroxychloroquine
| Study population (Age) | N (nF) | Treatment | PK matrix | Reference |
|---|---|---|---|---|
| Chloroquine | ||||
| Pediatric malaria patients (range: 6 months–5 years) | 83 (34) |
Age 6–24 months: CQ (75 mg base/day for 3 days) + sulfadoxine/pyrimethamine (250 mg/12.5 mg single dose) |
Finger prick/dried blood spot sampling | 60 |
|
Age 25–60 months: CQ (150 mg base/day for 3 days) + sulfadoxine/pyrimethamine (500 mg/25 mg single dose) | ||||
| Pregnant and nonpregnant women (mean age: 26 years) | 60 (60) | 450 mg CQ base for 3 days + single dose of 1500 mg sulfadoxine and 75 mg pyrimethamine | Plasma | 61 |
| Malaria patients (range: 17–52 years) | 75 (39) |
Multiple doses: 10 and 5 mg/kg CQ base at 0 hours and 6–12 hours on day 0, and 5 mg/kg each on day 1 and day 2 + 15 mg/kg/day primaquine base for 14 days starting from the second day (day 1) of CQ |
Plasma | 62 |
| Hydroxychloroquine | ||||
| Rheumatoid arthritis patients (range: 20–81 years) | 123 (88) |
HCQ dosing varied: Single dose: 155 mg HCQ base orally or via 30 min IV infusion Multiple doses: 155 mg/day or 310 mg/day HCQ base dose orally with or without methotrexate |
Whole blood | 63 |
| Healthy adults and malaria patients (approximate mean age: 27 years) | 91 (21) |
Healthy adults: Single oral dose of 310 mg HCQ base or 310 mg/day HCQ base dose/week Malaria patients: 620 mg HCQ base + 310 mg HCQ base at 6, 24, and 48 hours |
Plasma | 18 |
| Patients with CLE or SLE (mean age: 42.5 years) | 90 (66) | Multiple doses: 155–310 mg HCQ base/day | Blood and Plasma | 64 |
| Pregnant women with rheumatic diseases (median age: 31 years) | 50 (50) | Multiple doses: 310 mg/day HCQ base dose for most subjects with or without other concomitant prescription medications | Serum | 65 |
CLE, cutaneous lupus erythematosus; CQ, chloroquine; HCQ, hydroxychloroquine; IV, intravenous; N, number of subjects/patients; nF, number of female subjects/patients; NA, information not available/reported; PK, pharmacokinetic; SLE, systemic lupus erythematosus.
Obua et al. report that the two‐compartmental PK model best described the chloroquine pharmacokinetics based on a POP‐PK analysis that utilized sparse PK data obtained from finger prick sampling in pediatric malaria patients. 59 The same study reports that no correlation was identified between body weight or age with the PK model parameters. Höglund et al. report that for adult malaria patients, the disposition of chloroquine was also adequately described by the two‑compartment model without the use of any covariates on the model parameters. 61 A POP‐PK approach was also used to assess differences in the PK of chloroquine in pregnant and nonpregnant women, and findings are discussed in Special Populations: Pregnancy section of this manuscript. 60 Within the POP‐PK analysis literature on chloroquine discussed here, the reported BSV (coefficient of variation (CV%)) for CL/F estimate was ~ 30% (Relative standard error (RSE): 24–35%). For the V/F estimates for the central compartment, reported BSV (CV%) ranged from 40–57% (RSE: 22–67%). For hydroxychloroquine, Carmichael et al. report that one compartment PK model adequately described its pharmacokinetics based on pooled PK data from several pharmacokinetic studies in patients with rheumatoid arthritis. 62 The same study notes that the limited number of data points per individual resulted in a one‐compartment PK model selection instead of a multicompartment model as reported in the literature. Lim et al. report that in healthy adults and adult malaria patients, hydroxychloroquine pharmacokinetics were best described by a two‐compartment PK model with first‐order absorption with absorption lag time without any covariates. 18 However, Morita et al. report that for patients with cutaneous lupus erythematosus or systemic lupus erythematosus, a one‐compartment model with first‐order absorption and absorption lag time adequately described hydroxychloroquine PK and body weight was identified as a significant (P < 0.001) covariate. 63 Balevic et al. report the use of POP‐PK analysis to assess the effect of pregnancy on the PK of hydroxychloroquine in patients with rheumatic diseases and note a lack of significant changes in hydroxychloroquine exposure due to pregnancy in a small cohort of patients. 64 The study reports that a one‐compartment PK model best described hydroxychloroquine PK and body weight was found to be a significant covariate on V/F. Within the POP‐PK literature on hydroxychloroquine discussed above, the reported BSV (CV%) in CL/F estimates ranged from 16–44% (RSE: 4–41%). For V/F estimates for the central compartment, BSV (CV%) ranged from 16–23% (RSE: ~58%).
Physiologically‐Based Pharmacokinetic Modeling And Tissue Partitioning
SARS‐CoV‐2 is a virus with a predilection for the respiratory system resulting in COVID‐19 in susceptible individuals, leading to ARDS. The target protein and cofactors for viral attachment and uptake are expressed in the lung and bronchial branches. 66 Several researchers have proposed that lung tissue and/or lung‐substructure concentrations of drugs may be used for dose selection in clinical trials for COVID‐19 and ultimately understanding exposure–response against the virus or against the inflammatory response to the virus.
Physiologically‐based pharmacokinetic (PBPK) models leverage characteristics of individual organs and tissues, physicochemical properties, absorption, distribution, metabolism and excretion, and tissue partition coefficients characteristics to allow prediction of systemic and tissue concentrations of parent and/or metabolite over time under various conditions and for various populations. 67 This approach to model‐informed drug development can provide greater insights into local concentration–effect relationships than can empiric‐based PK modeling.
Several PBPK models for hydroxychloroquine have been developed. One was developed to better understand drug concentrations in the lysosome under varying pH conditions as well as various tissues. 68 The other was developed to project optimized dosing of hydroxychloroquine for the treatment of SARS‐CoV‐2 by simulating plasma, blood, and lung concentrations and comparing simulated concentrations with inhibitory concentrations determined in in vitro SARS‐CoV‐2 growth assays (as described in a subsequent section on the In Vitro data for SARS‐CoV‐2). 2
The same investigators have also modified a compound file of chloroquine to model systemic and pulmonary concentrations of chloroquine. The models were verified with observed PK data compared with concentrations predicted in silico in blood and plasma. The tissue partition coefficients were extrapolated from published tissue concentrations in rats.
The PBPK models and simulations for hydroxychloroquine and chloroquine reiterated prior knowledge that blood concentrations for both exceed that of plasma. More importantly, the full PBPK models indicated that hydroxychloroquine and chloroquine both have a predilection for lung. The model‐predicted lung concentrations exceed plasma concentrations at steady state by more than 400‐fold. In addition, if anti‐inflammatory effects and prevention of a cytokine storm are instrumental in treating disease, then drug concentrations in the lung may provide a beneficial effect.
In addition, PBPK modeling and simulation have been utilized to inform dosing decisions for COVID‐19 clinical trials. Ultimately, as efficacy and safety data from multiple COVID‐19 prevention and treatment trials accrue, a more precise estimation across studies will help inform on effective doses and exposures over time.
Toxicities (Adverse Effects)
In both chloroquine and hydroxychloroquine use, gastrointestinal discomfort is the most commonly described side effect manifesting primarily as nausea, vomiting, diarrhea, and stomach pain. These toxicities are more common at higher doses. 69 Hypoglycemia may occur and can be enhanced in patients receiving concurrent hypoglycemic drugs. Rash and itching are well described, and due to the long half‐lives, they may last for prolonged periods after discontinuation. Hemolytic anemia is a serious adverse effect in individuals with glucose‐6‐phosphate dehydrogenase deficiency who receive chloroquine or hydroxychloroquine. 5 , 6 Retinal toxicity is a well‐described adverse effect of hydroxychloroquine; however, it is primarily a concern with chronic and cumulative doses of = 1,000 grams. 70
Effects of chloroquine and hydroxychloroquine on QTc prolongation
Chloroquine
The effects of chloroquine alone as well as chloroquine and azithromycin on corrected QT interval (QTc) prolongation were investigated in a previously unpublished single‐center, open‐label, placebo‐controlled, randomized, multiple‐dose healthy volunteer study (N = 119 total; 24 per group except for the chloroquine + 1,500‐mg azithromycin group where 23 subjects were enrolled. Three subjects withdrew from the chloroquine + 1,500‐mg azithromycin group during the treatment phase of the study due to adverse events (one due to diarrhea, one due to loss of appetite, and one due to nausea, diarrhea, and vomiting) and thus were not included in the pharmacokinetic or QTc analyses). A parallel group design was utilized given the long half‐lives of both chloroquine and azithromycin. Subjects were assigned to one of the following five treatment groups:
Placebo once daily (q.d.) × 3 days
1,000 mg chloroquine phosphate (600 mg base) q.d. × 3 days
1,000 mg chloroquine phosphate plus 500 mg azithromycin q.d. × 3 days
1,000 mg chloroquine phosphate plus 1,000 mg azithromycin q.d. × 3 days
1,000 mg chloroquine phosphate plus 1,500 mg azithromycin q.d. × 3 days
Triplicate 12‐lead electrocardiograms (ECGs) were serially obtained on Day −1 (baseline), Day 1, Day 2, and Day 3, including at 0, 1, 2, 3, 4, 5, 6, 8, 10, and 12 hours on Day 3. Serial plasma samples were obtained for chloroquine and azithromycin quantitation on Days 1–3 including at times immediately following ECG assessments on Day 3. QT interval data were corrected for heart rate using Fridericia’s method (QTcF). In all analyses, the means of the ECG parameters within a triplicate were used as the observations for a subject at a nominal timepoint. The primary end point was change of QTcF from baseline at each nominal timepoint on Day 3. Comparisons were made between treatments vs. placebo and the chloroquine alone group using an analysis of variance model. For each comparison the model‐based mean and 90% confidence interval were reported. No adjustments were made for multiplicity. The mean age, weight, and body mass index were 35.5 years, 83.3 kg, and 26.6, respectively.
In comparison with QTcF values in the placebo group, the chloroquine increased mean time‐matched QTcF values ranging from 18.4 to 35 milliseconds on Day 3 in the chloroquine alone group (Table 6 ). The maximum time‐matched difference in QTcF occurred at 10 hours post dose on Day 3. Maximum observed plasma chloroquine concentrations on Day 3 were similar for all groups (mean 0.335 (CV 29%) µg/mL) and generally occurred between 6 hours and 7 hours post dose. These results are consistent with the large magnitude of effect of chloroquine on QTcF in previous studies. 49 , 71
Table 6.
Analysis of mean change from time‐matched baseline in QTcF repeated measures ANOVA
| Time (hour post dose) | ΔQTcF (milliseconds) | ||
|---|---|---|---|
| Mean | 90% Confidence interval | ||
| Upper limit | Lower limit | ||
| 0 | 18.4 | 13.3 | 23.5 |
| 1 | 22.2 | 17.0 | 27.3 |
| 2 | 25.7 | 20.6 | 30.8 |
| 3 | 27.6 | 22.5 | 32.7 |
| 4 | 31.3 | 26.1 | 36.4 |
| 5 | 29.2 | 24.1 | 34.3 |
| 6 | 29.9 | 24.8 | 35.1 |
| 8 | 31.5 | 26.3 | 36.6 |
| 10 | 35.0 | 29.9 | 40.2 |
| 12 | 32.4 | 27.3 | 37.6 |
Calculation of ΔQTcF: The primary end point was change of QTcF (the corrected QT interval by Fridericia) from Day 1 baseline at each nominal timepoint on Day 3, using Fridericia’s method correcting for heart rate effects on the QT interval. Comparisons were made (on day 3 of a 1,000 mg chloroquine phosphate q.d. regimen) between chloroquine vs. placebo cohorts using an ANOVA (analysis of variance) model.
It should be noted that the high chloroquine dose (600 mg twice daily for 10 days or total dose 12 g) of a recent phase IIb trial of patients with SARS in Manaus, Brazilian Amazon was stopped because of safety. There was a trend for higher lethality compared with the lower dose and one quarter of the high‐dose patients developed QTc = 500 milliseconds. 72 All patients in this study also received 5 days of azithromycin, also a QTc‐prolonging drug.
Hydroxychloroquine
The effect of hydroxychloroquine on QTc is less well studied than the effect of chloroquine. Case reports have noted prolonged QTc values with hydroxychloroquine toxicity. 73 , 74 , 75 , 76 , 77 , 78 In a study of 85 patients with connective tissue disorders who were receiving hydroxychloroquine, the investigators concluded that QT intervals did not appear to be different from what would be considered normal in these patients. 79
Recently there are emerging QT data from 84 patients with SARS‐CoV‐2 infection treated with a combination of hydroxychloroquine and azithromycin. QTc values were determined for subjects at baseline (before administering hydroxychloroquine and azithromycin) and while on drug, but no reference was given regarding doses administered, the timing of QTc assessment with respect to dose, or the formula used to correct QT for heart rate. QTc values were prolonged maximally (28 milliseconds) from baseline between Days 3 and 4. In 30% of patients, QTc increased by greater than 40 milliseconds. In 11% of patients, QTc increased to = 500 milliseconds, representing high‐risk group for arrhythmia. Development of acute renal failure but not baseline QTc was a strong predictor of greater QTc prolongation. 80
Special Populations
Special populations: Renal/Hepatic impairment
Chloroquine
No dose adjustment is suggested by the manufacturer for patients with renal impairment. No dose adjustment is suggested by the manufacturer for those with hepatic impairment; however, caution should be used in patients with hepatic disease and/or alcoholism, as the drug concentrates largely in the liver. Table S1 summarizes the language provided in both the chloroquine and hydroxychloroquine labels regarding both renal and hepatic impairment.
Hydroxychloroquine
No dose adjustment is suggested by the manufacturer for patients with renal impairment. Jallouli, et al. evaluated three patients with systemic lupus erythematosus receiving long‐term dialysis for hydroxychloroquine blood concentrations before and after dialysis. Patients received either 200 mg/day (N = 2) or 400 mg/day (N = 1) of hydroxychloroquine, and blood concentrations did not change significantly before or after dialysis. 81 Hydroxychloroquine was not detected in the dialysis bath of all three patients (< 50 ng/mL). This suggests hydroxychloroquine is not dialyzable. No dose adjustment is suggested by the manufacturer for those with hepatic impairment; however, caution should be used in patients with hepatic disease and/or alcoholism, as the drug concentrates largely in the liver. Table S1 summarizes the language provided in both the chloroquine and hydroxychloroquine labels regarding both renal and hepatic impairment.
Special populations: Age
Geriatric Population: Typical adult dosing is recommended for patients greater than 65 years of age. Hydroxychloroquine and chloroquine clinical trials did not include a sufficient number of geriatric subjects to determine whether they respond differently than younger subjects. However, given both drugs are significantly renally cleared and elderly patients are more likely to have decreased renal function, consideration should be given to dose reduction in this population.
Pediatric Population: Both hydroxychloroquine and chloroquine are preferably dosed based on actual body weight in the pediatric population. The American Academy of Ophthalmology recommends keeping daily doses ≤ 6.5 mg/kg for hydroxychloroquine‐sulfate (≤ 5.0 mg/kg base) and ≤ 3.8 mg/kg chloroquine‐phosphate (≤ 2.3 mg/kg base) for all patients to reduce the risk of retinopathy and permanent vision loss, though this risk is linked to duration of use over years. 82 Approved pediatric doses are above this threshold for treatment of acute uncomplicated malaria.
Chloroquine
In infants, children, and adolescents, the highest approved dose of chloroquine is for the treatment of acute malarial attack. The highest recommended chloroquine dose for the treatment of acute, uncomplicated malarial attack is 10 mg base/kg orally followed by 5 mg base/kg at 6, 24, and 48 hours after initial dose for a total of four doses. 83 Doses for chemoprophylaxis are suggested to be lower. 84 Several fatalities have been reported due to accidental ingestion at even lower doses (0.75–1 g chloroquine‐phosphate in one 3‐year‐old child). 5 The injection label notes that in no instance should a single intramuscular or subcutaneous dose exceed 6.25 mg (5 mg base) per kg of body weight, since children are especially sensitive to the effects of the 4‐aminoquinolines. Severe reactions and sudden death have been reported following parenteral administration in children. 5 , 85
Hydroxychloroquine
In infants, children, and adolescents, 10 mg base/kg followed by 5 mg base/kg hydroxychloroquine at 6, 24, and 48 hours after initial dose is the highest recommended dose for the treatment of acute uncomplicated malarial attack. 83 Doses for chemoprophylaxis, juvenile rheumatoid arthritis, and systemic lupus erythematosus are suggested to be lower. 84
Special populations: Pregnancy
Chloroquine
Based on World Health Organization (WHO) guidelines for the treatment of malaria, chloroquine is considered safe in the first trimester of pregnancy and has been studied in combination with azithromycin for intermittent preventive treatment in pregnancy as a fixed dose combination. Chloroquine and metabolites (desethylchloroquine) can be detected in the cord and urine of newborn infants. 33 , 86 , 87 , 88 , 89 Karunajeewa, et al. performed a population PK analyses of chloroquine and its active metabolite, monodesethylcholorquine in pregnancy. Pregnancy was found to have a significant effect on chloroquine and desethylchloroquine disposition after conventional doses of chloroquine. Exposures of both analytes were found to be significantly lower in pregnant patients (AUCs for chloroquine and desethylchloroquine saw reductions of 25% and 45%, respectively) in comparison with nonpregnant patients. 61
Ogunbona et al. investigated the excretion of chloroquine and desethylchloroquine in breast milk in lactating mothers following a single 600 mg (chloroquine base) oral dose. The maximum daily dose an infant could receive from breastfeeding was ~ 0.7% of maternal starting dose. 90
Hydroxychloroquine
The American Academy of Pediatrics (AAP) considers use of hydroxychloroquine usually compatible with breastfeeding, and hydroxychloroquine is considered appropriate treatment for systemic lupus erythematosus during pregnancy by the American College of Rheumatology. 91 , 92 Unless pregnancy is planned, fetal exposure cannot be avoided by discontinuing hydroxychloroquine at the time pregnancy is discovered, as hydroxychloroquine is stored in the liver with an extended half‐life. Hydroxychloroquine can be detected in cord blood in concentrations similar to those in postpartum maternal serum 93 and crosses the placenta. One study saw no differences when comparing patients with systemic lupus erythematosus with no hydroxychloroquine exposure (N = 163), continuous hydroxychloroquine use (N = 56), and those discontinuing hydroxychloroquine during the first trimester (N = 38) when assessing for miscarriages, stillbirths, pregnancy losses, and congenital abnormalities. 94 Another study by Costedoat‐Chalumeau et al. demonstrated no difference in growth rate and no evidence of visual, hearing, or developmental abnormalities in the mean 26‐month follow‐up of children between the hydroxychloroquine and the control group. 95 Hydroxychloroquine has been shown to be transferred to human breast milk. Breastfed infants are exposed to ~ 2% of maternal dose on a body‐weight basis. 37
Special populations: Critically ill
Considering the adverse event profile and elimination pathway of both hydroxychloroquine and chloroquine, strong consideration to alternative therapies should be made in patients exhibiting these comorbidities. Arentz et al. recently published a case series report discussing characteristics and outcomes of 21 critically ill patients with COVID‐19 in Washington State. Of the 21 patients with polymerase chain reaction–confirmed SARS‐CoV‐2 infection by nasopharyngeal sample, 18 were identified to have comorbidities. Chronic kidney disease (N = 10) and congestive heart failure (N = 9) were the most common comorbidities. 96
Proposed Mechanism of Action For COVID‐19 Disease
Direct antiviral
The presumed mechanism of antiviral activity of chloroquine and hydroxychloroquine is increasing the pH of the endosome that is required for viral/cellular fusion. Using flow cytometry and sorting of SARS‐CoV spike glycoprotein and angiotensin‐converting enzyme 2 (ACE2) on Vero E6 cells, Centers for Disease Control and Prevention (CDC) investigators also found that chloroquine impairs the glycosylation of ACE2, thereby impairing the binding of the virus to its cellular receptor. 97 To date, there are no data on stereospecific antiviral effects of chloroquine or hydroxychloroquine.
Immunomodulatory
In addition to direct antiviral activity, chloroquine and hydroxychloroquine have known immunomodulatory and anti‐inflammatory effects. The anti‐inflammatory effects of hydroxychloroquine were first discovered through the serendipitous observation that World War II soldiers receiving chloroquine for malaria prophylaxis noted improvements in skin rashes and arthritis, ultimately leading to the development of this drug as a treatment for systemic lupus erythematosus and other immunologic conditions such as rheumatoid arthritis. 98 , 99 Immunomodulatory effects of chloroquine as well as hydroxychloroquine include inhibition of antigen presentation to dendritic cells, reduced cytokine production in macrophages, and reduced signaling of both B and T cells. Therefore, in addition to direct antiviral effects, chloroquine and hydroxychloroquine may play a role in reducing the cytokine storm associated with COVID‐19 progression to ARDS. Although these drugs are generally considered more immunomodulatory than immunosuppressive, it is worth pointing out that in early infection, the role of the innate immune system is a critical factor in preventing COVID‐19 progression to serious disease. As our understanding of COVID‐19 pathogenesis evolves, whether these immunomodulatory effects are beneficial or detrimental will need to be elucidated.
In Vitro Data For SARS‐CoV‐2
Chloroquine
Antiviral activity of chloroquine and hydroxychloroquine against COVID‐19 has been mostly investigated in in vitro studies. Following the outbreak of the 2003 SARS virus, several compounds were screened for in vitro activity against SARS‐CoV. In vitro hydroxychloroquine and chloroquine drug sensitivity data for SARS‐CoV‐2 are reported as percent inhibition and are most often obtained from 24‐hour and 48‐hour experiments in Vero or Vero E6 cells derived from African green monkey kidney epithelium. 2 , 100 , 101 , 102 CDC investigators reported that, when added post infection, chloroquine concentrations as little as 0.1 µM (32 ng/mL) reduced viral spread by 50% while chloroquine concentrations of 100 µM (32,000 ng/mL) reduced viral spread by up to 94%. 97 The half‐maximal inhibitory effect was estimated to occur at 4.4 µM ± 1.0 µM (1,408 ± 320 ng/mL). Pretreatment with chloroquine was found to have an even more potent viral inhibition with 0.1, 1, and 10 µM (32,320, and 3,200 ng/mL), reducing infectivity by 28, 53, and 100% respectively, which may suggest lower drug exposures required for prophylaxis than treatment.
Following the COVID‐19 outbreak, Wang et al. tested the in vitro inhibitory activity and cytotoxicity of a number of potential therapeutics against SARS‐CoV‐2, including chloroquine in Vero E6 cells. 100 Of the seven drugs tested, chloroquine (along with remdesivir) had one of the highest selectivity indexes with a half maximal effective concentration (EC50) of 1.13 µM (361 ng/mL) and half maximal cytotoxic concentration > 100 µM (= 32,000 ng/mL). (Table 7 ).
Table 7.
In vitro data for SARS‐CoV‐2
| Cell type | Viral input MOI | Drug incubation (h) | CQ EC50 µM (ng/mL) | HCQ EC50 µM (ng/mL) | References |
|---|---|---|---|---|---|
| Vero E6 | 0.05 | 48 | 1.13 (361) | N/A | 100 |
| Vero | 0.01 | 24 | 23.90 (7,646) | 6.14 (2,062) | 2 |
| Vero | 0.01 | 48 | 5.47 (1,750) | 0.72 (242) | 2 |
| Vero E6 | 0.01 | 48 | 2.71 (867) | 4.51 (1,515) | 101 |
| Vero E6 | 0.02 | 48 | 3.81 (1,219) | 4.06 (1,364) | 101 |
| Vero E6 | 0.2 | 48 | 7.14 (2,284) | 17.31 (5,814) | 101 |
| Vero E6 | 0.8 | 48 | 7.36 (2,354) | 12.96 (4,353) | 101 |
| Vero E6 | 0.001 | 48 | N/A | 4.17 (1,401) | 102 |
CQ, chloroquine; EC50, half maximal effective concentration; HCQ, hydroxychloroquine; MOI, multiplicity of infection; SARS‐CoV‐2, severe acute respiratory distress syndrome coronavirus–2.
Hydroxychloroquine
Similar to chloroquine, hydroxychloroquine has also been tested in a number of in vitro experiments for activity against SARS‐CoV‐2. A wide range of EC50 values has been reported under various conditions (Table 7 ), with some comparative studies finding greater potency with hydroxychloroquine 2 and some less potent. 101 Below is a summary of the various experiments, including experimental characteristics and reported EC50 values, as shown in Table 7 .
Clinical Studies for COVID‐19
For clinical use in COVID‐19, the CDC provides anecdotal dosing suggestions, but explicitly states that optimal dosing and duration of hydroxychloroquine for COVID‐19 are unknown. 103 Translational pharmacokinetic/pharmacodynamic modeling is one approach to propose optimized hydroxychloroquine dosing regimens which ensure the highest likelihood of success as COVID‐19 treatment. With lack of known exposure correlates for efficacy to date, several groups have attempted to integrate available pharmacological data and mechanistic knowledge related to COVID‐19, including in vitro data for SARS‐CoV‐2, historical data on population pharmacokinetics, safety data of hydroxychloroquine from large patient cohorts, and newly emerging clinical pharmacokinetic/pharmacodynamic data from patients with COVID‐19. 2 , 104 , 105 , 106 Early characterization of the clinical exposure–response relationship between hydroxychloroquine and SARS‐CoV‐2 viral load suggests that the hydroxychloroquine doses needed to cause more rapid viral clearance compared with standard of care could be much higher than those currently being studied for COVID‐19 patients in any setting and these doses may lead to substantial risk of cardiac toxicity. 104 , 105 , 106 As these investigations have pointed out, when making in vitro–in vivo extrapolations to optimize dosing, there are many considerations to be made, including (i) the compartment to be targeted (e.g., plasma, intracellular vs. extracellular lung tissue, lung fluid, and other organs), (ii) free vs. total concentrations, (iii) plasma vs. serum vs. whole blood, and (iv) EC50 vs. 90% maximal effective concentration or magnitude above these targets.
Initial support for the use of chloroquine and hydroxychloroquine came from a published report which states that results from 100 patients across multiple institutions found that for the treatment of COVID‐19, chloroquine was superior to standard of care in preventing exacerbation of pneumonia, reducing days to conversion rate and shortening time to clinical recovery. 1 To date, this study has not been published, and data regarding magnitude of benefit, specific dosing or timing of treatment initiation, observed toxicities, and treatments received by the control group are not available. Other data with chloroquine, as mentioned above, is from one 81‐person trial in Brazil, comparing 600 mg chloroquine base twice daily for 10 days (12 g total) with 450 mg × 2 on day 1, then 450 mg daily for 4 additional days (2.7 g total). This study did not have a placebo arm and was halted prior to reaching enrollment goals because higher mortality was observed in the high‐dose chloroquine arm. 72 One additional small study (n = 22) showed no difference between chloroquine and lopinavir/ritonavir for viral clearance. 107
Clinical studies of hydroxychloroquine are heterogeneous in terms of hydroxychloroquine regimen, outcomes measurements (clinical, SARS‐CoV‐2 viral load), and severity of illness. 108 , 109 Only one nonrandomized study has reported a significant reduction in time to viral clearance among patients with mild disease who received hydroxychloroquine or hydroxychloroquine with azithromycin, and this small study had significant limitations, including a control arm with significantly higher viral loads compared with those who received treatment. 110 The largest well‐characterized observational cohorts of hospitalized patients, hydroxychloroquine with or without azithromycin were not associated with a mortality benefit. 111 , 112
Only two randomized clinical trials have been published in hospitalized COVID‐19 patients, one of which found that high‐dose hydroxychloroquine (1,200 mg/day for 3 days followed by 800 mg/day for 2–3 weeks) given to mild or moderately ill patients did not improve time to negative polymerase chain reaction test nor time to alleviation of symptoms. 113 A small randomized study in China reported no apparent clinical benefit of 400 mg daily for 5 days compared with placebo in COVID‐19 patients, the majority of whom had mild disease. 114 Recently, the RECOVERY trial (NCT04381936) stopped enrollment into the hydroxychloroquine arm of their trial in hospitalized COVID‐19 patients, reporting no difference in mortality, hospital stay, or other outcomes, between 1,542 subjects on hydroxychloroquine and 3,132 subjects on standard care. Subsequently, the WHO‐sponsored SOLIDARITY trial and an National Institutes of Health (NIH)‐sponsored trial have suspended enrollment of their hydroxychloroquine arms, reporting no benefit observed, although the data have not yet been released.
Hydroxychloroquine has also been proposed for use in prophylactic settings. The first randomized clinical trial published in an outpatient setting found that high‐dose hydroxychloroquine (800 mg loading dose followed by 600 mg/day for 4 days) given within 4 days of a high‐risk exposure did not reduce the likelihood of acquiring COVID‐19. 115 Studies in high‐risk healthcare workers evaluating a role for preexposure prophylaxis are currently underway.
Discussion
In summary, to date, there is a lack of evidence from controlled, randomized clinical trials powered for efficacy end points (the gold standard for evidence‐based medicine) for use of chloroquine or hydroxychloroquine to treat COVID‐19. Increasingly, evidence points to a lack of benefit in hospitalized and severely ill patients; whether a role exists in early treatment or prevention remains to be determined. Although chloroquine and hydroxychloroquine are very similar in their pharmacologic properties, there are subtle differences of which clinicians and scientists should be aware. The Infectious Disease Society of America released guidelines for the treatment of COVID‐19, recommending hydroxychloroquine only in the context of a clinical trial. 116 While the NIH guidelines state there are insufficient clinical data for or against chloroquine or hydroxychloroquine, they do specifically recommend against the use of high‐dose hydroxychloroquine (defined as 600 mg twice daily for 10 days) or hydroxychlroquine in combination with azithromycin.
Funding
The studies provided in the safety supplement were funded by Pfizer. Medical writing support was provided by Fatima Siddiqui and was funded by Pfizer Inc.
Conflict Of Interest
M.L.R. and P.E.S. are employees of Merck & Co Inc. D.W. is an employee of Certara. J.C. is an employee of Pfizer Inc. M.R.N. and R.M.S. are coinvestigators on separate clinical trials evaluating hydroxychloroquine. All other authors declared no competing interests for this work.
Disclaimer
A.J. and J.H.Z. are employees of the US Food and Drug Administration (FDA). This article reflects the views of the authors and should not be construed to represent the FDA’s views or policies.
Supporting information
Table S1
Pfizer clinical trials cited: A0661139
References
- 1. Gao, J. , Tian, Z. & Yang, X. Breakthrough: Chloroquine phosphate has shown apparent efficacy in treatment of COVID‐19 associated pneumonia in clinical studies. Biosci. Trends 14, 72–73 (2020). [DOI] [PubMed] [Google Scholar]
- 2. Yao, X. et al. In vitro antiviral activity and projection of optimized dosing design of hydroxychloroquine for the treatment of severe acute respiratory syndrome coronavirus 2 (SARS‐CoV‐2). Clin. Infect. Dis. 71,732–739 (2020). 10.1093/cid/ciaa237. [DOI] [PMC free article] [PubMed] [Google Scholar]
- 3. Gautret, P. et al. Hydroxychloroquine and azithromycin as a treatment of COVID‐19: results of an open‐label non‐randomized clinical trial. Int. J. Antimicrob. Agents 56,105949 (2020). 10.1016/j.ijantimicag.2020.105949. [DOI] [PMC free article] [PubMed] [Google Scholar] [Retracted]
- 4. Ohrt, C. , Willingmyre, G.D. , Lee, P. , Knirsch, C. & Milhous, W. Assessment of azithromycin in combination with other antimalarial drugs against Plasmodium falciparum in vitro . Antimicrob. Agents Chemother. 46, 2518–2524 (2002). [DOI] [PMC free article] [PubMed] [Google Scholar]
- 5. Kent, G. & al‐Abadie, M. Factors affecting responses on Dermatology Life Quality Index items among vitiligo sufferers. Clin. Exp. Dermatol. 21, 330–333 (1996). [PubMed] [Google Scholar]
- 6. Eleftheriadou, V. , Thomas, K. , Ravenscroft, J. , Whitton, M. , Batchelor, J. & Williams, H. Feasibility, double‐blind, randomised, placebo‐controlled, multi‐centre trial of hand‐held NB‐UVB phototherapy for the treatment of vitiligo at home (HI‐Light trial: Home Intervention of Light therapy). Trials 15, 51 (2014). [DOI] [PMC free article] [PubMed] [Google Scholar]
- 7. Ette, E.I. , Essien, E.E. , Thomas, W.O. & Brown‐Awala, E.A. Pharmacokinetics of chloroquine and some of its metabolites in healthy volunteers: a single dose study. J. Clin. Pharmacol. 29, 457–462 (1989). [DOI] [PubMed] [Google Scholar]
- 8. Ette, E.I. , Brown‐Awala, E.A. & Essien, E.E. Chloroquine elimination in humans: effect of low‐dose cimetidine. J. Clin. Pharmacol. 27, 813–816 (1987). [DOI] [PubMed] [Google Scholar]
- 9. Essien, E.E. , Ette, E.I. , Thomas, W.O. & Brown‐Awala, E.A. Chloroquine disposition in hypersensitive and non‐hypersensitive subjects and its significance in chloroquine‐induced pruritus. Eur. J. Drug Metab. Pharmacokinet. 14, 71–77 (1989). [DOI] [PubMed] [Google Scholar]
- 10. Augustijns, P. & Verbeke, N. Stereoselective pharmacokinetic properties of chloroquine and de‐ethyl‐chloroquine in humans. Clin. Pharmacokinet. 24, 259–269 (1993). [DOI] [PubMed] [Google Scholar]
- 11. de Vries, P.J. , Oosterhuis, B. & Van Boxtel, C.J. Single‐dose pharmacokinetics of chloroquine and its main metabolite in healthy volunteers. Drug Investig. 8, 143–149 (1994). [Google Scholar]
- 12. Nsimba, S.E. et al. Comparative in vitro and in vivo study of a sugar‐coated chloroquine preparation marketed in Tanzania versus an ordinary brand. J. Clin. Pharm. Ther. 26, 43–48 (2001). [DOI] [PubMed] [Google Scholar]
- 13. Onyeji, C.O. & Ogunbona, F.A. Pharmacokinetic aspects of chloroquine‐induced pruritus: influence of dose and evidence for varied extent of metabolism of the drug. Eur. J. Pharm. Sci. 13, 195–201 (2001). [DOI] [PubMed] [Google Scholar]
- 14. Pukrittayakamee, S. et al. Pharmacokinetic interactions between primaquine and chloroquine. Antimicrob. Agents Chemother. 58, 3354–3359 (2014). [DOI] [PMC free article] [PubMed] [Google Scholar]
- 15. Tett, S.E. , Cutler, D.J. , Day, R.O. & Brown, K.F. A dose‐ranging study of the pharmacokinetics of hydroxy‐chloroquine following intravenous administration to healthy volunteers. Br. J. Clin. Pharmacol. 26, 303–313 (1988). [DOI] [PMC free article] [PubMed] [Google Scholar]
- 16. Tett, S.E. , Cutler, D.J. , Day, R.O. & Brown, K.F. Bioavailability of hydroxychloroquine tablets in healthy volunteers. Br. J. Clin. Pharmacol. 27, 771–779 (1989). [DOI] [PMC free article] [PubMed] [Google Scholar]
- 17. Ducharme, J. , Fieger, H. , Ducharme, M.P. , Khalil, S.K. & Wainer, I.W. Enantioselective disposition of hydroxychloroquine after a single oral dose of the racemate to healthy subjects. Br. J. Clin. Pharmacol. 40, 127–133 (1995). [DOI] [PMC free article] [PubMed] [Google Scholar]
- 18. Lim, H.-S. et al. Pharmacokinetics of hydroxychloroquine and its clinical implications in chemoprophylaxis against malaria caused by Plasmodium vivax . Antimicrob. Agents Chemother. 53, 1468–1475 (2009). [DOI] [PMC free article] [PubMed] [Google Scholar]
- 19. Rainsford, K.D. , Parke, A.L. , Clifford‐Rashotte, M. & Kean, W.F. Therapy and pharmacological properties of hydroxychloroquine and chloroquine in treatment of systemic lupus erythematosus, rheumatoid arthritis and related diseases. Inflammopharamacology 23, 231–269 (2015). [DOI] [PubMed] [Google Scholar]
- 20. Frisk‐Holmberg, M. , Bergqvist, Y. & Domeij‐Nyberg, B. Steady state disposition of chloroquine in patients with rheumatoid disease. Eur. J. Clin. Pharmacol. 24, 837–839 (1983). [DOI] [PubMed] [Google Scholar]
- 21. Frisk‐Holmberg, M. , Bergqvist, Y. , Termond, E. & Domeij‐Nyberg, B. The single dose kinetics of chloroquine and its major metabolite desethylchloroquine in healthy subjects. Eur. J. Clin. Pharmacol. 26, 521–530 (1984). [DOI] [PubMed] [Google Scholar]
- 22. Gustafsson, L.L. et al. Disposition of chloroquine in man after single intravenous and oral doses. Br. J. Clin. Pharmacol. 15, 471–479 (1983). [DOI] [PMC free article] [PubMed] [Google Scholar]
- 23. Edwards, G. , Looareesuwan, S. , Davies, A.J. , Wattanagoon, Y. , Phillips, R.E. & Warrell, D.A. Pharmacokinetics of chloroquine in Thais: plasma and red‐cell concentrations following an intravenous infusion to healthy subjects and patients with Plasmodium vivax malaria. Br. J. Clin. Pharmacol. 25, 477–485 (1988). [DOI] [PMC free article] [PubMed] [Google Scholar]
- 24. Wetsteyn, J.C. , De Vries, P.J. , Oosterhuis, B. & Van Boxtel, C.J. The pharmacokinetics of three multiple dose regimens of chloroquine: implications for malaria chemoprophylaxis. Br. J. Clin. Pharmacol. 39, 696–699 (1995). [DOI] [PMC free article] [PubMed] [Google Scholar]
- 25. McLachlan, A.J. , Tett, S.E. , Cutler, D.J. & Day, R.O. Bioavailability of hydroxychloroquine tablets in patients with rheumatoid arthritis. Br. J. Rheumatol. 33, 235–239 (1994). [DOI] [PubMed] [Google Scholar]
- 26. McLachlan, A.J. , Tett, S.E. , Cutler, D.J. & Day, R.O. Absorption and in vivo dissolution of hydroxycholoroquine in fed subjects assessed using deconvolution techniques. Br. J. Clin. Pharmacol. 36, 405–411 (1993). [DOI] [PMC free article] [PubMed] [Google Scholar]
- 27. Tett, S. , Day, R. & Cutler, D. Hydroxychloroquine relative bioavailability: within subject reproducibility. Br. J. Clin. Pharmacol. 41, 244–246 (1996). [DOI] [PubMed] [Google Scholar]
- 28. Carmichael, S.J. , Beal, J. , Day, R.O. & Tett, S.E. Combination therapy with methotrexate and hydroxychloroquine for rheumatoid arthritis increases exposure to methotrexate. Rheumatol. 29, 2077–2083 (2002). [PubMed] [Google Scholar]
- 29. Fan, H.-W. , Ma, Z.-X. , Chen, J. , Yang, X.-Y. , Cheng, J.-L. & Li, Y.-B. Pharmacokinetics and bioequivalence study of hydroxychloroquine sulfate tablets in Chinese healthy volunteers by LC–MS/MS. Rheumatol. Ther. 2, 183–195 (2015). [DOI] [PMC free article] [PubMed] [Google Scholar]
- 30. McLachlan, A.J. , Tett, S.E. , Cutler, D.J. & Day, R.O. Disposition of the enantiomers of hydroxychloroquine in patients with rheumatoid arthritis following multiple doses of the racemate. Br. J. Clin. Pharmacol. 36, 78–81 (1993). [DOI] [PMC free article] [PubMed] [Google Scholar]
- 31. Walker, O. , Birkett, D.J. , Alván, G. , Gustafsson, L.L. & Sjöqvist, F. Characterization of chloroquine plasma protein binding in man. Br. J. Clin. Pharmacol. 15, 375–377 (1983). [DOI] [PMC free article] [PubMed] [Google Scholar]
- 32. Ofori‐Adjei, D. , Ericsson, O. , Lindström, B. & Sjöqvist, F. Protein binding of chloroquine enantiomers and desethylchloroquine. Br. J. Clin. Pharmacol. 22, 356–358 (1986). [DOI] [PMC free article] [PubMed] [Google Scholar]
- 33. Akintonwa, A. , Gbajumo, S.A. & Mabadeje, A.F. Placental and milk transfer of chloroquine in humans. Ther. Drug Monit. 10, 147–149 (1988). [DOI] [PubMed] [Google Scholar]
- 34. Ette, E.I. , Essien, E.E. , Ogonor, J.I. & Brown‐Awala, E.A. Chloroquine in human milk. J. Clin. Pharmacol. 27, 499–502 (1987). [DOI] [PubMed] [Google Scholar]
- 35. McLachlan, A.J. , Cutler, D.J. & Tett, S.E. Plasma protein binding of the enantiomers of hydroxychloroquine and metabolites. Eur. J. Clin. Pharmacol. 44, 481–484 (1993). [DOI] [PubMed] [Google Scholar]
- 36. Furst, D.E. Pharmacokinetics of hydroxychloroquine and chloroquine during treatment of rheumatic diseases. Lupus 5 (suppl. 1), S11–15 (1996). [PubMed] [Google Scholar]
- 37. Nation, R.L. , Hackett, L.P. , Dusci, L.J. & Ilett, K.F. Excretion of hydroxychloroquine in human milk. Br. J. Clin. Pharmacol. 17, 368–369 (1984). [DOI] [PMC free article] [PubMed] [Google Scholar]
- 38. Østensen, M. , Brown, N.D. , Chiang, P.K. & Aarbakke, J. Hydroxychloroquine in human breast milk. Eur. J. Clin. Pharmacol. 28, 357 (1985). [DOI] [PubMed] [Google Scholar]
- 39. Peng, W. , Liu, R. , Zhang, L. , Fu, Q. , Mei, D. & Du, X. Breast milk concentration of hydroxychloroquine in Chinese lactating women with connective tissue diseases. Eur. J. Clin. Pharmacol. 75, 1547–1553 (2019). [DOI] [PubMed] [Google Scholar]
- 40. Ducharme, J. & Farinotti, R. Clinical pharmacokinetics and metabolism of chloroquine. Clin. Pharmacokinet. 31, 257–274 (1996). [DOI] [PubMed] [Google Scholar]
- 41. Projean, D. et al. In vitro metabolism of chloroquine: identification of CYP2C8, CYP3A4, and CYP2D6 as the main isoforms catalyzing N‐desethylchloroquine formation. Drug Metab. Dispos. 31, 748–754 (2003). [DOI] [PubMed] [Google Scholar]
- 42. Kiang, T.K.L. , Wilby, K.J. & Ensom, M.H.H. (Eds.), Drug interaction potential of antimalarial drugs based on known metabolic properties of antimalarials. In Clinical Pharmacokinetic and Pharmacodynamic Drug Interactions Associated with Antimalarials 17–25. Switzerland: (Springer, 2015). [Google Scholar]
- 43. Kiang, T.K.L. , Wilby, K.J. & Ensom, M.H.H. (Eds.), Pharmacokinetic drug interactions affecting antimalarials. In Clinical Pharmacokinetic and Pharmacodynamic Drug Interactions Associated with Antimalarials 27–55. Switzerland: (Springer, 2015). [Google Scholar]
- 44. Kiang, T.K.L. , Wilby, K.J. & Ensom, M.H.H. (Eds.), Effects of antimalarials on the pharmacokinetics of co‐administered antimalarials. In Clinical Pharmacokinetic and Pharmacodynamic Drug Interactions Associated with Antimalarials 87–117. Switzerland: (Springer, 2015). [Google Scholar]
- 45. Kiang, T.K. , Wilby, K.J. & Ensom, M.H. (Eds.), Effects of antimalarials on the pharmacokinetics of co‐administered drugs. In Clinical Pharmacokinetic and Pharmacodynamic Drug Interactions Associated with Antimalarials 57–85. Switzerland: (Springer, 2015). [Google Scholar]
- 46. Adjepon‐Yamoah, K.K. , Woolhouse, N.M. & Prescott, L.F. The effect of chloroquine on paracetamol disposition and kinetics. Br. J. Clin. Pharmacol. 21, 322–324 (1986). [DOI] [PMC free article] [PubMed] [Google Scholar]
- 47. Back, D.J. , Breckenridge, A.M. , Grimmer, S.F. , Orme, M.L. & Purba, H.S. Pharmacokinetics of oral contraceptive steroids following the administration of the antimalarial drugs primaquine and chloroquine. Contraception 30, 289–295 (1984). [DOI] [PubMed] [Google Scholar]
- 48. Miller, A.K. et al. Pharmacokinetic interactions and safety evaluations of coadministered tafenoquine and chloroquine in healthy subjects. Br. J. Clin. Pharmacol. 76, 858–867 (2013). [DOI] [PMC free article] [PubMed] [Google Scholar]
- 49. Cook, J.A. , Randinitis, E.J. , Bramson, C.R. & Wesche, D.L. Lack of a pharmacokinetic interaction between azithromycin and chloroquine. Am. J. Trop. Med. Hyg. 74, 407–412 (2006). [PubMed] [Google Scholar]
- 50. Raina, R.K. , Bano, G. , Amla, V. , Kapoor, V. & Gupta, K.L. The effect of aspirin, paracetamol and analgin on pharmacokinetics of chloroquine. Indian J. Physiol. Pharmacol. 37, 229–231 (1993). [PubMed] [Google Scholar]
- 51. Rengelshausen, J. et al. Pharmacokinetic interaction of chloroquine and methylene blue combination against malaria. Eur. J. Clin. Pharmacol. 60, 709–715 (2004). [DOI] [PubMed] [Google Scholar]
- 52. Mahmoud, B.M. Significant reduction in chloroquine bioavailablity following coadministration with the Sudanese beverages aradaib, karkadi and lemon. J. Antimicrob. Chemother. 33, 1005–1009 (1994). [DOI] [PubMed] [Google Scholar]
- 53. Kalia, S. & Dutz, J.P. New concepts in antimalarial use and mode of action in dermatology. Dermatol. Ther. 20, 160–174 (2007). [DOI] [PMC free article] [PubMed] [Google Scholar]
- 54. Masimirembwa, C.M. , Gustafsson, L.L. , Dahl, M.L. , Abdi, Y.A. & Hasler, J.A. Lack of effect of chloroquine on the debrisoquine (CYP2D6 and S‐mephenytoin (CYP2C19) hydroxylation phenotypes. Br. J. Clin. Pharmacol. 41, 344–346 (1996). [DOI] [PMC free article] [PubMed] [Google Scholar]
- 55. Tfelt‐Hansen, P. , Ågesen, F.N. , Pavbro, A. & Tfelt‐Hansen, J. Pharmacokinetic variability of drugs used for prophylactic treatment of migraine. CNS Drugs 31, 389–403 (2017). [DOI] [PubMed] [Google Scholar]
- 56. Mehnert, J.M. et al. A phase I trial of MK‐2206 and hydroxychloroquine in patients with advanced solid tumors. Cancer Chemother. Pharmacol. 84, 899–907 (2019). [DOI] [PubMed] [Google Scholar]
- 57. Krishna, S. & White, N.J. Pharmacokinetics of quinine, chloroquine and amodiaquine. Clin. Pharmacokinet. 30, 263–299 (1996). [DOI] [PubMed] [Google Scholar]
- 58. White, N. & Looareesuwan, S. Cerebral malaria. In Kennedy P., Johnson R. (Eds.), Infections of the nervous system pp. 118–44. London, England: Elsevier, (1987). [Google Scholar]
- 59. Miller, D.R. , Khalil, S.K. & Nygard, G.A. Steady‐state pharmacokinetics of hydroxychloroquine in rheumatoid arthritis patients. DICP 25, 1302–1305 (1991). [DOI] [PubMed] [Google Scholar]
- 60. Obua, C. et al. Population pharmacokinetics of chloroquine and sulfadoxine and treatment response in children with malaria: suggestions for an improved dose regimen. Br. J. Clin. Pharmacol. 65, 493–501 (2008). [DOI] [PMC free article] [PubMed] [Google Scholar]
- 61. Karunajeewa, H.A. et al. Pharmacokinetics of chloroquine and monodesethylchloroquine in pregnancy. Antimicrob. Agents Chemother. 54, 1186–1192 (2010). [DOI] [PMC free article] [PubMed] [Google Scholar]
- 62. Höglund, R. , Moussavi, Y. , Ruengweerayut, R. , Cheomung, A. , Äbelö, A. & Na‐Bangchang, K. Population pharmacokinetics of a three‐day chloroquine treatment in patients with Plasmodium vivax infection on the Thai‐Myanmar border. Malar. J. 15, 129 (2016). [DOI] [PMC free article] [PubMed] [Google Scholar]
- 63. Carmichael, S.J. , Charles, B. & Tett, S.E. Population pharmacokinetics of hydroxychloroquine in patients with rheumatoid arthritis. Ther. Drug Monit. 25, 671–681 (2003). [DOI] [PubMed] [Google Scholar]
- 64. Morita, S. , Takahashi, T. , Yoshida, Y. & Yokota, N. Population pharmacokinetics of hydroxychloroquine in Japanese patients with cutaneous or systemic lupus erythematosus. Ther. Drug Monit. 38, 259–267 (2016). [DOI] [PubMed] [Google Scholar]
- 65. Balevic, S.J. , Green, T.P. , Clowse, M.E.B. , Eudy, A.M. , Schanberg, L.E. & Cohen‐Wolkowiez, M. Pharmacokinetics of hydroxychloroquine in pregnancies with rheumatic diseases. Clin. Pharmacokinet. 58, 525–533 (2019). [DOI] [PMC free article] [PubMed] [Google Scholar]
- 66. Lukassen, S. et al. SARS‐CoV‐2 receptor ACE2 and TMPRSS2 are primarily expressed in bronchial transient secretory cells. EMBO J. 39, e105114 (2020). [DOI] [PMC free article] [PubMed] [Google Scholar]
- 67. Polak, S. , Tylutki, Z. , Holbrook, M. & Wiśniowska, B. Better prediction of the local concentration–effect relationship: the role of physiologically based pharmacokinetics and quantitative systems pharmacology and toxicology in the evolution of model‐informed drug discovery and development. Drug Discov. Today 24, 1344–1354 (2019). [DOI] [PubMed] [Google Scholar]
- 68. Collins, K.P. , Jackson, K.M. & Gustafson, D.L. Hydroxychloroquine: a physiologically‐based pharmacokinetic model in the context of cancer‐related autophagy modulation. J. Pharmacol. Exp. Ther. 365, 447–459 (2018). [DOI] [PMC free article] [PubMed] [Google Scholar]
- 69. Munster, T. et al. Hydroxychloroquine concentration–response relationships in patients with rheumatoid arthritis. Arthritis Rheum. 46, 1460–1469 (2002). [DOI] [PubMed] [Google Scholar]
- 70. Ding, H.J. , Denniston, A.K. , Rao, V.K. & Gordon, C. Hydroxychloroquine‐related retinal toxicity. Rheumatology (Oxford) 55, 957–967 (2016). [DOI] [PubMed] [Google Scholar]
- 71. Vicente, J. et al. Assessment of multi‐ion channel block in a phase I randomized study design: results of the CiPA phase I ECG biomarker validation study. Clin. Pharm. Ther. 105, 943–953 (2019). [DOI] [PMC free article] [PubMed] [Google Scholar]
- 72. Borba, M. et al. Chloroquine diphosphate in two different dosages as adjunctive therapy of hospitalized patients with severe respiratory syndrome in the context of coronavirus (SARS‐CoV‐2) infection: Preliminary safety results of a randomized, double‐blinded, phase IIb clinical trial (CloroCOVID‐19 Study). Jama Netw Open 3, e208857 (2020). [DOI] [PMC free article] [PubMed] [Google Scholar]
- 73. Newton‐Cheh, C. , Lin, A.E. , Baggish, A.L. & Wang, H. Case 11–2011: a 47-year‐old man with systemic lupus erythematosus and heart failure. N. Engl. J. Med. 364, 1450–1460 (2011). [DOI] [PubMed] [Google Scholar]
- 74. Radke, J.B. , Kingery, J.M. , Maakestad, J. & Krasowski, M.D. Diagnostic pitfalls and laboratory test interference after hydroxychloroquine intoxication: A case report. Toxicol. Rep. 6, 1040–1046 (2019). [DOI] [PMC free article] [PubMed] [Google Scholar]
- 75. de Olano, J. , Howland, M.A. , Su, M.K. , Hoffman, R.S. & Biary, R. Toxicokinetics of hydroxychloroquine following a massive overdose. Am. J. Emerg. Med. 37, 2264.e5–2264.e8 (2019). [DOI] [PubMed] [Google Scholar]
- 76. Chen, C.-Y. , Wang, F.-L. & Lin, C.-C. Chronic hydroxychloroquine use associated with QT prolongation and refractory ventricular arrhythmia. Clin. Toxicol. (Phila.) 44, 173–175 (2006). [DOI] [PubMed] [Google Scholar]
- 77. Kandan, S.R. & Saha, M. Severe primary hypothyroidism presenting with torsades de pointes. Case Rep. 2012, bcr1220115306 (2012). [DOI] [PMC free article] [PubMed] [Google Scholar]
- 78. Gunja, N. et al. Survival after massive hydroxychloroquine overdose. Anaesth. Intensive Care 37, 130–133 (2009). [DOI] [PubMed] [Google Scholar]
- 79. Costedoat‐Chalumeau, N. et al. Heart conduction disorders related to antimalarials toxicity: an analysis of electrocardiograms in 85 patients treated with hydroxychloroquine for connective tissue diseases. Rheumatology (Oxford) 46, 808–810 (2007). [DOI] [PubMed] [Google Scholar]
- 80. Chorin, E. et al. The QT interval in patients with SARSs‐CoV‐2 infection treated with hydroxychloroquine/azithromycin. Nat Med. 26, 808–809 (2020). [DOI] [PubMed] [Google Scholar]
- 81. Jallouli, M. et al. Determinants of hydroxychloroquine blood concentration variations in systemic lupus erythematosus. Arthritis Rheumatol. 67, 2176–2184 (2015). [DOI] [PubMed] [Google Scholar]
- 82. Marmor, M.F. , Kellner, U. , Lai, T.Y. , Melles, R.B. & Mieler, W.F. Recommendations on screening for chloroquine and hydroxychloroquine retinopathy (2016 revision). Opthalmology 123, 1386–1394 (2016). [DOI] [PubMed] [Google Scholar]
- 83. Schmid‐Ott, G. et al. Stigmatization experience, coping and sense of coherence in vitiligo patients. J. Eur. Acad. Dermatol. Venereol. 21, 456–461 (2007). [DOI] [PubMed] [Google Scholar]
- 84. Sehrawat, M. , Arora, T.C. , Chauhan, A. , Kar, H.K. , Poonia, A. & Jairath, V. Correlation of vitamin D levels with pigmentation in vitiligo patients treated with NBUVB therapy. ISRN Dermatol. 2014, 493213 (2014). [DOI] [PMC free article] [PubMed] [Google Scholar]
- 85. Saeki, H. et al. Guidelines for management of atopic dermatitis. J. Dermatol. 36, 563–577 (2009). [DOI] [PubMed] [Google Scholar]
- 86. Law, I. et al. Transfer of chloroquine and desethylchloroquine across the placenta and into milk in Melanesian mothers. Br. J. Clin. Pharm. 65, 674–679 (2008). [DOI] [PMC free article] [PubMed] [Google Scholar]
- 87. Essien, E.E. & Afamefuna, G.C. Chloroquine and its metabolites in human cord blood, neonatal blood, and urine after maternal medication. Clin. Chem. 28, 1148–1152 (1982). [PubMed] [Google Scholar]
- 88. ASTCT . ASTCT response to COVID‐19 <https://www.astct.org/connect/astct-response‐to‐covid-19= (2020). Accessed April 22, 2020.
- 89. WHO . World Health Organization Guidelines for the treatment of malaria. Geneva, Switzerland: World Health Organization, (2015). https://www.who.int/malaria/publications/atoz/9789241549127/en/ [Google Scholar]
- 90. Ogunbona, F.A. , Onyeji, C.O. , Bolaji, O.O. & Torimiro, S.E. Excretion of chloroquine and desethylchloroquine in human milk. Br. J. Clin. Pharmacol. 23, 473–476 (1987). [DOI] [PMC free article] [PubMed] [Google Scholar]
- 91. Transfer of drugs and other chemicals into human milk. Pediatrics 108, 776–789 (2001). [DOI] [PubMed] [Google Scholar]
- 92. Sammaritano, L.R. et al. 2020 American college of rheumatology guideline for the management of reproductive health in rheumatic and musculoskeletal diseases. Arthritis Rheumatol. 72, 529–556 (2020). [DOI] [PubMed] [Google Scholar]
- 93. Costedoat‐Chalumeau, N. et al. Evidence of transplacental passage of hydroxychloroquine in humans. Arthritis Rheum. 46, 1123–1124 (2002). [DOI] [PubMed] [Google Scholar]
- 94. Clowse, M.E.B. , Magder, L. , Witter, F. & Petri, M. Hydroxychloroquine in lupus pregnancy. Arthritis Rheum. 54, 3640–3647 (2006). [DOI] [PubMed] [Google Scholar]
- 95. Costedoat‐Chalumeau, N. et al. Safety of hydroxychloroquine in pregnant patients with connective tissue diseases: a study of one hundred thirty‐three cases compared with a control group. Arthritis Rheum. 48, 3207–3211 (2003). [DOI] [PubMed] [Google Scholar]
- 96. Arentz, M. et al. Characteristics and outcomes of 21 critically Ill patients With COVID‐19 in Washington State. JAMA 323, 1612–1614 (2020). [DOI] [PMC free article] [PubMed] [Google Scholar]
- 97. Vincent, M.J. et al. Chloroquine is a potent inhibitor of SARS coronavirus infection and spread. Virol. J. 2, 69 (2005). [DOI] [PMC free article] [PubMed] [Google Scholar]
- 98. Al‐Bari, M.A.A. Chloroquine analogues in drug discovery: new directions of uses, mechanisms of actions and toxic manifestations from malaria to multifarious diseases. J. Antimicrob. Chemother. 70, 1608–1621 (2015). [DOI] [PMC free article] [PubMed] [Google Scholar]
- 99. Ben‐Zvi, I. , Kivity, S. , Langevitz, P. & Shoenfeld, Y. Hydroxychloroquine: from malaria to autoimmunity. Clin. Rev. All. Immunol. 42, 145–153 (2012). [DOI] [PMC free article] [PubMed] [Google Scholar]
- 100. Wang, M. et al. Remdesivir and chloroquine effectively inhibit the recently emerged novel coronavirus (2019-nCoV) in vitro . Cell Res. 30, 269–271 (2020). [DOI] [PMC free article] [PubMed] [Google Scholar]
- 101. Liu, J. et al. Hydroxychloroquine, a less toxic derivative of chloroquine, is effective in inhibiting SARS‐CoV‐2 infection in vitro . Cell Discov. 6, 16 (2020). [DOI] [PMC free article] [PubMed] [Google Scholar]
- 102. Touret, F. et al. In vitro screening of a FDA approved chemical library reveals potential inhibitors of SARS‐CoV‐2 replication. Sci Rep. 10, 13093 (2020). [DOI] [PMC free article] [PubMed] [Google Scholar]
- 103. Centers for Disease Control and Prevention (CDC) . Information for Clinicians on Investigational Therapeutics for Patients with COVID‐19 (Clinical Care) <https://www.cdc.gov/coronavirus/2019-ncov/hcp/therapeutic‐options.html= (2020). Accessed April 20, 2020.
- 104. Garcia‐Cremades, M. et al. Optimizing hydroxychloroquine dosing for patients with COVID‐19: An integrative modeling approach for effective drug repurposing. Clin. Pharmacol. Ther. 108, 253–263 (2020). [DOI] [PMC free article] [PubMed] [Google Scholar]
- 105. Fan, J. et al. Connecting hydroxychloroquine in vitro antiviral activity to in vivo concentration for prediction of antiviral effect: a critical step in treating COVID‐19 patients. Clin. Infect. Dis. (2020). 10.1093/cid/ciaa623. [DOI] [PMC free article] [PubMed] [Google Scholar]
- 106. Perinel, S. et al. Towards optimization of hydroxychloroquine dosing in intensive care unit COVID‐19 patients. Clin. Infect. Dis. (2020). 10.1093/cid/ciaa394. [DOI] [PMC free article] [PubMed] [Google Scholar]
- 107. Huang, M. et al. Treating COVID‐19 with chloroquine. J. Mol. Cell Biol. 12, 322–325 (2020). [DOI] [PMC free article] [PubMed] [Google Scholar]
- 108. Hernandez, A.V. , Roman, Y.M. , Pasupuleti, V. Barboza, J.J. & White, C.M. Hydroxychloroquine or chloroquine for treatment or prophylaxis of COVID‐19: a living systematic review. Ann. Intern. Med. (2020) . 10.7326/M20-2496. [DOI] [PubMed] [Google Scholar]
- 109. Pastick, K.A. et al. Hydroxychloroquine and chloroquine for treatment of SARS‐CoV‐2 (COVID‐19). Open Forum Infect. Dis. 7, ofaa130 (2020). [DOI] [PMC free article] [PubMed] [Google Scholar]
- 110. Gautret, P. et al. Clinical and microbiological effect of a combination of hydroxychloroquine and azithromycin in 80 COVID‐19 patients with at least a six‐day follow up: A pilot observational study. Travel Med. Infect. Dis. 34, 101663 (2020). [DOI] [PMC free article] [PubMed] [Google Scholar]
- 111. Geleris, J. et al. Observational study of hydroxychloroquine in hospitalized patients with COVID‐19. N. Engl. J. Med. 382, 2411–2418 (2020). [DOI] [PMC free article] [PubMed] [Google Scholar]
- 112. Rosenberg, E.S. et al. Association of treatment with hydroxychloroquine or azithromycin with in‐hospital mortality in patients with COVID‐19 in New York state. JAMA 323, 2493–2502 (2020). [DOI] [PMC free article] [PubMed] [Google Scholar]
- 113. Tang, W. et al. Hydroxychloroquine in patients with mainly mild to moderate coronavirus disease 2019: open label, randomised controlled trial. BMJ 369, m1849 (2020). [DOI] [PMC free article] [PubMed] [Google Scholar]
- 114. Chen, J. et al. A pilot study of hydroxychloroquine in treatment of patients with common coronavirus disease-19 (COVID‐19). J. Zhejiang Univ. (Med Sci) 49, 215–219 (2020). [DOI] [PMC free article] [PubMed] [Google Scholar]
- 115. Boulware, D.R. et al. A randomized trial of hydroxychloroquine as postexposure prophylaxis for COVID‐19. N. Engl. J. Med. 383, 517–525 (2020). 10.1056/NEJMoa2016638 [DOI] [PMC free article] [PubMed] [Google Scholar]
- 116. Bhimraj, A. et al. Infectious diseases society of America guidelines on the treatment and management of patients with COVID‐19. Clin. Infect. Dis. ciaa478 (2020). 10.1093/cid/ciaa478 [DOI] [PMC free article] [PubMed] [Google Scholar]
Associated Data
This section collects any data citations, data availability statements, or supplementary materials included in this article.
Supplementary Materials
Table S1