

Abstract
The activities performed by Canadian workers in some occupations may increase the risk of exposure to infectious diseases such as COVID‐19. This research note explores how occupational exposure risks vary by labor force characteristics using publicly available Canadian data in combination with a data set providing information on the level of physical proximity and frequency of exposure to infections or diseases faced by workers in different occupations. The results show important sociodemographic differences. First, women work in occupations associated with significantly higher average risks of exposure to COVID‐19 than men. This is driven by their overrepresentation in high‐risk broad occupational categories such as health occupations. Second, older workers (65 years or more), a group vulnerable to COVID‐19, appear to work in occupations requiring performing activities characterized by a lower level of physical proximity than their younger colleagues, with minimal differences in the frequency of exposure to diseases or infections. Finally, workers in low‐income occupations are employed in occupations that put them at greater risk of exposure to COVID‐19 than other workers. This is especially the case for women, immigrants, and members of visible minority groups in low‐income occupations. More broadly, this research note provides insights into the health‐related dimension of the literature on occupational tasks and labor market stratification.
Résumé
Les tâches effectuées par les travailleurs canadiens dans certaines professions peuvent augmenter le risque d'exposition à des maladies infectieuses tel que la COVID‐19. Cette note de recherche explore la variation dans les risques d'exposition à la COVID‐19 selon les caractéristiques des travailleurs en se basant sur des données publiques canadiennes combinées à une base de données fournissant de l'information sur le niveau de proximité physique et la fréquence d'exposition à des infections ou maladie auxquels font face les personnes occupant différentes professions. Les résultats démontrent d'importantes différences entre catégories sociodémographiques. Premièrement, les femmes travaillent dans des professions associées à des niveaux moyens de risques d'exposition à la COVID‐19 significativement plus élevés que les hommes, qui s'explique en partie par leur surreprésentation dans des grandes catégories professionnelles à haut niveau de risque tel que les professions du secteur de la santé. Deuxièmement, les travailleurs âgés (65 ans et plus), un groupe vulnérable à la COVID‐19, semblent travailler dans des professions demandant d'effectuer des tâches menant à un niveau plus faible de proximité physique que leurs plus jeunes collègues, alors que les différences d'exposition à des maladies ou infections sont limitées. Finalement, les personnes travaillant dans des professions à faible revenu tendent également à travailler dans des professions plus à risque d'exposition à la COVID‐19 que les autres travailleurs, ce qui est particulièrement le cas pour les femmes, les immigrants et les personnes membres minorités visibles travaillant dans des professions à faible revenu. De manière plus générale, cette note de recherche explore les implications en matière de santé de la littérature sur les tâches professionnelles et la stratification du marché du travail.
A NUMBER OF INEQUALITIES have become visible among workers since the beginning of the COVID‐19 pandemic. Most notably, public‐facing sectors such as accommodation, food services, retail trade, tourism, and recreation have been highly impacted, translating into important industry differences in job losses in the period immediately following the start of the outbreak (Statistics Canada 2020a). In addition, low‐wage workers are more likely to experience financial difficulties as a result of job losses or absence from work.
Relatedly, recent analyses have highlighted how some occupations require completing activities that increase the risk of infection with COVID‐19. These include the level of physical proximity to other individuals and the frequency of exposure to diseases or infections (of all kinds). Occupations in food processing and health care are examples of such jobs, as highlighted by data on COVID‐19 clusters from news reports ( The New York Times 2020). The objective of this empirical research note is to explore the distribution of occupational exposure risks in the Canadian workforce and to identify the sociodemographic characteristics associated with high or low occupational exposure risk scores (note that the concept of risk of exposure does not allow to directly estimate the risk of infection the same way epidemiological data does).
The results presented below show an unequal distribution of occupational characteristics associated with a higher risk of exposure to COVID‐19 (level of physical proximity with other individuals, and frequency of exposure to diseases or infections) across different groups of the workforce. First, women appear to face higher occupational risks of exposure to COVID‐19 than men. This is driven to a large extent by the fact that women are over‐represented in broad occupational categories that have substantially higher average risk scores, such as health occupations. Second, I also find important differences by Aboriginal identity. In contrast, there are only limited differences by immigration status and visible minority status. Third, outside of health occupations, workers with a Bachelor's degree or more tend to face significantly lower occupational risks of exposure.
Importantly, older workers (55–64 years and 65 years or more), a group at high risk of infection, hospitalization, and complications, including death (Public Health Agency of Canada 2020), do not appear to work in occupations that have a higher physical proximity score than younger workers. Those between 15 and 24 years score the highest. Disaggregated results show that this pattern is found across occupations except in the two highest scoring broad occupational categories, where there is no significant age difference. Meanwhile, the mean score for frequency of exposure to diseases or infections is lower for 15‐ to 24‐year‐old workers compared to all other groups, but the median is the highest. Workers aged 65 or more have a lower mean but higher median score than those between 25 and 64 years. Among workers in health occupations more specifically, an occupational category with extreme values for the exposure to diseases or infections score, 55‐ to 64‐year‐old and 65+ year‐old workers are at higher risk of exposure than their younger colleagues by several points. However, age differences in mean frequency of exposure to infections or diseases are not statistically significant in regression analyses.
Finally, I find that workers in low‐income occupations are more likely to be employed in occupations in the top half of both exposure risk score distributions when compared to those not working in a low‐income occupation. This pattern is especially visible among women, immigrant, and visible minority workers. This is consequential to the extent that low‐income workers may face financial disincentives for absence even if they are sick or vulnerable, increasing the risk of workplace transmission. This finding is especially significant if no measures are taken to close establishments and to provide income support to employees who are absent from work.
This paper provides evidence on which groups of the labor force are at greater risk of exposure to COVID‐19 based on the characteristics of their occupation. In addition to providing evidence of important sociodemographic differences in exposure risks, it shows that gender and education sorting into different occupations is an important driver of disparities in health‐related outcomes at work. In other words, the findings suggest that there are repercussions to gender‐ and education‐based occupational sorting into jobs that bundle tasks differently beyond income and socioeconomic outcomes. A health‐related dimension of “life chances” or “life conditions” is not frequently investigated in the sociological literature on occupations and stratification (Weeden and Grusky 2005; Wodtke 2017), and is gaining visibility as the risk of workplace transmission of COVID‐19 is discussed by the public and in public health policy‐making circles.
While the results presented in this paper contribute to our understanding of exposure risks at work in the context of the COVID‐19 pandemic, it can also be used more broadly to highlight certain sociodemographic determinants of the occupational risks of exposure to other types of infections or diseases at work. The paper relies solely on publicly available data sources in order to ensure a quick turnover. At the time of writing, access to scientific‐use Canadian microdata was not possible. Further analyses building on this paper can contribute to a better understanding of which worker characteristics are associated with a high degree of occupational risk of exposure or of actual infection to COVID‐19 or other infectious disease in order to guide public health decisions at the intersection of occupational safety and health.
REVIEW OF THE LITERATURE
Occupations play an important role in social stratification. Differences in earnings across detailed occupational categories explain a large proportion of the variance in earnings (Mouw and Kalleberg 2010; Weeden et al. 2007; Williams 2013), and a number of studies find that occupation‐level task content and skill intensity account for a substantial portion of the relationship between education and income (Carbonaro 2007; Liu and Grusky 2013; Simard‐Duplain and St‐Denis 2020). Important theoretical statements and empirical studies in sociology emphasize the importance of stratification and class structuration at the level of detailed occupations (Weeden and Grusky 2012). However, in many other cases measuring job task and skill content at the occupational level is a matter of convenience and data availability. This is especially true given the existence of the O*Net data set and its predecessor, the U.S. Dictionary of Occupational Titles, which provides a comprehensive profile of the work activities and features of the work context of detailed U.S. occupations.
More specifically, the O*Net database is administered by the U.S. Department of Labor since 1998, and disseminated online. It collects standardized information on the activities and tasks workers in 974 occupations1 are required to perform as part of their jobs (as well as the knowledge, skills, and abilities requirements), typically using ordinal scales. This information is gathered regularly through surveys of U.S. workers in each occupation and occupational experts. This yields occupation‐level scores that can be matched to observations from other data sources that include compatible occupational codes. In economics, O*Net data on the task content of occupations has been used in studies of occupational employment losses related to the risk of automation (Autor, Levy, and Murnane 2003; Frey and Osborne 2017) and the relationship between occupational task content and offshoring risks (Blinder 2009). Sociologists have used this data for similar purposes, especially in studies of occupation‐level drivers of earnings disparities (Carbonaro 2007; Farkas, England, Vicknair, and Kilbourne 1997; Grodsky and Pager 2001; Liu and Grusky 2013; Weeden 2002; Williams and Bol 2018).
In the context of the COVID‐19 pandemic, O*Net occupational tasks and work activities data has proven relevant in a different way. O*Net data can be used to construct measures of occupational risks of exposure to COVID‐19. Accordingly, Gamio (2020) has combined U.S. labor force data with two variables from the O*Net database to measures differences in the risk of exposure to COVID‐19 across occupations. In Canada, results based on this approach were also published by Vu and Malli (2020). The O*Net variables are (1) the level of physical proximity to other people, and (2) the frequency of overall exposure to diseases and infections. These two variables do not directly measure the risk of infection to COVID‐19. The first measure provides information about close physical proximity with other people, which is an important channel for contracting COVID‐19, and the second measure provides more direct information on the frequency of exposure to individuals who have infections or diseases. In the context of an infectious disease epidemic, occupations scoring high on this second measure could be considered as facing a higher probability of interaction in the workplace with individuals infected by the COVID‐19. Note that the same methodology can be used to study occupational risks of exposure to other infectious diseases following similar transmission mechanisms than COVID‐19.
In this paper, I leverage this approach to ask how occupational risks of exposure to COVID‐19 vary across sociodemographic characteristics (gender, age, education, immigration status, visible minority status, and Aboriginal identity). This approach does not rely on epidemiological data, and the results cannot be used to infer population‐level probabilities or rates of infection, especially to the extent that transmission also occurs in settings other than workplaces, and among nonemployed individuals.2 The approach is nevertheless justified by the fact that while public health data allow to investigate differences in rates of infection, hospitalization or death by gender and age (Public Health Agency of Canada 2020; Purdie et al. 2020), the absence of a systematic collection of measures of education, employment status, and job characteristics in COVID‐19 epidemiological data means that limited statistical evidence exists on the role of work‐related factors in those disparities at the population level.3
The occupational scores should be interpreted as capturing the level of risk of exposure to COVID‐19 (or other similar infectious diseases) at work that results from close physical interaction with colleagues, customers, or other individuals, and from exposure to diseases or infections (in this case, COVID‐19). Without physical distancing and other prevention measures, these characteristics are likely to increase the risk of transmission. Importantly, the scores do not account for the impact of physical distancing measures or other adaptation in the organization of workplaces, or the degree of compliance of different establishments with public health guidelines. Instead, the results may be used to better target interventions by governments and employers aimed at decreasing risks of transmission of infectious diseases such as COVID‐19 during different phases of an epidemic (including the progressive lifting of emergency measures mandating workplace closures).
On a more theoretical level, the objective of this paper is to contribute to an understanding of the health repercussions of the occupation‐level bundling of job tasks in order to shed light on this understudied health‐related dimension of the stratification literature. For example, occupational sorting plays an important role in explaining the gender wage gap in Canada (Schirle 2015; Waite 2017) and the U.S. (Blau and Kahn 2017; England 2010). Accordingly, I also ask whether sociodemographic differences in occupational exposure risks are driven by sorting into broad occupations with different average scores.
DATA AND METHODS
The two variables used in this paper are based on simple questions that ask respondents to rate their work activities along ordinal scales. The score of respondents are averaged, and the variables available from the O*Net database are continuous scores from 0 to 100 that can be mapped onto the ordinal response categories. The Physical Proximity variable is based on the following question: “To what extent does this job require the worker to perform job tasks in close physical proximity to other people?” with results reported a scale from going from 0 “I don't work near other people (beyond 100 ft.)” to 100 “Very close (near touching)” with a total of five ordinal response categories divided by equal intervals of 25 points. The Exposure to Disease or Infections variable asks “How often does this job require exposure to disease/infections?” on a scale from 0 “Never” to 100 “Everyday” designed with the same cutoff values at 25 points intervals. The unweighted correlation between the two scores at the four‐digit occupation level is 0.5320. More details on the content of these variables and the construction of the scores based on ordinal scales is available in Table 1. In addition to the two O*Net‐derived occupational scores, I compute a “composite occupational risk score” combining both measures using a method proposed in Kikuchi and Khurana (2020). This is an additive score that assumes independence in the impact of each work activity.
Table 1.
Distribution of O*Net Work Activity Occupational Scores, Workers Employed in 2015
| Percentage | Frequency | |
|---|---|---|
| Physical proximity | ||
| 0 I don't work near other people (beyond 100 ft.) | 0.2 | 27,660 |
| 25 I work with others but not closely (e.g., private office) | 1.9 | 357,480 |
| 50 Slightly close (e.g., shared office) | 51.8 | 9,575,495 |
| 75 Moderately close (at arm's length) | 39.0 | 7,216,740 |
| 100 Very close (near touching) | 7.2 | 1,322,075 |
| Total | 100.0 | 18,499,450 |
| Exposure to infections or diseases | ||
| 0 Never | 49.2 | 9,103,000 |
| 25 Once a year or more but not every month | 31.6 | 5,845,125 |
| 50 Once a month or more but not every week | 10.9 | 2,008,365 |
| 75 Once a week or more but not every day | 4.1 | 761,030 |
| 100 Every day | 4.2 | 781,930 |
| Total | 100.0 | 18,499,450 |
Note: Occupation score values are rounded to nearest score value cutoff. Each category includes those in a range of ±12.5 points around score value.
Source: Census of Population (2016) and O*Net.
Each detailed Canadian occupation coded using the 2016 National Occupational Classification system (NOC 2016) can be matched to an O*Net score from a corresponding U.S. occupation for both measures, using a correspondence table developed by the Brookfield Institute on Innovation and Entrepreneurship (Vu 2019). This crosswalk was constructed manually, based on the correspondence in the content of the O*Net and NOC 2016 occupation descriptions.4 While the O*Net data set is U.S.‐specific, I assume that most occupations in Canada and the U.S. share similar characteristics, especially in terms of physical proximity and exposure to infection or diseases. In making that assumption, I follow several Canadian studies that adopted a similar approach to map O*Net occupational scores onto NOC 2011 and NOC 2016 occupational codes. For example, a mapping of O*Net scores on the Labor Force Survey NOC 2011 classification was used to study the relationship between O*Net manual and cognitive job task requirements and job match quality in Canada (Summerfield 2014, 2016), and a mapping on the National Household Survey NOC 2011 classification was developed by Statistics Canada in studies of the job skill intensity of different groups of the Canadian population (Frenette and Frank 2017, 2018). Finally, the crosswalk used in this paper was leveraged in a report on the composition of the Canadian tech workforce (Vu, Lamb, and Zafar 2019). O*Net scores were also mapped on data from all European countries included in the European Labor Force Survey from 1993 to 2006 to study the drivers of job polarization (Goos, Manning, and Salomons 2009).
The results presented in this paper are based on public‐use data estimates from the Canadian Long‐Form Census of Population, 2016.5 At the time of writing, this was only the available source of data with the sufficient level of disaggregation (four‐digit occupations).6 It requires assuming that the composition of the workforce in 2020 (occupations, labor force characteristics) is similar to the reference period for data collection (occupation in May 2016, or last occupation for jobless individuals). The sample includes all individuals who were at least 15 years old on Census day (May 10, 2016) and reported employment income for the fiscal year 2015 (worked any number of hours, part‐year or full‐year).
The data set observations are population‐weighted frequencies of respondents reporting nonzero employment income in 2015 in each four‐digit NOC 2016 occupation, broken down by the following sociodemographic characteristics: sex, immigration status (other tables used in this paper instead include a variable on members of a visible minority group or on Aboriginal identity),7 age group (15–24, 25–54, 55–64, and 65 or more years), and highest degree attained. Other variables include mean and median annual employment income in 2015 at the occupation level, broken down by the same sociodemographic characteristics. The data set is used to produce descriptive cross‐tabulations and to estimate ordinary least‐square regression models of the association between sociodemographic characteristics and the three occupational exposure risk measures. The data do not include measures of detailed job characteristics (nonstandard employment contract, firm size, etc.) because these variables are not collected in the 2016 Long‐Form Census.
AGGREGATE SCORE DISTRIBUTION ON ORDINAL SCALE
The scale for each variable an ordinal scale mapped onto a continuous scale ranging from 0 to 100, with five distinct cutoff points each corresponding to an ordinal response category that guides respondent answers. Table 1 presents the distribution of occupational scores weighted by the number of employees in each occupation, based on the ordinal scale ratings. Each category includes all occupations with a score falling in a 25 points band around the cutoff point (±12.5 points around the cutoff value, with the bottom and top categories censored in one direction), meaning that occupational scores are rounded to the nearest cutoff value.
In the top panel of Table 1, I show that the majority of Canadian workers are in occupations that require being slightly close (51.8 percent), such as sharing an office. In addition, another 39.0 percent are in occupations that require working in moderately close proximity to other people (at arm's length, or below the physical distancing COVID‐19 requirements). In other words, 90 percent of workers in Canada work in occupations that require some physical proximity. An additional 7.2 percent are in occupations that require being very close (near touching). This is evidence that establishment closures or job redesign may be necessary to avoid COVID‐19 transmission at work. Meanwhile, approximately half (49.2 percent) of Canadian workers are in occupations where they are never exposed to infections or diseases, and 8.3 percent are in occupations where they are exposed at least every week. The remaining 42.5 percent are in occupations that require being exposed to diseases or infections once a month or less. This means that small but nonnegligible share of the Canadian workforce is employed in occupations likely to involve frequent contacts with individuals infected by COVID‐19. Due to the concentration of the responses into a few categories, the remainder of this paper reports average occupational scores and other distributional statistics relying on continuous scores, in order to identify if certain segments of the workforce experience higher occupational risks of exposure to COVID‐19.
Histograms showing the full distribution of the scores, weighted by occupational employment, are included in the Appendix. Table 1 also reports counts. Note that due to the treatment of missing values, the exclusion of workers without employment income in 2015, as well as random rounding to 0 for small cells, the total population count may differ across tables in this paper.
DISTRIBUTIONAL STATISTICS BY SOCIODEMOGRAPHIC CHARACTERISTICS
Distributional statistics for the numerical occupational scores by sociodemographic category are presented in Tables 2, 3, 4. Table 4 also reports the population distribution across groups (based on Census weighted frequencies, which are estimates of population counts). The distributional statistics for different groups are weighted by the variable reporting the number of employed respondents in that group in 2015 in each occupation.
Table 2.
Distributional Statistics, Occupational Physical Proximity Score
| Mean | Standard Deviation | Median | 25th Percentile | 75th Percentile | |
|---|---|---|---|---|---|
| Total | 61.1 | 15.2 | 58.0 | 48.0 | 72.3 |
| Men | 59.1 | 13.5 | 56.5 | 48.0 | 69.5 |
| Women | 63.3 | 16.5 | 64.0 | 48.0 | 76.0 |
| Canada‐born | 61.3 | 15.1 | 58.0 | 48.0 | 73.0 |
| Immigrant | 60.7 | 15.3 | 57.0 | 47.5 | 72.3 |
| Not a member of a visible minority group (see note) | 61.0 | 15.2 | 58.0 | 48.0 | 72.3 |
| Member of a visible minority group | 61.6 | 15.2 | 58.0 | 48.0 | 72.3 |
| Non‐Aboriginal identity (see note) | 61.1 | 15.2 | 58.0 | 48.0 | 72.3 |
| First Nations people | 62.6 | 15.0 | 63.8 | 50.0 | 75.0 |
| Métis | 62.6 | 15.1 | 63.5 | 50.0 | 75.0 |
| Inuit | 61.1 | 15.0 | 60.7 | 48.0 | 75.0 |
| 15–24 years old | 66.2 | 12.7 | 68.5 | 57.0 | 75.0 |
| 25–54 years old | 60.6 | 15.5 | 57.0 | 47.5 | 73.0 |
| 55–64 years old | 59.4 | 15.0 | 56.0 | 47.3 | 70.0 |
| 65 or more years old | 59.2 | 15.0 | 55.0 | 48.0 | 70.0 |
| No certificate, diploma, or degree | 61.9 | 13.6 | 64.0 | 51.0 | 72.3 |
| Secondary (high) school diploma or equivalency certificate | 61.4 | 13.6 | 62.0 | 50.4 | 72.3 |
| Apprenticeship or trades certificate or diploma | 62.9 | 14.9 | 61.0 | 51.0 | 74.5 |
| College, CEGEP, or other nonuniversity certificate or diploma | 62.2 | 16.1 | 58.0 | 48.0 | 75.0 |
| University certificate or diploma below bachelor level | 60.9 | 15.8 | 57.0 | 47.0 | 75.0 |
| University certificate, diploma, or degree at bachelor level or above | 59.0 | 16.1 | 55.0 | 46.5 | 71.0 |
| 0 Management occupations | 52.7 | 9.3 | 51.0 | 47.3 | 55.0 |
| 1 Business, finance, and administration occupations | 49.8 | 10.1 | 46.0 | 43.0 | 52.0 |
| 2 Natural and applied sciences and related occupations | 51.4 | 9.3 | 48.4 | 46.5 | 57.0 |
| 3 Health occupations | 86.5 | 7.8 | 87.8 | 85.5 | 90.0 |
| 4 Occupations in education, law and social, community, and government services | 65.9 | 15.8 | 70.0 | 54.0 | 79.0 |
| 5 Occupations in art, culture, recreation, and sport | 60.9 | 17.8 | 66.0 | 51.0 | 69.5 |
| 6 Sales and service occupations | 66.5 | 12.2 | 68.5 | 58.0 | 74.5 |
| 7 Trades, transport, and equipment operators and related occupations | 60.5 | 12.3 | 58.0 | 50.4 | 73.0 |
| 8 Natural resources, agriculture, and related production occupations | 60.2 | 18.7 | 70.0 | 44.0 | 76.0 |
| 9 Occupations in manufacturing and utilities | 59.7 | 7.4 | 57.0 | 54.0 | 67.0 |
Note: The data are obtained from Statistics Canada catalogue no. 98‐400‐X2016355, except results by visible minority and by Aboriginal identity, obtained from Statistics Canada catalogue no. 98‐400‐X2016356 and 98‐400‐X2016357, respectively.
Source: Census of Population (2016) and O*Net.
Table 3.
Distributional Statistics, Occupational Exposure to Disease, or Infection Score
| Mean | SD | Median | 25th Percentile | 75th Percentile | |
|---|---|---|---|---|---|
| Total | 20.8 | 23.2 | 13.3 | 4.0 | 29.0 |
| Men | 14.9 | 18.3 | 7.3 | 4.0 | 17.0 |
| Women | 27.1 | 26.1 | 17.0 | 5.3 | 40.0 |
| Canada‐born | 20.9 | 22.9 | 13.7 | 4.3 | 29.0 |
| Immigrant | 20.5 | 24.2 | 10.0 | 4.0 | 29.0 |
| Not a member of a visible minority group (see note) | 20.8 | 22.9 | 13.3 | 4.2 | 29.0 |
| Member of a visible minority group | 20.8 | 24.2 | 11.0 | 4.0 | 29.0 |
| Non‐Aboriginal identity (see note) | 20.7 | 23.2 | 13.0 | 4.0 | 29.0 |
| First Nations people | 23.6 | 21.9 | 16.0 | 5.7 | 33.3 |
| Métis | 22.2 | 23.0 | 14.5 | 5.0 | 30.5 |
| Inuit | 25.5 | 21.1 | 24.0 | 7.0 | 43.0 |
| 15–24 years old | 19.3 | 18.2 | 14.5 | 5.7 | 28.0 |
| 25–54 years old | 21.2 | 24.3 | 11.0 | 4.0 | 29.0 |
| 55–64 years old | 20.9 | 23.3 | 12.0 | 4.0 | 29.0 |
| 65 or more years old | 20.6 | 22.3 | 13.9 | 4.3 | 29.0 |
| No certificate, diploma, or degree | 17.6 | 17.2 | 13.0 | 5.0 | 28.0 |
| Secondary (high) school diploma or equivalency certificate | 17.5 | 17.7 | 13.0 | 5.0 | 28.0 |
| Apprenticeship or trades certificate or diploma | 19.2 | 21.9 | 11.0 | 4.2 | 28.0 |
| College, CEGEP, or other nonuniversity certificate or diploma | 24.6 | 26.9 | 14.0 | 4.0 | 33.3 |
| University certificate or diploma below bachelor level | 23.4 | 26.3 | 14.0 | 4.0 | 31.0 |
| University certificate, diploma, or degree at bachelor level or above | 22.5 | 26.1 | 13.7 | 3.5 | 33.3 |
| 0 Management occupations | 9.7 | 7.1 | 8.0 | 4.0 | 14.0 |
| 1 Business, finance, and administration occupations | 14.8 | 16.4 | 5.0 | 2.8 | 29.0 |
| 2 Natural and applied sciences and related occupations | 6.4 | 7.1 | 4.5 | 1.7 | 8.0 |
| 3 Health occupations | 82.2 | 12.9 | 86.3 | 79.3 | 87.5 |
| 4 Occupations in education, law and social, community, and government services | 33.7 | 19.2 | 36.0 | 14.0 | 46.5 |
| 5 Occupations in art, culture, recreation, and sport | 13.7 | 14.1 | 7.0 | 2.0 | 30.0 |
| 6 Sales and service occupations | 19.9 | 15.7 | 14.5 | 6.0 | 28.0 |
| 7 Trades, transport, and equipment operators and related occupations | 12.8 | 14.6 | 7.0 | 4.0 | 17.0 |
| 8 Natural resources, agriculture, and related production occupations | 12.3 | 7.6 | 9.0 | 8.4 | 19.5 |
| 9 Occupations in manufacturing and utilities | 3.9 | 4.8 | 2.0 | 1.0 | 5.6 |
Note: The data are obtained from Statistics Canada catalogue no. 98‐400‐X2016355, except results by visible minority and by Aboriginal identity, obtained from Statistics Canada catalogue no. 98‐400‐X2016356 and 98‐400‐X2016357, respectively.
Source: Census of Population (2016) and O*Net.
Table 4.
Distributional Statistics, Occupational Composite Risk Score
| Mean | SD | Median | 25th Percentile | 75th Percentile | Population Estimates | |
|---|---|---|---|---|---|---|
| Total | 47.4 | 15.0 | 45.6 | 36.1 | 55.0 | 18,147,370 |
| Men | 44.4 | 12.1 | 41.2 | 35.5 | 50.9 | 9,335,280 |
| Women | 50.6 | 17.1 | 48.5 | 36.7 | 58.1 | 8,812,090 |
| Canada‐born | 47.4 | 14.9 | 45.9 | 36.2 | 55.0 | 13,882,465 |
| Immigrant | 47.1 | 15.5 | 43.9 | 35.5 | 55.0 | 4,264,905 |
| Not a member of a visible minority group (see note) | 47.2 | 14.9 | 45.3 | 36.1 | 54.8 | 14,552,440 |
| Member of a visible minority group | 47.8 | 15.4 | 46.0 | 36.0 | 56.3 | 3,828,200 |
| Non‐Aboriginal identity (see note) | 47.3 | 15.1 | 45.3 | 36.0 | 55.0 | 17,662,695 |
| First Nations people | 49.0 | 13.8 | 47.5 | 38.9 | 56.4 | 366,525 |
| Métis | 48.7 | 14.6 | 47.4 | 37.4 | 56.4 | 305,095 |
| Inuit | 48.6 | 12.9 | 47.5 | 38.9 | 56.6 | 26,960 |
| 15–24 years old | 50.0 | 11.1 | 49.7 | 41.9 | 56.3 | 2,566,775 |
| 25–54 years old | 47.2 | 15.8 | 42.8 | 35.5 | 55.4 | 11,436,430 |
| 55–64 years old | 46.3 | 15.0 | 42.7 | 35.8 | 51.9 | 3,196,570 |
| 65 or more years old | 46.0 | 14.6 | 43.3 | 35.8 | 51.3 | 947,595 |
| No certificate, diploma, or degree | 46.9 | 10.5 | 47.5 | 38.9 | 54.1 | 1,942,065 |
| Secondary (high) school diploma or equivalency certificate | 46.4 | 11.4 | 47.2 | 37.6 | 53.5 | 4,729,145 |
| Apprenticeship or trades certificate or diploma | 48.2 | 14.0 | 46.3 | 37.8 | 55.0 | 1,935,215 |
| College, CEGEP, or other nonuniversity certificate or diploma | 49.3 | 17.3 | 45.6 | 36.5 | 56.6 | 4,059,025 |
| University certificate or diploma below bachelor level | 48.1 | 17.1 | 42.8 | 35.4 | 56.3 | 531,430 |
| University certificate, diploma, or degree at bachelor level or above | 46.5 | 17.4 | 40.1 | 33.6 | 55.4 | 4,950,490 |
| 0 Management occupations | 38.2 | 6.9 | 36.1 | 34.0 | 40.1 | 1,924,975 |
| 1 Business, finance, and administration occupations | 38.0 | 9.7 | 36.4 | 31.8 | 40.7 | 2,910,910 |
| 2 Natural and applied sciences and related occupations | 36.9 | 7.0 | 34.2 | 33.3 | 41.0 | 1,246,260 |
| 3 Health occupations | 84.7 | 7.8 | 85.2 | 80.5 | 86.5 | 1,246,510 |
| 4 Occupations in education, law and social, community, and government services | 53.2 | 14.7 | 55.4 | 40.5 | 65.1 | 2,078,245 |
| 5 Occupations in art, culture, recreation, and sport | 44.9 | 13.7 | 48.2 | 36.1 | 53.5 | 559,990 |
| 6 Sales and service occupations | 50.4 | 7.8 | 49.5 | 47.3 | 56.3 | 4,304,595 |
| 7 Trades, transport, and equipment operators and related occupations | 44.7 | 9.8 | 44.1 | 38.3 | 53.6 | 2,648,325 |
| 8 Natural resources, agriculture, and related production occupations | 43.9 | 12.8 | 50.3 | 34.0 | 54.1 | 411,420 |
| 9 Occupations in manufacturing and utilities | 42.5 | 5.2 | 40.5 | 38.2 | 47.4 | 816,140 |
Note: The data are obtained from Statistics Canada catalogue no. 98‐400‐X2016355, except results by visible minority and by Aboriginal identity, obtained from Statistics Canada catalogue no. 98‐400‐X2016356 and 98‐400‐X2016357, respectively. Totals may not match across sources because of missing values and random rounding.
Source: Census of Population (2016) and O*Net.
Gender
The results show important gender differences. Tables 2 and 3 show that on average, men work in occupations that have both lower physical proximity score (−4.2 points) and lower exposure to disease or infections scores (−12.3 points, or approximately 50 percent of the value for women). Similarly, large gender differences are found for median scores, and an important gap is found between the 75th percentile score values. Note that the distribution for the second variable is skewed to the left with several outliers with high values (in health occupations), translating into large differences between the mean and median score. The results for both scores yield a large average composite risk score difference between men and women (see Table 4).
Immigration Status, Visible Minority, and Aboriginal Identity
There are little systematic differences in the average values for all scores between Canada‐born and immigrant workers. Similarly, limited percentile distribution differences are found, with immigrant workers scoring 3.7 points lower on the median risk of exposure to diseases or infections than Canadian‐born workers. This small difference is meaningful given the compressed distribution of the score on this variable. However, the values for the 75th percentile are the same on that measure, at 29.0, suggesting that the share of workers in occupations at frequent risk of exposure to infections or diseases (more than every year, approximately) is similar in both groups. The same pattern is found when comparing members of visible minority groups with those who are not. In contrast, distributional statistics for First Nations people, Métis and Inuit, each show higher average and median physical proximity and exposure to disease and infection scores than those with a non‐Aboriginal identity (one exception is the gap between Inuit and non‐Aboriginal physical proximity scores, which is visible at the median but not the mean). Gaps are especially large for the risk of occupational exposure to diseases or infections. This translates into gaps in mean and median composite scores as well.
Age Group
Table 2 shows that younger workers (15–24 years) are employed in occupations that have a higher average physical proximity score than other age groups, at 66.2 points. Prime‐age workers score at 60.6. The values for the older age groups (55–64 years and 65 or more years) are slightly below 60 points. Younger workers also have the highest median physical proximity occupational score, at 68.5 points (a gap of 10 points or more with workers in all other age groups). Differences are visible at the 25th percentile and to a lesser extent at the 75th percentile as well.
On the other hand, Table 3 shows that younger workers have a slightly lower average exposure to disease or infections score than other age groups (−1.3 to −1.9 difference compared to older age groups). In contrast, they have a higher median occupational score, alongside 65‐year‐old or more workers, suggesting that the share of young workers in occupations with very high scores is small, although the overall distribution may lean towards higher scores. These patterns translate into a 2.8 to 4.0 negative difference in average composite risk score between younger workers and workers in other age groups, as reported in Table 4, and similar differences in median composite risk scores. This means that results based on the composite risk score may mask important dynamics such as the contrasting relationship between age and the two scores.
Highest Degree Attained
I find meaningful differences in occupational risk scores by education. First, those with a university certificate, diploma, or degree at bachelor level or above have a lower average physical proximity score than all other groups by two to three points (Table 2). Differences in median scores are substantially larger, suggesting the presence of certain high‐scoring occupations among otherwise low‐scoring occupations for highly educated workers (also see the larger interquartile range in the last two columns of Table 2). Workers with no certificate, diploma, or degree, those with apprenticeship or trades certificate or diploma, and with college, CEGEP, or other nonuniversity certificate or diploma have substantially higher mean and median scores.
Second, there is a positive relationship between educational attainment and occupational exposure to disease or infections score (Table 3). College, CEGEP, and university‐educated workers have a higher average risk score, likely associated with working in a health care sector job. Education‐related differences in median scores are smaller, and percentile distribution differences are mostly visible in the values for the 75th percentile value, meaning that more highly educated workers are more likely to work in occupations that are among those requiring the most frequent exposure to diseases or infections. Again, the contrasting patterns for the two measures translate into little difference by education in the mean composite risk score and lower median values (but no difference at the 75th percentile) for more educated workers, as shown in Table 4.
Broad Occupational Categories
Finally, results by broad occupational categories (one‐digit) are reported. Table 2 shows that health occupations have very high mean and median physical proximity scores relative to other occupations, at 86.5 points compared to an average of 61.1 points for all workers (first row of Table 2). The interquartile range bounds (25th and 75th percentiles are also very high, with 75 percent of workers in health occupations scoring above 85.5 points, above at least 75 percent or workers in any other occupation (the 75th percentile of all other occupations is below 85 points). Sales and services occupations and occupations in education, law and social, community, and government services also have high mean and median scores, while professional occupations (management, business, finance, and administration, and natural and applied sciences occupations) score the lowest.
Table 3 shows that health occupations also score very high on exposure to diseases or infections with a mean score of 82.2 and a median score of 86.3 points. The 25th percentile value indicates that at least 75 percent of workers in health care occupations are exposed to diseases or infections at least once a week, consistent with what one would expect for workers in such occupations. The gap in median and mean scores with other occupations is of 50 points or more. Occupations in education, law and social, community, and government services, and sales and services occupations again have the second and third highest mean and median scores. Those in manufacturing and utilities occupations score the lowest (most workers are almost never exposed). The occupational patterns are relatively consistent for both scores, translating into similar results for the composite risk score.
REGRESSION ANALYSIS
The distributional statistics reported above provide evidence of important differences in occupational risks of exposure to infectious diseases such as COVID‐19 by gender, age, Aboriginal identity, education, and broad occupational category. In order to distinguish the net role of each variable in driving occupational exposure risk differences across the labor force, I provide estimates from multivariate analysis (ordinary least square regressions) in Table 5. This method is used to identify the net association between worker characteristics and average occupational risk scores because different worker characteristics may be correlated. The standard tables used in this analysis are available at the aggregate level rather than as microdata. Therefore, the data set is formed of cells of individual‐level observations aggregated into all sex‐age group‐education‐immigration status configuration8 for each four‐digit NOC occupations. This yields a data set of 47,450 observations. Each cell is weighted using its population frequency estimates. The dependent variables are the three O*Net occupation risk of exposure scores attributed to each four‐digit NOC occupation.
Table 5.
Regression of Risk Scores on Labor Force Characteristics
| Physical Proximity | Exposure to Infections or Diseases | Composite Risk Score | ||||
|---|---|---|---|---|---|---|
| 1 | 2 | 3 | 4 | 5 | 6 | |
| Men | (Reference) | (Reference) | (Reference) | (Reference) | (Reference) | (Reference) |
| Women | 4.5*** | 1.7*** | 11.9*** | 2.8*** | 6.3*** | 1.7*** |
| Canada‐born | (Reference) | (Reference) | (Reference) | (Reference) | (Reference) | (Reference) |
| Immigrant | 0.6 | 0.3 | −0.7 | 0.2 | 0.3 | 0.3 |
| 15–24 years old | (Reference) | (Reference) | (Reference) | (Reference) | (Reference) | (Reference) |
| 25–54 years old | −5.4*** | −3.2*** | 0.4 | 0.7 | −3.2*** | −1.6*** |
| 55–64 years old | −6.8*** | −4.2*** | 0.8 | 1.3 | −4.0*** | −2.1*** |
| 65 or more years old | −6.6*** | −4.3*** | 1.6 | 1.4 | −3.7*** | −2.2*** |
| No certificate, diploma, or degree | (Reference) | (Reference) | (Reference) | (Reference) | (Reference) | (Reference) |
| Secondary (high) school diploma or equivalency certificate | −0.9 | 0.4 | −1.0 | −1.4 | −1.0 | −0.2 |
| Apprenticeship or trades certificate or diploma | 2.4* | 1.8 | 2.6 | −0.6 | 2.4* | 1.0 |
| College, CEGEP, or other nonuniversity certificate or diploma | 0.3 | 0.2 | 4.9** | −1.7 | 1.7 | −0.4 |
| University certificate or diploma below bachelor level | −0.9 | −0.6 | 3.7* | −2.9** | 0.5 | −1.2* |
| University certificate, diploma, or degree at bachelor level or above | −2.7* | −2.8** | 3.2 | −5.5*** | −0.9 | −3.4*** |
| 0 Management | −11.7*** | −8.8*** | −10.6*** | |||
| 1 Business, finance, and administration | −15.5*** | −4.7*** | −11.6*** | |||
| 2 Natural and applied sciences and related occupations | −12.6*** | −10.8*** | −11.3*** | |||
| 3 Health occupations | 21.3*** | 63.0*** | 35.2*** | |||
| 4 Education, law and social, community, and government services | 1.4 | 15.5*** | 4.5*** | |||
| 5 Art, culture, recreation, and sport | −4.5*** | −5.0*** | −4.5*** | |||
| 6 Sales and service | (Reference) | (Reference) | (Reference) | |||
| 7 Trades, transport and equipment operators, and related occupations | −5.0*** | −6.3*** | −5.0*** | |||
| 8 Natural resources, agriculture, and related production occupations | −5.6*** | −7.1*** | −6.1*** | |||
| 9 Manufacturing and utilities | −5.8*** | −15.7*** | −7.4*** | |||
| Constant | 64.4*** | 67.9*** | 12.6*** | 19.4*** | 47.0*** | 51.2*** |
| R 2 | 0.05 | 0.40 | 0.08 | 0.63 | 0.06 | 0.61 |
* p < .10; ** p < .05; *** p < .01.
Note: Number of observations: n = 47,450; population estimates: N = 18,147,370.
Source: Census of Population (2016) and O*Net.
In the first set of models, each occupational risk score is regressed on gender, immigration status, age group, and highest degree attained. These models are under the first column under each score type (models 1, 3, and 5). The estimates are consistent with descriptive results, with large gender differences and little differences by immigration background for all occupational scores. No statistically significant age difference is found for the exposure to disease or infections risk score, and younger workers (15–24 years) have a substantially and significantly higher average occupational physical proximity risk score than the three other age groups. That pattern is also found, muted, in the composite risk score estimates. Lastly, the estimates by highest degree attained are also consistent with the patterns identified in the descriptive analysis. The physical proximity score of workers with apprenticeship or trades certificate or diploma is significantly higher than those with no certificate, diploma, or degree, while it is significantly lower for those with a university certificate, diploma, or degree at bachelor level or above. In contrast, the exposure to infections or diseases score is higher for more educated workers than those without a certificate, diploma, or degree, although the difference is only significant for those with a college, CEGEP, or other nonuniversity certificate or diploma, and with a university certificate or diploma below bachelor level. Overall, statistical significance is low or null for most education estimates, suggesting little net role for this variable.
A categorical variable capturing the one‐digit broad occupational category of each observation is introduced in the second set of regression models. These models are reported in the second column under each score type (models 2, 4, and 6). They accomplish the following two objectives. First, they provide estimates of the net association between different occupations and the risk scores. Second, they provide some evidence on the role of occupational differences as a mechanism driving other group differences. More specifically, if the regression coefficients on gender, immigration, age, and education decrease in size, I conclude that those group differences are explained by the sorting of workers with different characteristics in broad occupations with different average scores.
Results for these models show that the coefficients for women decrease by a substantial amount (by two thirds for physical proximity and 75 percent for exposure to infections or diseases, approximately), while the coefficients for age in models using physical proximity and the composite score as a dependent variable become less negative. This means that gender and age differences are partially explained by the fact that women and younger workers are employed in broad occupational categories with higher average occupational risk scores. Most notably, the second and third rows of the last column of Tables A1 to A4 show that women are strongly over‐represented in the three broad occupational categories with the highest occupational risks of exposures (60 percent of workers in those occupations or more), while men are overrepresented in the remaining occupations.
The results for education are also noteworthy in the case of the model using exposure to diseases and infections as a dependent variable. The coefficients for workers with a college or university education change sign (from positive to negative), meaning that when controlling for occupations, workers with a higher level of education have a lower risk of exposure to diseases or infections than those without a secondary degree. The differences between models 3 and 4 can be interpreted as showing that although workers with a higher level of education work in broad occupations that have a higher average exposure to diseases or infections risk score (likely health care sector occupations), within each broad occupational categories they are in four‐digit occupations that have a lower average risk score than less educated workers.
Finally, note that the coefficients on the one‐digit occupations dummies are almost all statistically significant and negative (results are relative to sales and services occupations, which is used as the reference category), and estimates for health occupations are large and positive. These results are consistent with the distributional statistics reported in the previous section.9
DISPARITIES IN RISKS OF EXPOSURE WITHIN HIGH‐RISK OCCUPATIONAL GROUPINGS
Because of the high score on the exposure to diseases and infections in health occupations, I report specific regression results in Table 6 for the 1.2 million Canadians who work in health occupations10 (NOC 2016 one‐digit code 3). I do the same for two other occupational groupings that score high on all measures of occupational exposure risks: occupations in education, law and social, community, and government services (NOC 2016 one‐digit code 4), and sales and services occupations (NOC 2016 one‐digit code 6). Results for the seven residual broad occupational categories grouped together are also reported in Table 6. Occupational risk of exposure scores are regressed on gender, immigration status, age, and education separately for each of these four occupational groupings. For the residual, Other NOC codes subsample, a model with controls for broad occupational category is also estimated. Distributional statistics for each subsample are reported in Tables A1 to A4.
Table 6.
Regression of Risk Scores on Labor Force Characteristics, by Broad Occupational Group
| Physical proximity | |||||
|---|---|---|---|---|---|
| NOC 3 | NOC 4 | NOC 6 | Other NOC | Other NOC, 2 | |
| Men | (Reference) | (Reference) | (Reference) | (Reference) | (Reference) |
| Women | −0.8 | 6.5* | 3.3*** | −3.0*** | −0.2 |
| Canada‐born | (Reference) | (Reference) | (Reference) | (Reference) | (Reference) |
| Immigrant | −0.4 | −0.6 | 0.3 | 0.7 | 0.4 |
| 15–24 years old | (Reference) | (Reference) | (Reference) | (Reference) | (Reference) |
| 25–54 years old | 0.3 | 1.9 | −5.1*** | −3.6*** | −2.5** |
| 55–64 years old | −0.3 | 0.5 | −7.6*** | −4.3*** | −2.9*** |
| 65 or more years old | 0.1 | −1.3 | −6.3*** | −4.6*** | −3.0*** |
| No certificate, diploma, or degree | (Reference) | (Reference) | (Reference) | (Reference) | (Reference) |
| Secondary (high) school diploma or equivalency certificate | −1.1 | −5.0* | 0.6 | −1.0 | 0.7 |
| Apprenticeship or trades certificate or diploma | 0.9 | −2.7 | 5.2* | 0.8 | 1.0 |
| College, CEGEP, or other nonuniversity certificate or diploma | 0.3 | −5.9* | 1.1 | −2.7* | 0.0 |
| University certificate or diploma below bachelor level | 0.1 | −8.3*** | 0.8 | −4.0*** | −0.7 |
| University certificate, diploma, or degree at bachelor level or above | −1.0 | −13.3*** | 0.0 | −6.2*** | −2.4* |
| Occupation controls (one‐digit) | Yes | ||||
| Constant | 87.4*** | 70.0*** | 67.6*** | 61.8*** | 52.8*** |
| R 2 | 0.01 | 0.12 | 0.08 | 0.07 | 0.16 |
| Number of observations (n) | 3,456 | 3,450 | 5,184 | 35,360 | 35,360 |
| Population estimates (N) | 1,246,510 | 2,078,245 | 4,304,595 | 10,518,020 | 10,518,020 |
| Exposure to infections or diseases | |||||
|---|---|---|---|---|---|
| NOC 3 | NOC 4 | NOC 6 | Other NOC | Other NOC, 2 | |
| Men | (Reference) | (Reference) | (Reference) | (Reference) | (Reference) |
| Women | −0.3 | 5.5 | 0.0 | 4.8*** | 4.0*** |
| Canada‐born | (Reference) | (Reference) | (Reference) | (Reference) | (Reference) |
| Immigrant | 0.9 | −1.3 | 2.0 | −1.3* | −0.7 |
| 15–24 years old | (Reference) | (Reference) | (Reference) | (Reference) | (Reference) |
| 25–54 years old | 1.7 | 6.0 | 2.4 | −2.4 ** | −2.1* |
| 55–64 years old | 3.0 | 3.9 | 4.1* | −1.5 | −1.3 |
| 65 or more years old | 4.0* | 2.6 | 2.7 | −0.3 | −0.5 |
| No certificate, diploma, or degree | (Reference) | (Reference) | (Reference) | (Reference) | (Reference) |
| Secondary (high) school diploma or equivalency certificate | −2.6* | −5.8* | −3.5 | 0.6 | 0.5 |
| Apprenticeship or trades certificate or diploma | −0.3 | −1.9 | 0.4 | 1.0 | 0.1 |
| College, CEGEP, or other nonuniversity certificate or diploma | 1.1 | −4.5 | −5.3* | 0.2 | 0.2 |
| University certificate or diploma below bachelor level | 2.0 | −8.7** | −6.4** | −0.8 | −0.8 |
| University certificate, diploma, or degree at bachelor level or above | 1.1 | −16.1*** | −9.2*** | −2.4** | −2.0* |
| Occupation controls (one‐digit) | Yes | ||||
| Constant | 79.6*** | 36.4*** | 21.2*** | 12.1*** | 14.2*** |
| R 2 | 0.01 | 0.12 | 0.04 | 0.05 | 0.10 |
| Number of observations (n) | 3,456 | 3,450 | 5,184 | 35,360 | 35,360 |
| Population estimates (N) | 1,246,510 | 2,078,245 | 4,304,595 | 10,518,020 | 10,518,020 |
* p < .10; ** p < .05; *** p < .01.
Source: Census of Population (2016) and O*Net.
First, the results show that gender differences are muted for both scores, consistent with the findings from the previous section. No statistically significant difference between men and women is found in health occupations (Table A1 shows high score values across all distributional statistics in these occupations). In the residual occupations subsample ("Other NOC" column), women have a lower physical proximity score than men by three points, while the opposite pattern is found in NOC 4 and NOC 6. These results suggest that the gender gap in physical proximity score is explained by the fact that high‐risk occupations are also highly feminized. The same interpretation can be applied to the regression results for the exposure to infections or diseases score, although no statistically significant gender difference is found in any of the three high‐risk occupational groupings.
Meanwhile, outside of the three high‐risk occupations, physical proximity is higher in male‐dominated occupations (one‐digit broad occupational categories), as shown when comparing the second column for the residual subsample (Other NOC, 2) with the first column for the residual subsample regression. Once controlling for occupations, the difference between men and women is approximately 0 and is not statistically significant. This may be explained by the higher share of men in the higher scoring occupations of the residual category such as trades, natural resources, agriculture, and manufacturing occupations. The opposite is true for exposure to infections or diseases: in the Other NOC subsample, the score for women is higher by five points, a statistically significant and substantial gap, given the intercept estimate of 12.1 (constant).
Second, the age gradient in physical proximity scores distinguishing younger workers (15–24 years) from others in aggregate results reported in Table 5 is not visible in health occupations (NOC 3) or occupations in education, law and social, community, and government services (NOC 4). On the other hand, older workers have a higher score than other age groups for frequency of exposure to diseases or infections by four to five points, suggesting that older workers in health occupations, including the approximately 260,000 workers aged 55 or more (20 percent of workers in health occupations), are at higher risk of exposure to the COVID‐19 based on that measure. The age difference is only statistically significant when comparing older workers (65 years or more) to the youngest age group (15‐ to 24‐year‐old workers). Older workers also score higher in NOC 4 and NOC 6 although the differences with 15‐ to 24‐year‐old workers are generally not statistically significant. In the Other NOC subsample, prime‐age workers (25–54 years) score the lowest, with a statistically significant difference with 15‐ to 24‐year‐old workers of more than two points.
Third, workers with any type of university degree have a lower occupational risk of exposure compared to less educated workers across both measures and all occupational groupings, except for health occupations and, in the case of physical proximity scores, for sales and services occupations. Following a social closure and social constructionist approach (Attewell 1990; Collins 1979; Grusky and Weeden 2001) may help understanding how health occupations requiring a higher level of education are associated with a high frequency of exposure to diseases or infections and high level of physical proximity while the opposite is true outside for other occupations. Proximity with patients with poor health such as the one required for surgeons or other medical specialties is central to the occupational identity of health care professionals and to boundary definitions and closure among health care professionals. Meanwhile, exposure to diseases or infections may simply represent an occupational health and safety risk in other occupations, which high‐status (more highly educated) occupational incumbents are able to avoid.
Lastly, separate results by occupational groupings do not show any statistically significant difference between immigrants and Canadian‐born workers, with the exception of exposure to infections or diseases in the Other NOC subsample, where immigrants are found to have a lower score than Canada‐born workers.11
LOW‐INCOME OCCUPATIONS
The last set of findings reported in this paper focus on workers in low‐income occupations. Low‐income workers may be at greater risk of infection to COVID‐19 and subsequent complications than other workers because they are likely to face strong financial disincentives to be absent from work (low savings and precarious financial situation) even if they contract the virus or if they are in a group at higher risks of mortality following an infection to COVID‐19 (older individuals, those with chronic health conditions or respiratory diseases, etc.). This is especially true in cases where they do not have access to paid sick leaves (the data do not include any measure of access to sick leaves however, and provinces such as Ontario do not mandate paid sick leaves; self‐employed workers such as those employed in the gig economy also lack employer‐sponsored paid sick leaves) or other forms of income support in cases of absence from work for health‐related reasons.
In the absence of public‐use individual‐level employment income microdata with detailed measures of occupations, median occupational employment income is used as a proxy for being in a low‐income job. Table 7 reports the distribution of workers in low‐income and non‐low‐income occupations in the overall quartile distribution for the three different risk scores. Low‐income occupations are occupations with median annual employment income below 50 percent of the Canadian median annual employment income value ($37,231 among all those who were employed at any time in 2015). In other words, workers in an occupation with a median annual employment income value below $18,615.50 are classified as working in a low‐income occupation. No adjustment is made for annual work hours because part‐time or part‐year employment status is an aspect of economic precarity (this paper is not focusing on the labor market returns to specific skills and for that reason, differences in hourly wages are less important than differences in annual earnings).
Table 7.
Score Quartile Distribution by Low‐Income Occupation Status
| Total | Men | Women | ||||||||||
|---|---|---|---|---|---|---|---|---|---|---|---|---|
| Not a Low‐Income Occupation | Low‐Income Occupation | Not a Low‐Income Occupation | Low‐Income Occupation | Not a Low‐Income Occupation | Low‐Income Occupation | |||||||
| Percentage | Frequency | Percentage | Frequency | Percentage | Frequency | Percentage | Frequency | Percentage | Frequency | Percentage | Frequency | |
| Physical Proximity | Physical Proximity | Physical Proximity | ||||||||||
| 1st quartile | 28.3 | 4,705,120 | 2.9 | 50,795 | 27.6 |
2,4 44,340 |
3.2 | 19,430 | 29.0 | 2,260,785 | 2.8 | 31,375 |
| 2nd quartile | 28.6 | 4,768,090 | 0.8 | 13,030 | 33.3 | 2,946,760 | 1.1 | 6,650 | 23.4 | 1,821,250 | 0.6 | 6,375 |
| 3rd quartile | 20.8 | 3,462,160 | 46.1 | 797,810 | 22.0 | 1,950,900 | 59.6 | 360,700 | 19.4 | 1,511,250 | 38.8 | 437,110 |
| 4th quartile | 22.3 | 3,714,385 | 50.2 |
8 69,200 |
17.1 | 1,516,575 | 36.1 | 218,705 | 28.2 | 2,197,805 | 57.8 | 650,490 |
| Total | 100.0 | 16,649,755 | 100.0 | 1,730,835 | 100.0 | 8,858,575 | 100.0 | 605,485 | 100.0 | 7,791,090 | 100.0 | 1,125,350 |
| Exposure to Infections or Diseases | Exposure to Infections or Diseases | Exposure to Infections or Diseases | ||||||||||
| 1st quartile | 27.6 | 4,592,765 | 5.7 | 98,685 | 32.4 | 2,870,785 | 7.8 | 46,995 | 22.1 | 1,721,920 | 4.6 | 51,690 |
| 2nd quartile | 24.6 | 4,090,915 | 24.1 | 417,960 | 31.6 | 2,800,560 | 26.2 | 158,670 | 16.6 | 1,290,335 | 23.0 | 259,300 |
| 3rd quartile | 23.8 | 3,957,260 | 53.5 | 925,495 | 22.0 | 1,953,250 | 51.5 | 311,560 | 25.7 | 2,004,010 | 54.6 | 613,930 |
| 4th quartile | 24.1 | 4,008,815 | 16.7 | 288,695 | 13.9 | 1,233,980 | 14.6 | 88,260 | 35.6 | 2,774,825 | 17.8 | 200,430 |
| Total | 100.0 | 16,649,755 | 100.0 | 1,730,835 | 100.0 | 88,58,575 | 100.0 | 605,485 | 100.0 | 7,791,090 | 100.0 | 1,125,350 |
| Composite Risk Score | Composite Risk Score | Composite Risk Score | ||||||||||
| 1st quartile | 27.9 | 4,646,000 | 2.9 | 50,105 | 31.4 | 2,784,825 | 3.1 | 18,815 | 23.9 | 1,861,185 | 2.8 | 31,305 |
| 2nd quartile | 27.0 | 4,492,465 | 1.2 | 20,610 | 28.3 | 2,508,175 | 1.7 | 10,355 | 25.5 | 1,984,190 | 0.9 | 10,250 |
| 3rd quartile | 22.4 | 3,732,650 | 45.7 | 790,920 | 24.6 | 2,177,660 | 59.1 | 357,610 | 20.0 | 1,555,005 | 38.5 | 433,305 |
| 4th quartile | 22.7 | 3,778,640 | 50.2 | 869,200 | 15.7 | 1,387,915 | 36.1 | 218,705 | 30.7 | 2,390,710 | 57.8 | 650,490 |
| Total | 100.0 | 16,649,755 | 100.0 | 1,730,835 | 100.0 | 8,858,575 | 100.0 | 605,485 | 100.0 | 7,791,090 | 100.0 | 1,125,350 |
Source: Census of Population (2016) and O*Net.
The results in Table 7 show that 1,730,835 Canadian workers in the sample are in a low‐income occupation, or 10.4 percent of all sample observations. A much higher share of workers in low‐wage occupations work in occupations at the top of the physical proximity score distribution. More specifically, more than 95 percent of low‐income workers are in jobs in the top half of the physical proximity score distribution. Meanwhile, only 43.1 percent of workers who are not in a low‐income occupation are in the top half of that distribution. A similar pattern is found for the exposure to infections or diseases score, although in a more muted way, possibly because higher paying health occupations are overrepresented in the top half of the distribution. The composite score results show that 29.9 percent of all low‐income workers are in the bottom half of the distribution, while a little more than 50 percent of workers not in a low‐income occupation are in the bottom half of the distribution.
Estimates are also reported separately for men and women in Table 7. The higher overall occupational exposure risk scores for women reported in previous sections translate in a greater share of women in the highest quartile both inside and outside of low‐income occupations. Strikingly, 57.8 percent of women in low‐income occupations are in the top quartile of the physical proximity score distribution. Results in Tables A7 to A9 show a higher share of workers in low‐income occupations in the fourth quartile of the physical proximity score distribution among immigrant than Canadian‐born workers and among members of visible minority groups than workers who are not. For First Nations people and Métis, a higher concentration of workers in the fourth quartile of the exposure to infections or diseases score distribution is found among workers who are not in low‐income occupations than non‐Aboriginals. The same pattern is found when comparing Inuit and non‐Aboriginal workers in low‐income occupations. Otherwise little difference is found between non‐Aboriginal and Aboriginal people working in low‐income occupations.
These results highlight the association between socioeconomic status and occupational‐level work activities that may increase the risk of exposure to COVID‐19, and more so among women, immigrants, and members of visible minority groups. This matters in terms of baseline risk of exposure, but also highlights the importance of preventive measures against contraction and transmission in the workplace, such as ensuring that workers who suspect they may have been infected or who tested positive do not face disincentives to stay at home in isolation.
DISCUSSION
While this study considers occupational risks of exposure to COVID‐19 using measures of job tasks and activities at the detailed level, it faces some limitations. Importantly, employers have reacted in at least two ways to the pandemic, in line with public health guidelines and directives as well as with the impact of the pandemic on the economy. First, a large number of establishments have ceased their activities, as a result of a decrease in demand and of the subsequent establishment closures mandated by provincial governments across the country. As a consequence, workers in a large number of occupations are absent from work or on layoff or furlough (Statistics Canada 2020b). Therefore, the 2016 data used for this study do not account for the recent developments in that area since the beginning of the pandemic, which may compound the impact of differences over time in the composition of the workforce on the estimates presented in this study. Further analysis with data from the Labor Force Survey could allow the estimation of the impact of mandated establishment closures and various forms of cessation of activities on the aggregate distribution of occupational risk of exposure as well as on group differences.
Despite this limitation, the results presented in this note have important longer term implications. As emergency measures mandating establishment closures in specific sectors are progressively lifted without a complete eradication of COVID‐19 in the population, this note shows which workers are likely to face higher risks of exposure when (or if) returning to work. These segments of the workforce may especially benefit from enhanced preventive, protective, and adaptative measures by governments and employers in that context. The ability to identify the high‐risk occupations is therefore important to determine what type of workplaces may require greater monitoring, efforts at physical distancing and other measures during all phases of a pandemic.
Second, a large number of employers have implemented policies allowing employees to work from home, and survey evidence shows that 3.3 million employed Canadians who usually work outside of their home completed most of their work hours from home during the week of April 12, 2020 (Statistics Canada 2020b). The relationship between physical proximity requirements (as measured by O*Net) and the ability to work from home is not straightforward because existing technology allows online face‐to‐face discussion through teleconferencing software as well as a broad range of other forms of live communication and interactions. Nevertheless, a few approaches have been used to measure the feasibility of remote work across occupations (Dingel and Neiman 2020; Gascon 2020), which may allow future research to estimate the impact of an unevenly distributed shift to remote work on disparities in occupational risks of exposure to COVID‐19. Note that the redesign of occupational task content in reaction to the COVID‐19 pandemic cannot be fully accounted for using a static database such as O*Net, and more timely data on transition to remote work may be necessary.
Finally, addressing the impact of these recent labor market trends on occupational task content and on the distribution of those tasks will be instrumental in achieving a more accurate understanding of the risk of occupational exposure to COVID‐19 in the workplace across different segments of the labor force. Nevertheless, the job design and task allocation of employees who perform similar work can vary substantially across organizations (Appelbaum et al. 2000; Cohen 2013). In fact, variation in the ability of different organizations to adapt, transform, and reassemble jobs may be observable across dimensions other than occupations. While the ability to redesign jobs towards remote work may depend on certain occupational characteristics, studies of the impact of organizational reactions to the COVID‐19 pandemic (job reassembly/redesign) on the exposure risk of workers may gain to take into account these other sources of variation.
CONCLUSION
In this paper, I use data on occupational work activities from the O*Net combined with Canadian 2016 Census data to show that approximately 45 percent of Canadian workers are in occupations that require performing duties in relatively close physical proximity to others (at arm's length or closer). A smaller share of workers is in occupations with a regular frequency of exposure to diseases or infections (around 8 percent of them are in occupations with exposure once a week or more). These measures are used as indicators of the risk of exposure to COVID‐19 in the workplace for Canadians working in various occupations. The methods and findings can also be relevant for studies of occupational risks of exposure to other infectious diseases similar to COVID‐19 that may be transmitted when individuals are in close physical proximity.
I find important disparities by sociodemographic characteristics, notably by gender, age, education, and broad occupational category. In addition, workers in low‐income occupations are found to be especially vulnerable to COVID‐19 exposure and transmission. These results contribute to identify which workers are at higher risk of exposure to COVID‐19 in the workplace and help policy‐makers formulate decisions about the design of specific public health and occupational health and safety interventions, the closure of certain establishments, and the creation of related income‐support measures in reaction to the current pandemic. Following Bignami‐van Assche et al. (2020), this study highlights the importance of focusing on age differences when considering government interventions focusing on essential workers and confinement.
The evidence showing lower risks of exposure among university‐educated workers compared to less educated workers in most nonhealth occupations (as well as college, CEGEP, and other nonuniversity postsecondary‐educated workers in some broad occupational groupings) also has the potential to contribute to the literature on the education‐health gradient (Zajacova and Lawrence 2018). At the same time, the absence of an education risk of exposure gradient among the (higher paid) health occupations point at the existence of “pockets of complexity” in this relationship (Schieman and Koltai 2017). The initial findings reported in this research note can be leveraged in future studies on the relationship between different measures of socioeconomic status and health focusing specifically on COVID‐19 or other similar infectious diseases.
Finally, this paper offers a more general insight into the relationship between occupational tasks and labor market stratification. Recent research has predominantly focused on abstract (cognitive, routine, social, etc.) and on manual or physical aspects of occupational activities and tasks in terms of the earnings associated with those skills. In contrast, this paper highlights how components of the physical aspect of work activities have an important impact on risks in the workplace and on job quality that are distinct from the labor market rewards for different skills and abilities.
Figure A1.
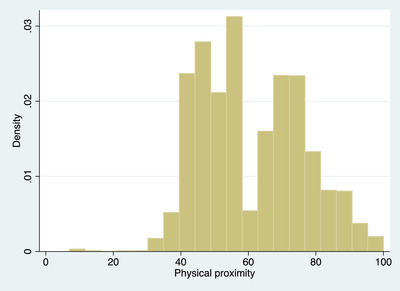
Weighted Distribution of Physical Proximity Occupational Scores [Color figure can be viewed at wileyonlinelibrary.com]
Figure A2.
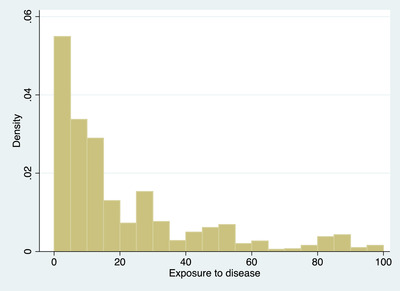
Weighted Distribution of Exposure to Diseases or Infections Occupational Scores [Color figure can be viewed at wileyonlinelibrary.com]
Table A1.
Distributional Statistics in Health Occupations, Occupational Risk Scores
| Physical Proximity | Exposure to Infections or Diseases | Composite Score | Population Estimates | ||||
|---|---|---|---|---|---|---|---|
| Mean | Median | Mean | Median | Mean | Median | N | |
| Total | 86.5 | 87.8 | 82.2 | 86.3 | 84.7 | 85.2 | 1,246,510 |
| Men | 86.9 | 87.8 | 82.7 | 86.3 | 85.2 | 85.2 | 235,105 |
| Women | 86.4 | 87.8 | 82.1 | 82.5 | 84.5 | 85.2 | 1,011,405 |
| Canada‐born | 86.6 | 87.8 | 81.9 | 86.3 | 84.6 | 85.2 | 917,295 |
| Immigrant | 86.1 | 87.8 | 83.1 | 82.5 | 84.8 | 85.0 | 329,215 |
| Not a member of a visible minority group | 86.6 | 87.8 | 82.0 | 86.3 | 84.7 | 85.2 | 950,330 |
| Member of a visible minority group | 85.9 | 87.8 | 82.9 | 82.2 | 84.7 | 85.0 | 305,895 |
| Non‐Aboriginal identity | 86.4 | 87.8 | 82.2 | 86.3 | 84.7 | 85.2 | 1,216,790 |
| First Nations people | 87.2 | 87.8 | 82.4 | 82.2 | 85.1 | 85.0 | 17,755 |
| Métis | 87.1 | 87.8 | 82.1 | 82.2 | 85.0 | 85.0 | 19,450 |
| Inuit | 88.6 | 87.8 | 83.8 | 82.2 | 86.3 | 85.0 | 745 |
| 15–24 years old | 86.3 | 87.8 | 79.6 | 82.2 | 83.3 | 85.0 | 88,305 |
| 25–54 years old | 86.6 | 87.8 | 82.1 | 86.3 | 84.7 | 85.2 | 898,290 |
| 55–64 years old | 86.1 | 87.8 | 83.2 | 86.3 | 84.9 | 85.2 | 208,940 |
| 65 or more years old | 86.4 | 87.8 | 84.4 | 86.3 | 85.7 | 86.3 | 50,975 |
| No certificate, diploma, or degree | 86.6 | 87.8 | 81.6 | 82.2 | 84.2 | 85.0 | 17,630 |
| Secondary (high) school diploma or equivalency certificate | 85.6 | 87.8 | 78.6 | 82.2 | 82.4 | 85.0 | 87,770 |
| Apprenticeship or trades certificate or diploma | 87.7 | 87.8 | 81.1 | 82.2 | 84.7 | 85.0 | 103,065 |
| College, CEGEP, or other nonuniversity certificate or diploma | 87.0 | 87.8 | 82.4 | 87.5 | 85.1 | 86.5 | 460,705 |
| University certificate or diploma below bachelor level | 86.8 | 85.5 | 83.6 | 87.5 | 85.5 | 86.5 | 54,885 |
| University certificate, diploma, or degree at bachelor level or above | 85.9 | 85.5 | 82.7 | 87.5 | 84.6 | 86.5 | 522,455 |
| 301 Professional occupations in nursing | 85.0 | 85.5 | 86.9 | 87.5 | 86.0 | 86.5 | 316,370 |
| 311 Physicians, dentists, and veterinarians | 89.9 | 91.0 | 93.7 | 95.0 | 91.8 | 95.6 | 120,695 |
| 312 Optometrists, chiropractors, and other health diagnosing and treating professionals | 93.2 | 94.0 | 70.1 | 73.0 | 82.8 | 84.2 | 25,365 |
| 313 Pharmacists, dietitians, and nutritionists | 71.3 | 72.0 | 76.7 | 76.0 | 74.1 | 74.0 | 48,960 |
| 314 Therapy and assessment professionals | 89.7 | 90.5 | 62.9 | 63.5 | 77.5 | 78.2 | 61,480 |
| 321 Medical technologists and technicians (except dental health) | 79.7 | 79.5 | 76.4 | 79.3 | 78.5 | 76.7 | 150,930 |
| 322 Technical occupations in dental health care | 92.3 | 100.0 | 95.1 | 100.0 | 93.8 | 100.0 | 34,570 |
| 323 Other technical occupations in health care | 90.4 | 90.0 | 76.1 | 89.0 | 84.6 | 92.0 | 161,890 |
| 341 Assisting occupations in support of health services | 88.4 | 87.8 | 83.1 | 82.2 | 85.8 | 85.0 | 326,250 |
Source: Census of Population (2016) and O*Net.
Table A2.
Distributional Statistics in Occupations in Education, Law and Social, Community, and Government Services, Occupational Risk Scores
| Physical Proximity | Exposure to Infections or Diseases | Composite Score | Population Estimates | ||||
|---|---|---|---|---|---|---|---|
| Mean | Median | Mean | Median | Mean | Median | N | |
| Total | 65.9 | 70.0 | 33.7 | 36.0 | 53.2 | 55.4 | 2,078,245 |
| Men | 60.7 | 56.0 | 29.2 | 17.0 | 48.8 | 48.1 | 626,495 |
| Women | 68.1 | 75.0 | 35.7 | 40.0 | 55.1 | 60.1 | 1,451,750 |
| Canada‐born | 66.1 | 70.0 | 34.1 | 36.0 | 53.4 | 55.4 | 1,654,005 |
| Immigrant | 65.1 | 70.0 | 32.3 | 36.0 | 52.3 | 54.8 | 424,240 |
| Not a member of a visible minority group | 65.9 | 70.0 | 33.8 | 36.0 | 53.2 | 55.4 | 1,739,495 |
| Member of a visible minority group | 65.4 | 70.0 | 32.6 | 36.0 | 52.7 | 55.4 | 375,975 |
| Non‐Aboriginal identity | 65.7 | 70.0 | 33.4 | 36.0 | 53.0 | 55.4 | 2,018,220 |
| First Nations people | 68.2 | 75.0 | 38.7 | 36.0 | 56.1 | 57.7 | 54,825 |
| Métis | 68.4 | 75.0 | 38.2 | 36.0 | 56.2 | 60.1 | 35,755 |
| Inuit | 70.1 | 76.0 | 38.8 | 40.0 | 57.3 | 64.6 | 4,510 |
| 15–24 years old | 66.9 | 75.0 | 31.6 | 36.0 | 53.5 | 55.4 | 146,025 |
| 25–54 years old | 66.2 | 70.0 | 34.4 | 36.0 | 53.6 | 57.7 | 1,489,765 |
| 55–64 years old | 65.2 | 70.0 | 32.9 | 36.0 | 52.4 | 51.9 | 334,395 |
| 65 or more years old | 62.2 | 56.0 | 30.3 | 33.3 | 49.7 | 48.1 | 108,060 |
| No certificate, diploma, or degree | 76.2 | 76.0 | 44.8 | 40.0 | 63.0 | 65.1 | 55,140 |
| Secondary (high) school diploma or equivalency certificate | 70.6 | 75.0 | 38.5 | 40.0 | 57.8 | 64.6 | 226,155 |
| Apprenticeship or trades certificate or diploma | 72.9 | 76.0 | 43.1 | 52.0 | 60.6 | 65.1 | 71,750 |
| College, CEGEP, or other nonuniversity certificate or diploma | 70.3 | 76.0 | 40.9 | 41.5 | 58.3 | 65.1 | 439,660 |
| University certificate or diploma below bachelor level | 67.6 | 75.0 | 36.5 | 36.0 | 55.2 | 60.1 | 72,955 |
| University certificate, diploma, or degree at bachelor level or above | 62.4 | 64.0 | 29.0 | 33.3 | 49.5 | 50.9 | 1,212,585 |
| 401 University professors and postsecondary assistants | 51.1 | 48.2 | 8.5 | 13.9 | 36.9 | 35.5 | 136,945 |
| 402 College and other vocational instructors | 49.0 | 49.0 | 14.0 | 14.0 | 36.0 | 36.0 | 94,830 |
| 403 Secondary and elementary school teachers and educational counselors | 75.2 | 79.0 | 35.5 | 46.0 | 59.3 | 64.6 | 486,215 |
| 411 Judges, lawyers, and Quebec notaries | 34.6 | 34.0 | 14.7 | 14.0 | 26.6 | 26.0 | 92,150 |
| 415 Social and community service professionals | 57.9 | 57.0 | 43.7 | 40.0 | 51.5 | 51.9 | 158,100 |
| 416 Policy and program researchers, consultants, and officers | 47.2 | 47.0 | 11.5 | 4.3 | 35.3 | 33.2 | 231,360 |
| 421 Paraprofessional occupations in legal, social, community, and education services | 67.1 | 76.0 | 39.0 | 46.5 | 55.5 | 65.1 | 426,720 |
| 431 Occupations in front‐line public protection services | 76.9 | 75.0 | 59.4 | 59.0 | 68.8 | 67.5 | 112,275 |
| 441 Home care providers and educational support occupations | 84.1 | 86.0 | 45.5 | 40.0 | 67.9 | 67.2 | 302,215 |
| 442 Legal and public protection support occupations | 73.3 | 81.0 | 62.4 | 72.0 | 68.1 | 76.6 | 37,435 |
Source: Census of Population (2016) and O*Net.
Table A3.
Distributional Statistics in Sales and Services Occupations, Occupational Risk Scores
| Physical Proximity | Exposure to Infections or diseases | Composite Score | Population Estimates | ||||
|---|---|---|---|---|---|---|---|
| Mean | Median | Mean | Median | Mean | Median | N | |
| Total | 66.5 | 68.5 | 19.9 | 14.5 | 50.4 | 49.5 | 4,304,595 |
| Men | 64.6 | 68.5 | 19.9 | 14.5 | 49.3 | 49.5 | 1,836,580 |
| Women | 67.9 | 69.0 | 19.9 | 14.5 | 51.3 | 49.7 | 2,468,015 |
| Canada‐born | 66.8 | 68.5 | 19.5 | 14.5 | 50.5 | 49.5 | 3,245,935 |
| Immigrant | 65.7 | 68.5 | 21.1 | 14.5 | 50.4 | 49.5 | 1,058,660 |
| Not a member of a visible minority group | 66.4 | 68.5 | 19.9 | 14.5 | 50.4 | 49.5 | 3,270,065 |
| Member of a visible minority group | 66.7 | 68.5 | 20.0 | 14.5 | 50.7 | 49.7 | 1,106,220 |
| Non‐Aboriginal identity | 66.5 | 68.5 | 19.8 | 14.5 | 50.4 | 49.5 | 4,181,580 |
| First Nations people | 66.0 | 69.0 | 23.7 | 16.0 | 51.3 | 49.7 | 103,320 |
| Métis | 67.0 | 69.0 | 21.1 | 15.0 | 51.1 | 49.7 | 78,290 |
| Inuit | 64.0 | 69.0 | 27.8 | 28.0 | 51.2 | 49.7 | 7,875 |
| 15–24 years old | 70.1 | 72.0 | 18.3 | 14.5 | 52.1 | 51.3 | 1,315,820 |
| 25–54 years old | 65.5 | 68.5 | 20.0 | 14.5 | 49.9 | 49.5 | 2,126,505 |
| 55–64 years old | 63.1 | 68.5 | 22.5 | 14.5 | 49.2 | 49.5 | 646,260 |
| 65 or more years old | 64.0 | 68.5 | 21.3 | 14.5 | 49.4 | 49.5 | 216,010 |
| No certificate, diploma, or degree | 66.1 | 69.0 | 23.3 | 16.0 | 51.3 | 49.7 | 767,710 |
| Secondary (high) school diploma or equivalency certificate | 66.6 | 68.5 | 19.7 | 14.5 | 50.5 | 49.5 | 1,667,490 |
| Apprenticeship or trades certificate or diploma | 69.6 | 70.0 | 24.4 | 24.5 | 53.6 | 50.3 | 395,060 |
| College, CEGEP, or other nonuniversity certificate or diploma | 66.3 | 68.5 | 18.5 | 14.5 | 49.9 | 49.5 | 814,615 |
| University certificate or diploma below bachelor level | 65.8 | 68.5 | 17.9 | 14.5 | 49.4 | 49.5 | 102,245 |
| University certificate, diploma, or degree at bachelor level or above | 64.8 | 68.5 | 15.2 | 13.3 | 48.0 | 49.5 | 557,475 |
| 621 Retail sales supervisors | 66.0 | 66.0 | 10.0 | 10.0 | 47.2 | 47.2 | 64,295 |
| 622 Technical sales specialists in wholesale trade and retail and wholesale buyers | 50.2 | 46.5 | 7.3 | 6.0 | 35.9 | 33.2 | 113,525 |
| 623 Insurance, real estate, and financial sales occupations | 61.0 | 61.0 | 6.8 | 7.0 | 43.5 | 43.7 | 220,515 |
| 631 Service supervisors | 82.6 | 87.0 | 29.3 | 26.0 | 62.8 | 64.8 | 87,385 |
| 632 Chefs and cooks | 72.3 | 70.0 | 37.2 | 43.0 | 58.1 | 58.1 | 284,200 |
| 633 Butchers and bakers | 61.8 | 55.0 | 5.8 | 7.0 | 44.0 | 39.2 | 62,675 |
| 634 Specialized occupations in personal and customer services | 84.5 | 92.0 | 28.6 | 32.0 | 63.7 | 68.9 | 131,700 |
| 641 Sales and account representatives—wholesale trade (nontechnical) | 52.0 | 52.0 | 3.0 | 3.0 | 36.8 | 36.8 | 110,810 |
| 642 Retail salespersons | 68.5 | 68.5 | 14.5 | 14.5 | 49.5 | 49.5 | 694,250 |
| 651 Occupations in food and beverage service | 78.2 | 78.0 | 14.4 | 16.0 | 56.3 | 56.3 | 306,140 |
| 652 Occupations in travel and accommodation | 70.9 | 64.0 | 18.7 | 3.0 | 54.1 | 45.3 | 79,520 |
| 653 Tourism and amusement services occupations | 75.8 | 78.8 | 27.7 | 28.0 | 57.2 | 59.1 | 24,040 |
| 654 Security guards and related security service occupations | 63.8 | 63.8 | 15.3 | 15.3 | 46.3 | 46.3 | 122,605 |
| 655 Customer and information services representatives | 58.0 | 58.0 | 5.0 | 5.0 | 41.2 | 41.2 | 295,955 |
| 656 Other occupations in personal service | 83.9 | 91.8 | 29.7 | 25.5 | 63.4 | 67.3 | 84,780 |
| 661 Cashiers | 75.0 | 75.0 | 28.0 | 28.0 | 56.6 | 56.6 | 357,680 |
| 662 Other sales support and related occupations | 68.1 | 69.0 | 10.8 | 13.3 | 48.8 | 49.7 | 249,270 |
| 671 Food counter attendants, kitchen helpers, and related support occupations | 72.3 | 72.3 | 5.7 | 5.7 | 51.3 | 51.3 | 394,320 |
| 672 Support occupations in accommodation, travel, and amusement services | 79.0 | 78.0 | 29.3 | 31.0 | 59.7 | 59.4 | 43,525 |
| 673 Cleaners | 45.7 | 48.0 | 46.8 | 47.0 | 46.8 | 47.3 | 525,290 |
| 674 Other service support and related occupations, n.e.c. | 65.6 | 74.5 | 37.2 | 24.5 | 54.9 | 55.5 | 52,115 |
Source: Census of Population (2016) and O*Net. n.e.c. = not elsewhere classified.
Table A4.
Distributional Statistics in Lower Risk Occupations, Occupational Risk Scores
| Physical Proximity | Exposure to Infections or Diseases | Composite Score | Population Estimates | ||||
|---|---|---|---|---|---|---|---|
| Mean | Median | Mean | Median | Mean | Median | N | |
| Total | 55.0 | 52.0 | 11.4 | 6.5 | 40.5 | 38.2 | 10,518,020 |
| Men | 56.4 | 55.0 | 9.7 | 5.3 | 41.1 | 39.2 | 6,637,100 |
| Women | 52.6 | 49.0 | 14.2 | 8.0 | 39.5 | 36.7 | 3,880,920 |
| Canada‐born | 55.2 | 53.0 | 11.8 | 7.0 | 40.8 | 38.2 | 8,065,230 |
| Immigrant | 54.4 | 52.0 | 9.8 | 5.0 | 39.8 | 37.3 | 2,452,790 |
| Not a member of a visible minority group | 55.1 | 53.0 | 11.7 | 7.0 | 40.7 | 38.2 | 8,592,550 |
| Member of a visible minority group | 54.4 | 52.0 | 9.7 | 5.0 | 39.8 | 37.5 | 2,040,110 |
| Non‐Aboriginal identity | 54.9 | 52.0 | 11.3 | 6.5 | 40.5 | 38.2 | 10,246,105 |
| First Nations people | 56.8 | 55.0 | 13.7 | 8.3 | 42.3 | 40.2 | 190,625 |
| Métis | 56.7 | 55.0 | 12.6 | 7.1 | 41.9 | 40.1 | 171,600 |
| Inuit | 55.1 | 54.0 | 16.8 | 10.0 | 42.3 | 40.1 | 13,830 |
| 15–24 years old | 59.2 | 57.7 | 13.7 | 9.0 | 43.9 | 42.8 | 1,016,625 |
| 25–54 years old | 54.6 | 52.0 | 10.7 | 5.3 | 40.1 | 37.6 | 6,921,870 |
| 55–64 years old | 54.5 | 52.0 | 11.9 | 7.0 | 40.3 | 37.6 | 2,006,975 |
| 65 or more years old | 54.4 | 52.0 | 12.8 | 7.0 | 40.4 | 37.6 | 572,550 |
| No certificate, diploma, or degree | 57.9 | 55.3 | 11.3 | 7.0 | 42.5 | 40.5 | 1,101,585 |
| Secondary (high) school diploma or equivalency certificate | 56.7 | 55.0 | 12.5 | 7.0 | 41.9 | 40.1 | 2,747,730 |
| Apprenticeship or trades certificate or diploma | 58.6 | 57.0 | 11.8 | 7.0 | 43.2 | 40.5 | 1,365,340 |
| College, CEGEP, or other nonuniversity certificate or diploma | 54.4 | 52.0 | 12.2 | 7.0 | 40.3 | 37.6 | 2,344,045 |
| University certificate or diploma below bachelor level | 53.0 | 49.0 | 11.2 | 5.3 | 39.1 | 36.7 | 301,345 |
| University certificate, diploma, or degree at bachelor level or above | 51.0 | 48.0 | 9.2 | 4.5 | 37.3 | 35.0 | 2,657,975 |
Note: Results reported in this table are for lower risk occupations, which include all occupations except those in the following one‐digit broad occupational categories: health occupations, occupations in education, law and social, community, and government services, and sales and service occupations.
Source: Census of Population (2016) and O*Net.
Table A5.
Regression of Risk Scores on Labor Force Characteristics, Visible Minority Data Set
| Physical Proximity | Exposure to Infections or Diseases | Composite Risk Score | ||||
|---|---|---|---|---|---|---|
| 1 | 2 | 3 | 4 | 5 | 6 | |
| Men | (Reference) | (Reference) | (Reference) | (Reference) | (Reference) | (Reference) |
| Women | 4.5*** | 1.7** | 11.9*** | 2.8*** | 6.3*** | 1.7*** |
| Not a member of a visible minority group | (Reference) | (Reference) | (Reference) | (Reference) | (Reference) | (Reference) |
| Member of a visible minority group | 1.1 | 0.6 | −0.1 | 0.1 | 0.9 | 0.4 |
| 15–24 years old | (Reference) | (Reference) | (Reference) | (Reference) | (Reference) | (Reference) |
| 25–64 years old | −5.6*** | −3.4*** | 0.5 | 0.9 | −3.2*** | −1.7*** |
| 65+ years old | −6.4*** | −4.1*** | 1.6 | 1.5 | −3.5*** | −2.1*** |
| No certificate, diploma, or degree | (Reference) | (Reference) | (Reference) | (Reference) | (Reference) | (Reference) |
| Secondary (high) school diploma or equivalency certificate | −0.9 | 0.4 | −1.0 | −1.4 | −1.0 | −0.2 |
| Apprenticeship or trades certificate or diploma | 2.5 | 1.9 | 2.6 | −0.6 | 2.5 | 1.0 |
| College, CEGEP, or other nonuniversity certificate or diploma | 0.4 | 0.3 | 4.8* | −1.8 | 1.8 | −0.4 |
| University certificate or diploma below bachelor level | −0.9 | −0.5 | 3.5 | −2.9* | 0.5 | −1.1 |
| University certificate, diploma, or degree at bachelor level or above | −2.6 | −2.7* | 2.9 | −5.6*** | −0.9 | −3.4*** |
| 0 Management | −11.8*** | −8.8*** | −10.7*** | |||
| 1 Business, finance, and administration | −15.6*** | −4.8*** | −11.7*** | |||
| 2 Natural and applied sciences and related occupations | −12.6*** | −10.9*** | −11.4*** | |||
| 3 Health occupations | 21.2*** | 62.9*** | 35.2*** | |||
| 4 Education, law and social, community, and government services | 1.4 | 15.3*** | 4.4** | |||
| 5 Art, culture, recreation, and sport | −4.5*** | −5.1*** | −4.5*** | |||
| 6 Sales and service | (Reference) | (Reference) | (Reference) | |||
| 7 Trades, transport, and equipment operators and related occupations | −5.0*** | −6.4*** | −5.0*** | |||
| 8 Natural resources, agriculture, and related production occupations | −5.7** | −7.1*** | −6.1*** | |||
| 9 Manufacturing and utilities | −5.9*** | −15.7*** | −7.4*** | |||
| Constant | 64.2*** | 67.7*** | 12.5*** | 19.4*** | 46.7*** | 51.1*** |
| R 2 | 0.05 | 0.40 | 0.08 | 0.63 | 0.06 | 0.61 |
* p < .10; ** p < .05; *** p < .01
Note: Number of observations: n = 35,618; population estimates: N = 18,380,640.
Source: Census of Population (2016) and O* Net.
Table A6.
Regression of Risk Scores on Labor Force Characteristics, Aboriginal Identity Data Set
| Physical Proximity | Exposure to Infections or Diseases | Composite Risk Score | ||||
|---|---|---|---|---|---|---|
| 1 | 2 | 3 | 4 | 5 | 6 | |
| Men | (Reference) | (Reference) | (Reference) | (Reference) | (Reference) | (Reference) |
| Women | 4.5*** | 1.7* | 11.9*** | 2.8** | 6.3*** | 1.7** |
| Non‐Aboriginal identity | (Reference) | (Reference) | (Reference) | (Reference) | (Reference) | (Reference) |
| First Nations people | 0.6 | −0.1 | 3.1** | 2.1** | 1.2 | 0.6 |
| Métis | 0.8 | 0.3 | 1.8 | 0.8 | 1.0 | 0.4 |
| Inuit | −1.2 | −1.4 | 5.5*** | 4.3*** | 0.7 | 0.4 |
| 15–24 years old | (Reference) | (Reference) | (Reference) | (Reference) | (Reference) | (Reference) |
| 25–64 years old | −5.6*** | −3.4*** | 0.5 | 0.9 | −3.2*** | −1.7*** |
| 65+ years old | −6.5*** | −4.2*** | 1.6 | 1.5 | −3.6*** | −2.1*** |
| No certificate, diploma, or degree | (Reference) | (Reference) | (Reference) | (Reference) | (Reference) | (Reference) |
| Secondary (high) school diploma or equivalency certificate | −0.8 | 0.4 | −0.9 | −1.3 | −0.9 | −0.2 |
| Apprenticeship or trades certificate or diploma | 2.5 | 1.9 | 2.7 | −0.6 | 2.4 | 1.0 |
| College, CEGEP, or other nonuniversity certificate or diploma | 0.4 | 0.3 | 4.9* | −1.7 | 1.8 | −0.3 |
| University certificate or diploma below bachelor level | −0.7 | −0.4 | 3.6 | −2.8 | 0.7 | −1.1 |
| University certificate, diploma, or degree at bachelor level or above | −2.5 | −2.6* | 3.1 | −5.5*** | −0.7 | −3.3*** |
| 0 Management | −11.8*** | −8.8*** | −10.7*** | |||
| 1 Business, finance, and administration | −15.7*** | −4.8** | −11.7*** | |||
| 2 Natural and applied sciences and related occupations | −12.7*** | −10.9*** | −11.4*** | |||
| 3 Health occupations | 21.2*** | 62.9*** | 35.2*** | |||
| 4 Education, law and social, community, and government services | 1.3 | 15.3*** | 4.3** | |||
| 5 Art, culture, recreation, and sport | −4.6** | −5.1** | −4.6*** | |||
| 6 Sales and service | (Reference) | (Reference) | (Reference) | |||
| 7 Trades, transport and equipment operators, and related occupations | −5.0*** | −6.4*** | −5.1*** | |||
| 8 Natural resources, agriculture, and related production occupations | −5.8** | −7.2*** | −6.2*** | |||
| 9 Manufacturing and utilities | −5.9*** | −15.7*** | −7.4*** | |||
| Constant | 64.3*** | 67.9*** | 12.3*** | 19.3*** | 46.8*** | 51.2*** |
| R 2 | 0.05 | 0.40 | 0.08 | 0.63 | 0.06 | 0.61 |
* p < .10; ** p < .05; *** p < .01
Note: Number of observations: n = 71,548; population estimates: N = 18,361,275.
Source: Census of Population (2016) and O*Net.
Table A7.
Score Quartile Distribution by Low‐Income Occupation Status and Immigration Background
| Canadian‐Born | Immigrant | |||||||
|---|---|---|---|---|---|---|---|---|
| Not a Low‐Income Occupation | Low‐Income Occupation | Not a Low‐Income Occupation | Low‐Income Occupation | |||||
| Percentage | Frequency | Percentage | Frequency | Percentage | Frequency | Percentage | Frequency | |
| Physical Proximity | Physical Proximity | |||||||
| 1st quartile | 27.6 | 3,463,120 | 2.8 | 37,100 | 30.4 | 1,182,345 | 3.4 | 12,595 |
| 2nd quartile | 28.6 | 3,598,380 | 0.9 | 11,695 | 28.5 | 1,108,475 | 0.3 | 1,180 |
| 3rd quartile | 21.0 | 2,641,930 | 47.1 | 621,900 | 20.1 | 782,740 | 43.3 | 160,900 |
| 4th quartile | 22.8 | 2,859,265 | 49.2 | 648,985 | 21.1 | 820,055 | 53.0 | 197,080 |
| Total | 100.0 | 12,562,695 | 100.0 | 1,319,680 | 100.0 | 3,893,615 | 100.0 | 371,755 |
| Exposure to infections or diseases | Exposure to infections or diseases | |||||||
| 1st quartile | 26.1 | 3,283,050 | 6.2 | 81,170 | 31.9 | 1,241,565 | 4.2 | 15,625 |
| 2nd quartile | 24.8 | 3,114,575 | 23.0 | 303,450 | 23.9 | 931,110 | 27.7 | 102,850 |
| 3rd quartile | 24.8 | 3,117,860 | 53.7 | 709,080 | 20.5 | 796,655 | 54.0 | 200,620 |
| 4th quartile | 24.3 | 3,047,210 | 17.1 | 225,980 | 23.7 | 924,285 | 14.2 | 52,660 |
| Total | 100.0 | 12,562,695 | 100.0 | 1,319,680 | 100.0 | 3,893,615 | 100.0 | 371,755 |
| Composite Risk Score | Composite Risk Score | |||||||
| 1st quartile | 27.2 | 3,415,025 | 2.8 | 36,455 | 30.0 | 1,169,175 | 3.4 | 12,550 |
| 2nd quartile | 27.1 | 3,410,020 | 1.4 | 17,885 | 26.4 | 1,028,175 | 0.6 | 2,385 |
| 3rd quartile | 22.9 | 2,872,815 | 46.7 | 616,355 | 21.1 | 821,420 | 43.0 | 159,740 |
| 4th quartile | 22.8 | 2,864,835 | 49.2 | 648,985 | 22.5 | 874,845 | 53.0 | 197,080 |
| Total | 100.0 | 12,562,695 | 100.0 | 1,319,680 | 100.0 | 3,893,615 | 100.0 | 371,755 |
Source: Census of Population (2016) and O*Net.
Table A8.
Score Quartile Distribution by Low‐Income Occupation Status and Visible Minority Status
| Not a Member of a Visible Minority Group | Member of a Visible Minority Group | |||||||
|---|---|---|---|---|---|---|---|---|
| Not a Low‐Income Occupation | Low‐Income Occupation | Not a Low‐Income Occupation | Low‐Income Occupation | |||||
| Percentage | Frequency | Percentage | Frequency | Percentage | Frequency | Percentage | Frequency | |
| Physical Proximity | Physical Proximity | |||||||
| 1st quartile | 27.9 | 3,703,725 | 3.0 | 38,485 | 29.6 | 1,001,425 | 2.7 | 12,315 |
| 2nd quartile | 28.9 | 3,836,865 | 0.9 | 11,670 | 27.6 | 931,220 | 0.3 | 1,355 |
| 3rd quartile | 20.6 | 2,735,675 | 46.7 | 599,210 | 21.5 | 726,465 | 44.3 | 198,610 |
| 4th quartile | 22.6 | 2,993,810 | 49.4 | 633,240 | 21.3 | 720,555 | 52.6 | 235,955 |
| Total | 100.0 | 13,270,075 | 100.0 | 1,282,605 | 100.0 | 3,379,665 | 100.0 | 448,235 |
| Exposure to Infections or Diseases | Exposure to Infections or Diseases | |||||||
| 1st quartile | 26.6 | 3,524,675 | 6.4 | 82,035 | 31.6 | 1,068,035 | 3.7 | 16,650 |
| 2nd quartile | 24.9 | 3,303,715 | 22.6 | 289,645 | 23.3 | 787,185 | 28.6 | 128,315 |
| 3rd quartile | 24.5 | 3,256,175 | 53.5 | 686,600 | 20.7 | 701,125 | 53.3 | 238,900 |
| 4th quartile | 24.0 | 3,185,510 | 17.5 | 224,325 | 24.4 | 823,320 | 14.4 | 64,370 |
| Total | 100.0 | 13,270,075 | 100.0 | 1,282,605 | 100.0 | 3,379,665 | 100.0 | 448,235 |
| Composite Risk Score | Composite Risk Score | |||||||
| 1st quartile | 27.7 | 3,679,355 | 2.9 | 37,800 | 28.6 | 966,660 | 2.7 | 12,315 |
| 2nd quartile | 27.2 | 3,603,915 | 1.4 | 17,960 | 26.3 | 888,550 | 0.6 | 2,645 |
| 3rd quartile | 22.6 | 2,998,970 | 46.3 | 593,605 | 21.7 | 733,655 | 44.0 | 197,320 |
| 4th quartile | 22.5 | 2,987,835 | 49.4 | 633,240 | 23.4 | 790,800 | 52.6 | 235,955 |
| Total | 100.0 | 13,270,075 | 100.0 | 1,282,605 | 100.0 | 3,379,665 | 100.0 | 448,235 |
Source: Census of Population (2016) and O*Net.
Table A9.
Score Quartile Distribution by Low‐Income Occupation Status and Aboriginal Identity
| Non‐Aboriginal Identity | First Nations People | |||||||
|---|---|---|---|---|---|---|---|---|
| Not a Low‐Income Occupation | Low‐Income Occupation | Not a Low‐Income Occupation | Low‐Income Occupation | |||||
| Percentage | Frequency | Percentage | Frequency | Percentage | Frequency | Percentage | Frequency | |
| Physical Proximity | Physical Proximity | |||||||
| 1st quartile | 28.4 | 4,548,335 | 2.9 | 48,225 | 24.8 | 79,350 | 3.1 | 1,395 |
| 2nd quartile | 28.7 | 4,598,220 | 0.7 | 11,545 | 26.8 | 85,775 | 1.5 | 705 |
| 3rd quartile | 20.7 | 3,319,870 | 46.2 | 758,945 | 22.7 | 72,620 | 45.7 | 20,885 |
| 4th quartile | 22.2 | 3,551,925 | 50.2 | 825,615 | 25.8 | 82,750 | 49.7 | 22,750 |
| Total | 100.0 | 16,018,350 | 100.0 | 1,644,330 | 100.0 | 320,495 | 100.0 | 45,735 |
| Exposure to Infections or Diseases | Exposure to Infections or Diseases | |||||||
| 1st quartile | 27.9 | 4,462,375 | 5.5 | 91,245 | 19.9 | 63,775 | 8.9 | 4,080 |
| 2nd quartile | 24.6 | 3,943,475 | 24.1 | 396,920 | 21.6 | 69,165 | 25.2 | 11,535 |
| 3rd quartile | 23.7 | 3,797,760 | 53.5 | 879,055 | 25.4 | 81,425 | 53.2 | 24,320 |
| 4th quartile | 23.8 | 3,814,740 | 16.9 | 277,110 | 33.1 | 106,130 | 12.7 | 5,800 |
| Total | 100.0 | 16,018,350 | 100.0 | 1,644,330 | 100.0 | 320,495 | 100.0 | 45,735 |
| Composite Risk Score | Composite Risk Score | |||||||
| 1st quartile | 28.2 | 4,510,990 | 2.9 | 47,830 | 20.1 | 64,360 | 2.7 | 1,215 |
| 2nd quartile | 27.1 | 4,340,010 | 1.1 | 18,225 | 23.4 | 75,100 | 2.7 | 1,235 |
| 3rd quartile | 22.2 | 3,554,830 | 45.8 | 752,660 | 29.7 | 95,200 | 44.9 | 20,535 |
| 4th quartile | 22.6 | 3,612,520 | 50.2 | 825,615 | 26.8 | 85,835 | 49.7 | 22,750 |
| Total | 100.0 | 16,018,350 | 100.0 | 1,644,330 | 100.0 | 320,495 | 100.0 | 45,735 |
| Métis | Inuit | |||||||
|---|---|---|---|---|---|---|---|---|
| Not a Low‐Income Occupation | Low‐Income Occupation | Not a Low‐Income Occupation | Low‐Income Occupation | |||||
| Percentage | Frequency | Percentage | Frequency | Percentage | Frequency | Percentage | Frequency | |
| Physical Proximity | Physical Proximity | |||||||
| 1st quartile | 24.5 | 66,470 | 2.8 | 975 | 29.9 | 6,805 | 3.7 | 150 |
| 2nd quartile | 27.1 | 73,530 | 1.8 | 625 | 26.7 | 6,085 | 1.9 | 75 |
| 3rd quartile | 22.5 | 60,905 | 44.0 | 15,100 | 20.1 | 4,570 | 44.8 | 1,795 |
| 4th quartile | 25.8 | 69,925 | 51.3 | 17,620 | 23.3 | 5,315 | 49.6 | 1,990 |
| Total | 100.0 | 270,830 | 100.0 | 34,320 | 100.0 | 22,775 | 100.0 | 4,010 |
| Exposure to Infections or Diseases | Exposure to Infections or Diseases | |||||||
| 1st quartile | 21.8 | 59,090 | 8.4 | 2,900 | 16.7 | 3,805 | 7.2 | 290 |
| 2nd quartile | 25.5 | 69,060 | 24.0 | 8,235 | 21.6 | 4,925 | 16.3 | 655 |
| 3rd quartile | 25.3 | 68,570 | 53.9 | 18,500 | 22.8 | 5,190 | 57.2 | 2,295 |
| 4th quartile | 27.4 | 74,110 | 13.7 | 4,685 | 38.9 | 8,855 | 19.2 | 770 |
| Total | 100.0 | 270,830 | 100.0 | 34,320 | 100.0 | 22,775 | 100.0 | 4,010 |
| Composite Risk Score | Composite Risk Score | |||||||
| 1st quartile | 22.9 | 62,125 | 2.8 | 960 | 21.3 | 4,855 | 1.5 | 60 |
| 2nd quartile | 25.2 | 68,325 | 2.7 | 930 | 20.8 | 4,735 | 3.0 | 120 |
| 3rd quartile | 26.1 | 70,705 | 43.2 | 14,810 | 31.4 | 7,145 | 45.9 | 1,840 |
| 4th quartile | 25.7 | 69,675 | 51.3 | 17,620 | 26.5 | 6,040 | 49.6 | 1,990 |
| Total | 100.0 | 270,830 | 100.0 | 34,320 | 100.0 | 22,775 | 100.0 | 4,010 |
Source: Census of Population (2016) and O*Net.
The author wishes to thank Emmanuelle Arpin, Nicole Denier, Matissa Hollister, Nisa Malli, Gaëlle Simard‐Duplain, and three anonymous reviewers for comments on previous versions of this paper, as well as Viet Vu for timely support and insights regarding the use of the O*Net‐NOC 2016 crosswalk. Any error remains the responsibility of the author.
Footnotes
These occupations correspond to those of the U.S. 2010 Standard Occupational Classification (SOC) system.
Differences between groups in rates of hospitalization, admission to intensive care units, and death are likely to be driven to significant extent by epidemiological risk factors such as chronic health conditions (Public Health Agency of Canada 2020), which cannot be inferred from data on occupational risks of exposure. For such reasons, estimates of the distribution of occupational risks of exposure to COVID‐19 by gender and age may not match epidemiological data.
In Canada, the available evidence on work‐related infections predominantly comes from news reports (Keller and Dobby 2020).
A small number of NOC 2016 occupations representing less than 1 percent of the employed population in 2015 cannot be matched to an O*Net‐SOC occupation. The program files are available on Github at https://github.com/BrookfieldIIE/NOC_ONet_Crosswalk.
Statistics Canada catalogue no. 98‐400‐X2016355.
At the time of writing, access to Long‐Form Census microdata from Statistics Canada's Research Data Centers was suspended because of the ongoing COVID‐19 pandemic. This restriction is unlikely to have an impact on the findings presented in this paper. The public‐use files are sufficient to answer the research questions formulated in this study.
Statistics Canada catalogue no. 98‐400‐X2016356 and 98‐400‐X2016357, respectively.
Additional results presented in Tables A5 and A6 report estimates based on aggregate data allowing sex‐age group education visible minority and sex‐age group education Aboriginal identity configurations, respectively. These are reported separately because publicly available data do allow configurations combining immigration status, visible minority status and Aboriginal identity together.
Note that the R 2 are substantially higher in models controlling for one‐digit occupations, meaning that variation in average occupational risks of exposure between one‐digit NOC codes explains a large share of the overall variation in occupational risk of exposure to COVID‐19 between four‐digit NOC codes and sociodemographic groups.
Note that this does not include individuals who work in nonhealth occupations in the health care sector (in a business or organization primarily operating in the health care sector).
In addition, Table A1 shows that immigrants in health occupations have a slightly higher mean occupational risk of exposure to diseases or infections than Canadian‐born workers (1.2 point), but a substantially lower median value (by 3.8 points). This suggests an overall distribution towards higher occupational scores among immigrants, but an underrepresentation of immigrants among the highest scoring occupations, namely nurses, physicians, and other health care professionals with frequent interactions with patients. This is possibly due to the fact that those occupations have high barriers to the international transfer of credentials, limiting the ability of immigrants educated abroad in those professions to enter them in Canada. A similar difference in median gap is observed for women, possibly driven by the lower score of some female‐dominated health occupations. Note that within health occupations for example, physicians, dentists, and veterinarians have an average exposure to diseases or infections score of 93.7, while it is 30 points below at 63.5 for therapy and assessment professionals. Therefore, heterogeneity in occupational risks of exposure is also found within broad occupational groupings.
REFERENCES
- Appelbaum, E. , Bailey T., Berg P. and Kalleberg A.L.. 2000. Manufacturing Advantage: Why High Performance Work Systems Pay Off. Ithaca, NY: Cornell University Press. [Google Scholar]
- Attewell, P. 1990. “What Is Skill?” Work and Occupations 17(4):422–48. [Google Scholar]
- Autor, D.H. , Levy F. and Murnane R.J.. 2003. “The Skill Content of Recent Technological Change: An Empirical Exploration.” Quarterly Journal of Economics 118(4):1279–1333. [Google Scholar]
- Bignami‐van Assche, S. , Ghio D. and van Assche A.. 2020. Not Just a Concern for the Elderly: Age Gradient in COVID‐19‐Related Infections in Italy, Spain and the Netherlands. Cahier Scientifique 2020–17. Montreal: CIRANO. [Google Scholar]
- Blau, F.D. and Kahn L.M.. 2017. “The Gender Wage Gap: Extent, Trends, and Explanations.” Journal of Economic Literature 55(3):789–865. [Google Scholar]
- Blinder, A.S. 2009. “How Many US Jobs Might Be Offshorable?” World Economics 10(2):41–78. [Google Scholar]
- Carbonaro, W. 2007. “The Effects of Education and Cognitive Skill on Earnings: How Much Do Occupations and Jobs Matter?” Research in Social Stratification and Mobility 25(1):57–71. [Google Scholar]
- Cohen, L.E. 2013. “Assembling Jobs: A Model of How Tasks Are Bundled into and across Jobs.” Organization Science 24(2):432–54. [Google Scholar]
- Collins, R. 1979. The Credential Society: An Historical Sociology of Education and Stratification. New York: Academic Press. [Google Scholar]
- Dingel, J. and Neiman B.. 2020. “How Many Jobs Can Be Done at Home?” Working Paper no. 26948, National Bureau of Economic Research, Cambridge, MA. [Google Scholar]
- England, P. 2010. “The Gender Revolution Uneven and Stalled.” Gender & Society 24(2):149–66. [Google Scholar]
- Farkas, G. , England P., Vicknair K. and Kilbourne B.S.. 1997. “Cognitive Skill, Skill Demands of Jobs, and Earnings among Young European American, African American, and Mexican American Workers.” Social Forces 75(3):913–38. [Google Scholar]
- Frenette, M. and Frank K.. 2017. “Do Postsecondary Graduates Land High‐Skilled Jobs?” Analytical Studies Branch Research Paper Series No. 388, Catalogue No. 11F0019M. Ottawa: Statistics Canada, January 24, 2017. [Google Scholar]
- Frenette, M. and Frank K.. 2018. “Are Canadian Jobs More or Less Skilled than American Jobs?” Analytical Studies Branch Research Paper Series No. 406, Catalogue No. 11F0019M. Ottawa: Statistics Canada, July 25, 2018. [Google Scholar]
- Frey, C.B. and Osborne M.A.. 2017. “The Future of Employment: How Susceptible Are Jobs to Computerisation?” Technological Forecasting and Social Change 114:254–80. [Google Scholar]
- Gamio, L. 2020. “The Workers Who Face the Greatest Coronavirus Risk.” New York Times, March 15. Retrieved April 4, 2020 (https://www.nytimes.com/interactive/2020/03/15/business/economy/coronavirus-worker-risk.html).
- Gascon, C. 2020. “COVID‐19: Which Workers Face the Highest Unemployment Risk?” Economy Blog, Federal Reserve Bank of St. Louis, St. Louis, MO. Retrieved April 16, 2020 (https://www.stlouisfed.org/on-the-economy/2020/march/covid-19-workers-highest-unemployment-risk). [Google Scholar]
- Goos, M. , Manning A. and Salomons A.. 2009. “Job Polarization in Europe.” American Economic Review 99(2):58–63. [Google Scholar]
- Grodsky, E. and Pager D.. 2001. “The Structure of Disadvantage: Individual and Occupational Determinants of the Black‐White Wage Gap.” American Sociological Review 66(4):542–67. [Google Scholar]
- Grusky, D.B. and Weeden K.A.. 2001. “Decomposition without Death: A Research Agenda for a New Class Analysis.” Acta Sociologica 44(3):203–18. [Google Scholar]
- Keller, J. and Dobby C.. 2020. “Hundreds of Alberta Infections Linked to Meat‐Processing Plant.” Globe and Mail, April 19. Retrieved May 10, 2020 (https://www.theglobeandmail.com/canada/alberta/article-covid-19-outbreak-in-high-river-linked-to-infections-at-nearby/).
- Kikuchi, L. and Khurana I.. 2020. “COVID‐19: Which Occupations Are Most at Risk?” Autonomy. Retrieved April 4, 2020 (https://autonomy.work/portfolio/jari/).
- Liu, Y. and Grusky D.B.. 2013. “The Payoff to Skill in the Third Industrial Revolution.” American Journal of Sociology 118(5):1330–74. [Google Scholar]
- Mouw, T. and Kalleberg A.L.. 2010. “Occupations and the Structure of Wage Inequality in the United States, 1980s to 2000s.” American Sociological Review 75(3):402–31. [Google Scholar]
- Public Health Agency of Canada . 2020. “Coronavirus Disease 2019 (COVID‐19).” Daily Epidemiological Update . Retrieved May 3, 2020 (https://www.canada.ca/content/dam/phac-aspc/documents/services/diseases/2019-novel-coronavirus-infection/surv-covid19-epi-update-eng.pdf).
- Purdie, A. , Hawkes S., Buse K., Onarheim K., Aftab W., Low N. and Tanaka S.. 2020. “Sex, Gender and COVID‐19: Disaggregated Data and Health Disparities.” BMJ Global Health Blog. Retrieved May 4, 2020 (https://blogs.bmj.com/bmjgh/2020/03/24/sex-gender-and-covid-19-disaggregated-data-and-health-disparities/).
- Schieman, S. and Koltai J.. 2017. “Discovering Pockets of Complexity: Socioeconomic Status, Stress Exposure, and the Nuances of the Health Gradient.” Social Science Research 63:1–18. [DOI] [PubMed] [Google Scholar]
- Schirle, T. 2015. “The Gender Wage Gap in the Canadian Provinces, 1997–2014.” Canadian Public Policy 41(4):309–19. [Google Scholar]
- Simard‐Duplain, G. and St‐Denis X.. 2020. “An Exploration of the Role of Education in Intergenerational Mobility in Canada Using Data from the Longitudinal and International Study of Adults.” Canadian Public Policy 43(6). [Google Scholar]
- Statistics Canada . 2020a. “Labour Force Survey, March 2020.” The Daily, April 9. Statistics Canada catalogue no. 11‐001‐X. Ottawa: Statistics Canada. [Google Scholar]
- Statistics Canada . 2020b. “Labour Force Survey, April 2020.” The Daily, May 8. Statistics Canada catalogue no. 11‐001‐X. Ottawa: Statistics Canada. [Google Scholar]
- Summerfield, F. 2014. “Labor Market Conditions, Skill Requirements and Education Mismatch.” Canadian Labour Market and Skills Researcher Network Working Paper No. 134, Vancouver School of Economics, Vancouver, BC. [Google Scholar]
- Summerfield, F. 2016. “Matching Skill and Tasks: Cyclical Fluctuations in the Overqualification of New Hires.” Rimini Centre for Economic Analysis Working Paper series 16‐08, Rimini Centre for Economic Analysis, Rimini, Italy. [Google Scholar]
- The New York Times . 2020. “Coronavirus in the U.S.: Latest Map and Case Count.” New York Times, May 10. Retrieved May 10, 2020 (https://www.nytimes.com/interactive/2020/us/coronavirus-us-cases.html).
- Vu, V. 2019. “Connecting the Dots: Linking Canadian Occupations to Skills Data.” Brookfield Institute for Innovation + Entrepreneurship, Toronto. Retrieved April 11, 2020 (https://brookfieldinstitute.ca/commentary/connecting-the-dots-linking-canadian-occupations-to-skills-data). [Google Scholar]
- Vu, V. , Lamb C. and Zafar A.. 2019. Who Are Canada's Tech Workers? Toronto: Brookfield Institute for Innovation + Entrepreneurship. [Google Scholar]
- Vu, V. and Malli N.. 2020. “Anything but Static: Risks of COVID‐19 to Workers in Canada.” Brookfield Institute for Innovation + Entrepreneurship. Retrieved April 11, 2020 (https://brookfieldinstitute.ca/commentary/anything-but-static-risks-of-covid-19-to-workers-in-canada). [Google Scholar]
- Waite, S. 2017. “Postgraduate Wage Premiums and the Gender Wage Gap in Canada.” Canadian Journal of Higher Education 47(2):156–87. [Google Scholar]
- Weeden, K.A. 2002. “Why Do Some Occupations Pay More than Others? Social Closure and Earnings Inequality in the United States.” American Journal of Sociology 108(1):55–101. [Google Scholar]
- Weeden, K.A. and Grusky D.B.. 2005. “The Case for a New Class Map.” American Journal of Sociology 111(1):141–212. [Google Scholar]
- Weeden, K.A. and Grusky D.B.. 2012. “The Three Worlds of Inequality.” American Journal of Sociology 117(6):1723–85. [Google Scholar]
- Weeden, K.A. , Kim Y.‐M., Di Carlo M. and Grusky D.B.. 2007. “Social Class and Earnings Inequality.” American Behavioral Scientist 50(5):702–36. [Google Scholar]
- Williams, M. 2013. “Occupations and British Wage Inequality, 1970s–2000s.” European Sociological Review 29(4):841–57. [Google Scholar]
- Williams, M. and Bol T.. 2018. “Occupations and the Wage Structure: The Role of Occupational Tasks in Britain.” Research in Social Stratification and Mobility 53:16–25. [Google Scholar]
- Wodtke, G.T. 2017. “Social Relations, Technical Divisions, and Class Stratification in the United States: An Empirical Test of the Death and Decomposition of Class Hypotheses.” Social Forces 95(4):1479–1508. [Google Scholar]
- Zajacova, A. and Lawrence E.M.. 2018. “The Relationship between Education and Health: Reducing Disparities through a Contextual Approach.” Annual Review of Public Health 39(1):273–89. [DOI] [PMC free article] [PubMed] [Google Scholar]