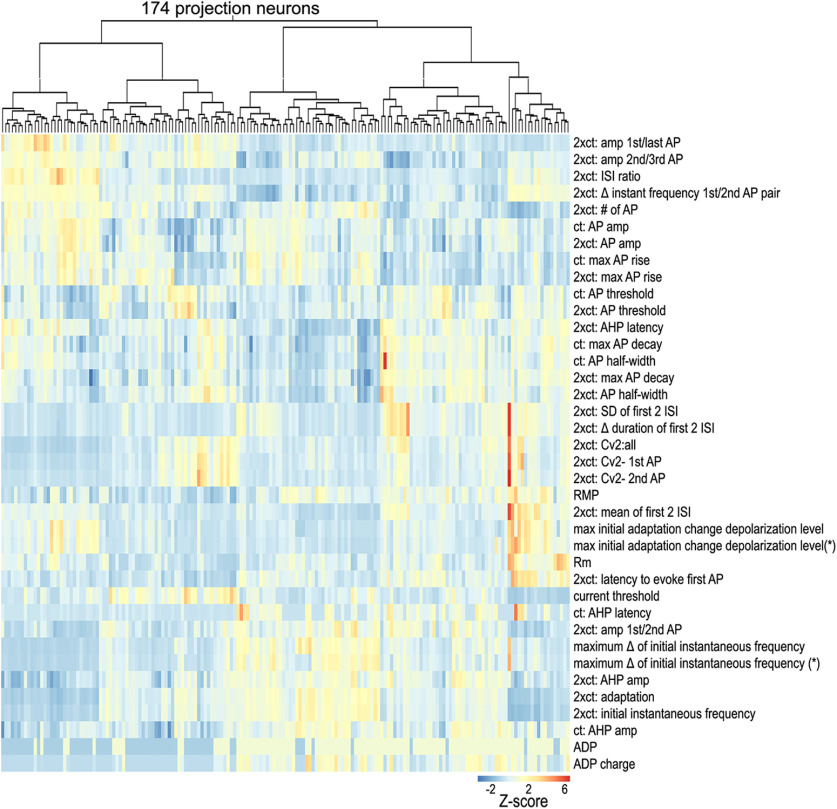
Figure 6.
Unsupervised clustering of claustrum PNs. Intrinsic electrical properties of 174 PNs were clustered in an unsupervised manner. Top, Dendrogram showing clusters of PNs. Bottom, Z-scores of extracted intrinsic properties (rows) are shown for each individual cell (column). Hot colors indicate high Z-scores, while cool colors indicate low Z-scores.

