Abstract
Coronavirus disease 2019 (COVID‐19) has spread out as a pandemic threat affecting over 2 million people. The infectious process initiates via binding of SARS‐CoV‐2 Spike (S) glycoprotein to host angiotensin‐converting enzyme 2 (ACE2). The interaction is mediated by the receptor‐binding domain (RBD) of S glycoprotein, promoting host receptor recognition and binding to ACE2 peptidase domain (PD), thus representing a promising target for therapeutic intervention. Herein, we present a computational study aimed at identifying small molecules potentially able to target RBD. Although targeting PPI remains a challenge in drug discovery, our investigation highlights that interaction between SARS‐CoV‐2 RBD and ACE2 PD might be prone to small molecule modulation, due to the hydrophilic nature of the bi‐molecular recognition process and the presence of druggable hot spots. The fundamental objective is to identify, and provide to the international scientific community, hit molecules potentially suitable to enter the drug discovery process, preclinical validation and development.
Keywords: COVID-19, docking, pharmacophore, molecular dynamics, protein-protein interactions
Finding hits for the Spike: Our computational studies on SARS‐CoV‐2 Spike protein receptor binding domain identified the N‐terminal region as a potential druggable hot‐spot. Herein, docking and pharmacophore HTS yielded a set of consensus molecules suitable for drug discovery screening. These compounds could represent lead molecules able to modulate the Spike‐ACE2 protein‐protein interaction, a putative intervention mark to discover therapeutics against SARS‐CoV‐2 pandemic.
Introduction
The end of the year 2019 has been marked as a critical period for the humankind history, due to the epidemic spreading of virus‐transmitted flu. In December 2019, first cases of severe acute respiratory syndrome caused by the novel coronavirus, SARS‐CoV‐2, were detected and the related infection rapidly spread out all over the world.1 Due to a very high rate of virulence associated to morbidity and mortality (330 infected people and 22.9 deaths per million inhabitants)2 affecting the global population in 210 countries, in March 2020 the World Health Organization (WHO) stated COronaVIrus Disease 2019 (COVID‐19) as a pandemic, representing a health emergency of international concern.3, 4 Since the beginning of 21st century, coronaviruses caused disease outbreaks: SARS‐CoV emerged in Guangdong (China) in 2002,5, 6 while during the 2012 MERS‐CoV (Middle East respiratory syndrome coronavirus) affected the Arabian Peninsula.7, 8 These viruses initially were of a zoonotic nature but over the years they crossed the species barrier through bats, in the case of SARS‐CoV and SARS‐CoV‐2, and dromedary camels for MERS.9, 10, 11 Coronaviruses are classified in four genera, with both SARS‐CoV and SARS‐CoV‐2 belonging to β‐CoV genus.12 On the basis of sequence alignments, SARS‐CoV and SARS‐CoV‐2 seemed strongly correlated, sharing about 76 % of sequence identity. These are positive‐strand RNA viruses containing a membrane covered from Spike (S) glycoprotein that provides their characteristic crown aspect.13 The interaction with the host cell is promoted by the S glycoprotein, that mediates receptor recognition and membrane fusion.14, 15 S protein is composed of two functional subunits S1 and S2, which remain non‐covalently bound in the pre‐fusion state. S1 contains the receptor‐binding domain (RBD) also referred as domain B, involved in the binding with the host cell receptor; while S2 contains the fusion machinery and is responsible for membrane fusion. During the viral infection, when S1 binds the host cell receptor, the S protein is cleaved at the boundary site, between S1 and S2 subunits (S1‐S2 cleavage site), converting to the post‐fusion conformation. This first event promotes a second cleavage by the host protease at a different cleavage site, leading conformational changes in S2 and enabling membrane fusion.16, 17, 18 The receptor‐binding and proteolytic events act in synergy to induce the conformational changes and thus helping the coronavirus to enter the host cell.19 In humans, the first entry step for both SARS‐CoV‐2 and SARS‐CoV life cycles is mediated by the interaction with Angiotensin‐converting enzyme 2 (ACE2). ACE2 is a protein mainly expressed in type II alveolar lung cells, oesophagus, heart and kidney.20, 21 Structurally, it comprises a N‐terminal peptidase domain (PD) able to bind the virion S glycoprotein, and a C‐terminal Collectrin‐like domain (CLD).22, 23 The S protein of SARS‐CoV‐2 interacts with ACE2 at the surface of type II pneumocytes with similar affinity to SARS‐CoV S glycoprotein.24, 25 The crystal structures of coronaviruses components showed the presence of N‐linked glycans overlay on the surface of S, and it has been proposed as a mechanism for the virus to elude the immune system.26, 27 In detail, in a first stage, the host immune system fails to recognize the coronaviruses as pathogens due to the presence of S glycoproteins bearing numerous sugar entities over the membrane. In fact, the immune system confuses the virus with normal sugar‐coated host cells and does not react to them. In this way, viral S glycoproteins bind allowing the virus to enter into the host cells.28 The glycosylation region is found mainly on S1 subunit, and it includes the RBD.29
Starting from these evidences, several research efforts have been done to tackle SARS‐CoV‐2 infection spreading trying to identify potential therapeutics.30, 31, 32, 33, 34, 35, 36, 37, 38, 39, 40 Indeed, several neutralizing antibodies recognize S glycoprotein as main antigen, suggesting that it could be a potential target for rational design of vaccines and therapeutics.19, 41, 42, 43, 44, 45 The RBD could be a valid region to explore for the design of novel drugs.46 In the past outbreaks, SARS‐CoV S glycoprotein was confirmed as the site of action of neutralizing antibodies, such as S230 antibody, isolated from human survivors.47, 48, 49 In 2019, Walls et al. showed that S230 blocked the virus‐host receptor binding and induced a conformational change in the fusion machinery with a ratcheting mechanism. S glycoprotein in complex with S230 was characterized in a closed and open state (PDB IDs: 6NB6 and 6NB7, respectively). The analysis of SARS‐CoV ‐ antibody complex revealed that the S230 epitope is located near Leu443 residue, and Tyr442 and Tyr475 are residues involved in the interaction. These residues are normally involved in the binding with ACE2 strengthening the hypothesis that S230 acts as a competitive inhibitor of coronavirus‐host receptor interaction.50
In this work, we describe a computational analysis of the interaction between S protein and ACE2 peptidase domain, with the aim of 1) identifying a putative druggable area on the RBD interface; 2) targeting this site with an in silico high‐throughput screening campaign. The main goal is to identify small molecules as potential modulators of the entry step of the viral life cycle, thus providing the scientific community with a suitable starting point for drug discovery efforts on S target. Indeed, a potential drug able to modulate this protein‐protein interaction (PPI) could work as a fusion inhibitor, representing an interesting strategy already investigated for emerging viruses outbreaks.51 Inhibitors of viral entry are likely to block the viral spreading and reduce the viral load at the very beginning of the infection.
It is important to underline that the molecular contacts between S glycoprotein and ACE2 are widespread within the interaction interface and therefore it may be challenging to design small molecule modulators capable of inhibiting the RBD domain. However, the S glycoprotein RBD‐ACE2 recognition process is mainly mediated by hydrophilic interactions contrary to the most common PPI hydrophobic nature.52, 53 Considering that the strategy of targeting the virus‐human interface with monoclonal antibodies and vaccines has been thoroughly explored with a robust preclinical and clinical pipeline,54, 55 we decided to follow a different avenue. Therefore, we focused our attention on a computational approach assessing the binding contribution of each amino acid interactions, to identify suitable druggable hot spots or binding pockets. In the context of the current health emergency, the resulting hypothesis and the potential hit compounds identified may be useful tools for other research groups and for the entire scientific community to initiate drug discovery programmes and identify novel small molecules against COVID‐19.
Results and Discussion
Overlap of PDB structures highlighting open and closed states of S glycoprotein
The currently available X‐ray crystal structures show that SARS‐CoV‐2 S glycoprotein forms a long trimer with a triangular cross‐section, containing the receptor‐binding motif (RBM), responsible for the recognition process of ACE2.56 The RBD is composed by a core and an extensive loop, RBM,57 and shows two different conformations: the “up state” (PDB ID: 6VYB) (Figure S1, on the left) and the “down state” (PDB ID: 6VXX) (Figure S1, on the right).
In the first X‐ray crystal structure, two S chains are in down‐state and the third one is in up‐state, whereas the other trimeric structure presents all S chains in down state.58 When the S glycoprotein is in up conformation, an extended loop of the RBD surrounds the ACE2 interface, while in down conformation is buried into the interface between S1/S2 subunits. The structure alignment of SARS‐CoV‐2 S trimers in open and closed states highlights the exposition of RBD loop on the virion surface, enabling the interaction with the host receptor. As previous works revealed for SARS‐CoV and MERS‐CoV, the open conformation is required to allow the binding between S protein and ACE2, triggering the infection mechanism, and thus leading to conformational changes and membrane fusion.58, 59 In fact, in the open state, the S1 loop exposes residues of the receptor‐binding motif, known to be involved in the binding with ACE2, otherwise hidden in the closed state (Figure 1), suggesting that the opening process of this loop is necessary to establish the interaction with ACE2 PD.
Figure 1.
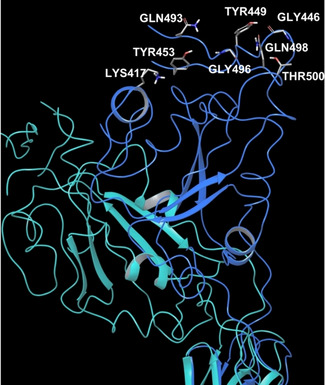
SARS‐CoV‐2 PDB structures superposition unveiling RBD dynamic behaviour. On the left, overlap of SARS‐CoV‐2 S trimers in closed (PDB 6VXX) and open state (PDB 6VYB); on the right, a close‐up: the light blue structure shows PDB 6VXX S protein, while the blue chain exhibits the open state of PDB 6VYB S protein. PDB 6VXX: green, violet and light blue chains in closed conformations; PDB 6VYB: yellow, pink and blue chains in open conformations.
Furthermore, the superimposition of SARS‐CoV and SARS‐CoV‐2 X‐ray crystal structures in open conformation reveals a similar dynamic behaviour for both B domains (Figure S2), exposing the loop with the key residues for the interaction with ACE2.
The high rate of RBD flexibility highlighted from the above structural comparative analysis was extensively demonstrated by Molecular dynamics (MD) simulations performed by D. E. Shaw research group.60 In this work, two MD simulations of 10 microseconds each were run on PDB 6VXX to explore the closed conformation, and PDB 6VYB to investigate the open state, respectively. The trajectories were collected and made available for the scientific community on the website. In the first MD simulation, during the whole experiment, the trimer in closed conformation kept RBD interface in a buried state against S2 subunit. In the second MD simulation, RBD initially exhibited a partially open conformation (Figure S3, on the left), experiencing a relevant displacement after about 2 microseconds, and finally drifting apart from S2 subunit (Figure S3, on the right). Importantly, these evidences are of a crucial importance to deeply understand the molecular events during the first step of the interaction with host ACE2.
Similarity analysis of SARS‐CoV and SARS‐CoV‐2 S proteins
SARS‐CoV and SARS‐CoV‐2 S glycoproteins share 76 % amino acidic sequence identity and 50 % identity within the RBM, in B domain.25
The structure alignment of SARS‐CoV and SARS‐CoV‐2 RBDs both in complex with ACE2 showed that the interface between the two S glycoproteins and ACE2 is similar.
A total of 18 residues of RBD in SARS‐CoV‐2 are involved in the interaction with ACE2. Among them, nine are equivalent in SARS‐CoV and SARS‐CoV‐2, and include Tyr436‐Tyr449, Tyr440‐Tyr453, Asn473‐Asn487, Tyr475‐Tyr489, Gly482‐Gly496, Thr486‐Thr500, Gly488‐Gly502, Tyr491‐Tyr505, respectively. Five amino acids have side chains with similar biochemical or physical properties, such as Leu443‐Phe456, Leu472‐Phe486, Asn479‐Gln493, Thr487‐Asn501 and Tyr442‐Leu455 (Table S1).
Although the RBMs are very similar, a few changes involving the residue positions can affect the binding affinity between S glycoprotein and ACE2. The main mutation seems to involve Val404 residue in SARS‐CoV, replaced by Lys417 in SARS‐CoV‐2, in the middle region of RBD. The side chain of Lys417 forms a salt‐bridge with the acid group of Asp30 of ACE2, probably strengthening the bimolecular interaction between SARS‐CoV‐2 RBD and ACE2, while Val404 residue does not seem to be involved in any interaction. At the same time, the replacement of Arg426 in SARS‐CoV with Asn439 amino acid in SARS‐CoV‐2 takes away two prominent salt‐bridge contacts with ACE2 Asn329 residue, weakening the PPI.59, 61 However, the conservation of several contact residues could explain the overall similar binding affinity, reported in literature with KD values of 1.2 nM for SARS‐CoV‐2 and 5 nM for SARS‐CoV,58 respectively. This comparison can provide crucial information about the putative key residues for the interaction between RBD and ACE2 proteins.
Computational alanine scanning on SARS‐CoV‐2 – ACE2 interaction interface
As discussed above, the analysis of the interactions between ACE2 and SARS‐CoV‐2 S glycoprotein highlighted some challenges from a drug discovery perspective, in the attempt of modulating this PPI with small molecules. It is noteworthy that this bi‐molecular interaction is not a traditional example of PPI, in which the interaction interfaces are often shallow with lack of deep pockets and it does not bear a canonical active site to target with a synthetic ligand. In general, in PPI, both protein partners establish high affinity contacts through the so‐called hot spot amino acids.62 These residues are mainly hydrophobic and usually widely dislocated along the whole protein surfaces, and thus sequentially not connected among them within the same protein, creating a discontinuous epitope.63, 64, 65 Notably, from the currently available PDB structures of ACE2‐S protein interaction (PDB IDs: 6M17 and 6M0J), the complex shows a one to one interaction pattern, where the contacts between the two proteins are mediated mainly by hydrogen bonds, some salt bridges and few Van der Waals forces. Due to the width of this protein‐protein interface, it was possible to identify three regions of interaction, such as N‐terminal, central and C‐terminal regions (Figure 2).
Figure 2.

Spike RBD‐ACE2 PD interactions according to three interface regions. PDB ID 6M0J – light blue chain is ACE2 PD, while orange chain is Spike RBD. On the left, N‐terminal region; in the middle, central region; on the right, C‐terminal region.
Both PDB structures show mostly the same key interactions between S protein and ACE2 PD. More in detail, at the N‐terminus, the main interactions between SARS‐CoV‐2 RBD and ACE2 PD involve the following residues: Thr500 and Tyr41 hydroxyl groups establish a hydrogen bond; Gly502 backbone NH interacts with the backbone carbonyl of Lys353; Gly446 carbonyl makes contact with Gln42 side chain; Tyr449 hydroxyl side chain connects to Asp38 and Gln42 side chains; Tyr505 hydroxyl group shows an interaction with Glu37 side chain; and Gly496 backbone carbonyl group interacts with Lys353 side chain. In the middle region of the interaction interface, it is reported a hydrogen bond interaction of the aromatic hydroxyl side chain of Tyr453 with the side chain of His34, while Lys417 establishes a salt bridge and hydrogen bond with Asp30 of ACE2 peptidase domain. Finally, at the C‐terminus, Asn487 side chain of S protein forms H‐bond interaction with ACE2 Gln24 and Tyr83 side chains.61
In order to quantitatively explore the relevance of specific interacting residues at the ACE2‐S glycoprotein interaction interface, a computational alanine scanning was performed on both PDB structures. Although this technique may be inaccurate, it offers a rapid insight about protein‐protein hot spots affinity relevance.66 Thus, the complexes were optimized at pH 7.4 and the resulted structures were used to perform the alanine scanning calculation, one per each protein‐protein complex. The computational alanine scanning calculated value changes in free energy of binding affinity (ΔΔGaffinity) between protein partners, after applying mutations to alanine for those residues participating in the PPI interface. The tool provided ΔΔGaffinity values, measuring the difference between the free energy of the mutated complex and the ΔGaffinity of the wild‐type complex.
Therefore, a positive ΔΔGaffinity indicates a reduction in protein‐protein binding affinity for the complex, and it provides indication the contribution of each amino acid to the binding affinity. Thus, it is possible to conclude that not all the mutations are equally important. Usually, a crucial interaction hot spot is identified when mutation to alanine in a given position causes a change in ΔΔG≥2.0 kcal/mol,67 while residues with ΔΔG<2 kcal/mol are defined neutral.68 According to Beard et al., the computational alanine scanning results performed using Schrödinger suite have a correlation with the experimental ones, and a residue can be defined as an interaction hot spot, if its mutation to alanine generates a ΔΔGaffinity≥3.0 kcal/mol.69 In Table S2, the ΔΔGaffinity values are reported for the residues showing values≥3.0 kcal/mol for ACE2 and S glycoprotein interaction according to the three interface regions (Figure S4). When analysing these results, all the identified hot spots of S glycoproteins are common between the two alanine scanning experiments, while for ACE2 some hot spot residues differ from one PDB to another. For this reason, only the common hot spots were taken further in our study, considering that the non‐shared hot spots are likely not crucial. Furthermore, the obtained ΔΔGaffinity values allowed us to create a sort of contribution‐to‐binding ranking, discriminating the most relevant hot spots from the less important residues. In this scenario, for ACE2 peptidase domain (from PDB 6M17), the key residues were Tyr41, involved in the recognition at N‐terminal region, Tyr83 in the C‐terminal region and His34 in the central region. Referring to the other PDB structure 6M0J, the most valued residues were found in the N‐terminal region, with Tyr41, Gln42, Gln24 and Lys353, while Tyr83 and Lys31 belonged to the C‐term and middle region, respectively. At the same time, for S glycoprotein from PDB 6M17 the residues Phe486 and Tyr489 in the C‐terminal region were found to be crucial, while in the N‐terminal region Thr500, Gly496, and Asn501 were the amino acid contributing the most to the binding. Looking at PDB 6M0J, the most valued residues were Asn487 and Phe486 involved in the C‐terminal region, Lys417 and Gln493 in the middle region, and Tyr505, Asn501 and Thr500 in the N‐terminal.
In conclusion, notably, the majority of identified hot spots for both proteins were significantly involved in N‐terminal region (Table S2), suggesting this part of the protein‐protein interface as fundamental for the interaction compared to the central and the C‐terminal regions. In particular, Tyr41 aromatic hydroxyl residue, Lys353 backbone carbonyl and Gln42 side chain of ACE2 seem to be the key recognition features in the interaction with the RBD domain of S glycoprotein and may pave the way forward in the selection and design of novel RBD S small molecule modulators.
Molecular dynamics simulations on SARS‐CoV‐2 S protein in complex with ACE2
The above analysis provided several information about crucial interactions between the two protein partners, only from a static point of view. Therefore, in order to get more comprehensive data about crucial contacts, the two PDB structures of ACE2‐Spike protein complex (PDB IDs: 6M17 and 6M0J) were used to perform two MD simulations of 200 nanoseconds each in water solvent. The experiments were performed using Desmond70 with the aim of exploring the frequency and stability of interactions during the whole trajectories. For PDB 6M17, chain B (ACE2 PD) and chain E (SARS‐CoV‐2 RBD) were included in the MD, while for PDB 6M0J chain A (ACE2 PD) and chain E (SARS‐CoV‐2 RBD) were considered. For both MD simulations, the root‐mean‐square deviation (RMSD) plot was generated to check the stability of the protein‐protein complexes during the simulation, including also energy, temperature and pressure of the systems during the trajectories. For PDB 6M17 the system reached a stationary shape at about 30 nanoseconds of simulation, while for PDB 6M0J it was obtained at about 80 nanoseconds of trajectory (Table S3). All the other parameters turned out to be reliable for a further analysis. Thus, the frames of both trajectories (1001 per simulation) were clustered applying average as hierarchical cluster linkage method to identify five representative clusters for all frames for PDB 6M17, and ten clusters for PDB 6M0J. According to the RMSD plot, only frames corresponding to the stable trajectory portion – after 30 nanoseconds for 6M17 and after 80 nanoseconds for 6M0J – were considered to retrieve the most abundant and frequent interactions amongst the clusters. Table 1 summarises the related results, and details about H‐bond frequency occurrences are displayed in Table S4. Although MD performed on PDB 6M17 (cryo‐EM) highlighted a fewer number of interactions than PDB 6M0J (X‐ray), this fact should be ascribed to the different methods applied to resolve 3D structures and the consequent different starting points for MD simulations. However, the two MD simulations shared ten equal interactions, that were considered the most important; besides for those different contacts, most of the involved amino acids were highlighted for both MD. Notably, the information retrieved from both MD simulations were mainly in accordance with data from literature and computational alanine scanning approaches. Therefore, these results were used as references for selecting molecules as putative modulators of ACE2‐S protein interaction (refer to the next section).
Table 1.
MD results showing the key interactions between ACE2 PD and SARS‐CoV‐2 RBD. On the left, MD results for PDB 6M17; on the right MD results for PDB 6M0J.
|
PDB ID: 6M17 |
PDB ID: 6M0J |
||||
|---|---|---|---|---|---|
|
ACE2 PD |
Spike RBD |
Interaction |
ACE2 PD |
Spike RBD |
Interaction |
|
Gln24 |
Gln474 |
Contact[a] |
Gln24 |
Asn487 |
1 H‐bond |
|
Thr27 |
Phe456 |
Contact[a] |
Thr27 |
Phe456 |
Contact[a] |
|
Phe28 |
Tyr489 |
Contact[a] |
Phe28 |
Ty489 |
Contact[a] |
|
Asp30 |
Lys417 |
1 H‐bond+1 salt bridge |
Phe28 |
Phe486 |
Contact[a] |
|
Lys31 |
Gln493 |
1 H‐bond |
Asp30 |
Lys417 |
1 H‐bond+1 salt bridge |
|
His34 |
Tyr453 |
1 H‐bond |
Lys31 |
Gln493 |
1 H‐bond |
|
His34 |
Leu455 |
Contact[a] |
Lys31 |
Tyr489 |
Contact[a] |
|
Tyr41 |
Thr500 |
1 H‐bond |
His34 |
Tyr453 |
1 H‐bond |
|
Tyr83 |
Ala475 |
1 H‐bond |
His34 |
Leu455 |
Contact[a] |
|
Tyr83 |
Gly476 |
Contact[a] |
Tyr41 |
Thr500 |
Contact[a] |
|
Lys353 |
Gly502 |
1 H‐bond |
Tyr41 |
Gln498 |
Contact[a] |
|
Lys353 |
Asn501 |
Contact[a] |
Phe79 |
Gln486 |
Contact[a] |
|
Lys353 |
Tyr505 |
Contact[a] |
Tyr83 |
Asn487 |
Contact[a] |
|
|
|
|
Tyr83 |
Phe486 |
Contact[a] |
|
|
|
|
Lys353 |
Gly502 |
1 H‐bond |
|
|
|
|
Lys353 |
Asn501 |
Contact[a] |
|
|
|
|
Lys353 |
Tyr505 |
Contact[a] |
[a] Expressed as good VdW shape complementarity71.
Supervised molecular docking to identify potential compounds able to bind N‐terminal region
As already mentioned the aim of this work was to identify potential compounds able to modulate ACE2‐S protein interaction interface. For this reason, based on the previous data, we decided to perform a knowledge‐based and computational data‐driven molecular docking screenings on the three contact regions between ACE2 PD and SARS‐CoV‐2 RBD, at the N‐terminal, central and C‐terminal regions, respectively. For this purpose, PDB 6M0J was chosen due to its better resolution (2.45 Å) compared to the PDB 6M17 (2.9 Å), in order to create three different docking grids on S RBD, one per each interaction region. For virtual screening purposes, two different compound libraries were used, i. e. in‐stock MolPort library (commercially available compounds), and a library consisting of molecules Life Chemicals databases. Due to the high number of compounds, high‐throughput virtual screenings were performed and the best 10,000 molecules were re‐docked applying docking standard precision (SP) using Schrödinger suite.72, 73 classified as PPI modulators by Asinex, ChemDiv, Enamine and the outputs of these overall six docking screenings were analysed and the best 1,000 molecules were selected according to interactions retrieved from literature, computational alanine scanning, MD simulations and docking scores for a further computational exploration. The analysis of ligand binding poses highlighted that the N‐terminal portion was able to accommodate the ligands better compared to the middle and C‐term regions. In fact, in these latter, compounds exhibited significantly different binding poses among them, while the protein surface of N‐terminal region showed to take part into the interactions providing a small pocket able to accommodate functional groups of the docked compounds. Interestingly, many ligands had a complementary fit with the RBD S cavity described by the following amino acids as depicted in the Figure 3: Arg503, Tyr505, Asn501, Phe497, Gly496 and Tyr495. These collected information provided us a good starting point to deeply explore this region at the interface and consider it as the most potentially druggable compared to the other two. Therefore, compounds establishing contacts with key residues at the N‐terminal region were selected and used to perform pharmacophore screenings.
Figure 3.

RBD N‐terminal binding region description. On the left, protein surface of N‐terminal region; in the middle, residues composing the cavity; on the right, an example of ligand binding pose at N‐terminal region.
Pharmacophore screening of selected compounds from docking screenings
In order to focus our attention on a small representative group of the most promising compounds, the molecules selected from docking screenings were further analysed using a pharmacophore approach. For this purpose, two different pharmacophore maps of SARS‐CoV‐2 RBD‐ACE2 PD N‐terminal interface were created, one per PDB structure (PDB IDs: 6M17 and 6M0J). As above mentioned, we focused our attention on the portion of interaction interface we considered most targetable, i. e. the N‐terminal region, neglecting the other two portions. Therefore, from PDB 6M17, the pharmacophore of N‐term was composed by three features (Figure 4, on the left): a hydrogen‐bond donor on Tyr41 side chain hydroxyl and two hydrogen bond acceptors, namely one on Lys353 backbone carbonyl and another on carboxyl of Glu37 side chain of ACE2 PD.
Figure 4.
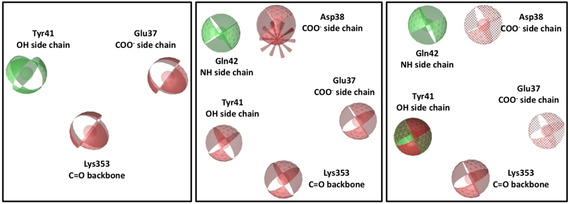
Pharmacophore maps built on RBD N‐terminal region. On the left, 6M17 Pharmacophore map; in the middle, 6M0J Pharmacophore map; on the right, shared pharmacophore map. Red spheres are hydrogen‐bond acceptors, green spheres are hydrogen bond donors, green‐red sphere is both hydrogen‐bond donor and acceptor, red spike is a negative ionisable feature and dotted spheres are features marked as optional.
For the second PDB structure (PDB ID: 6M0J), a six‐featured pharmacophore was generated (Figure 4, in the middle), showing a hydrogen‐bond donor on the amine side chain group of Gln42, four hydrogen‐bond acceptors on the side chain hydroxyl of Tyr41, backbone carbonyl of Lys353, carboxylic groups of Glu37 and Asp38, and a negative ionisable feature on Asp38 side chain of ACE2 PD.
The comparison of the two pharmacophore maps showed that both PDB complexes shared two comparable features on Lys353 and Glu37, while the features corresponding to the Tyr41 side chain hydroxyl were different. In PDB 6M17, the oxygen atom of the hydroxyl group formed a H‐bond to Asn501 side chain of S protein, while in PDB 6M0J, the hydrogen of the same hydroxyl accepted a H‐bond from Thr500 side chain. Therefore, the same hydroxyl group of Tyr41 side chain could act as H‐bond acceptor or donor. In light of these findings, the information from both pharmacophores were considered equally important, and a shared pharmacophore was created (Figure 4, on the right), including overall seven features from both PDB complexes.
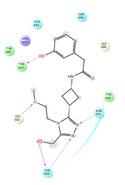
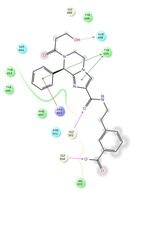
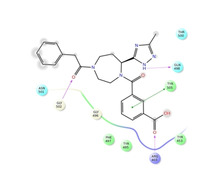
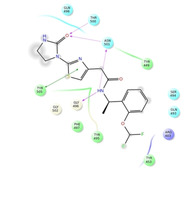
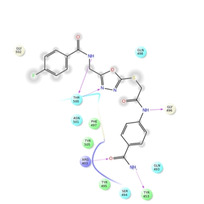
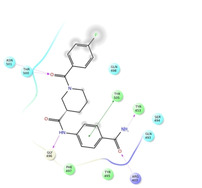
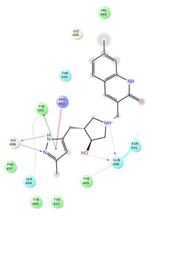
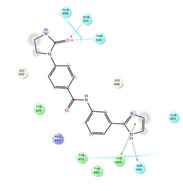
Indeed, the high number of features could be too strict for this preliminary virtual screening, thus limiting the opportunity to identify potentially promising compounds. For this reason, the shared pharmacophore was modified according to alanine scanning ΔΔGaffinity values, taking into account that Glu37 and Asp38 were the less valued hot spots compared to Tyr41, Gln42 and Lys353. Therefore, the negative ionisable feature corresponding to Asp38 was removed and two H‐bond acceptor features corresponding to Glu37 and Asp38 were marked as optional, i. e. they were considered less important for screening purposes. Then, pharmacophore screenings were run, where no omitted features were permitted. For MolPort library, 19 molecules were retrieved from the initial 1,000, while 22 compounds were obtained from the initial 1,000 PPI library molecules. Some virtual hit molecules were nucleoside analogues as a consequence of the highly hydrophilic nature of the binding side. However, these molecules were discarded from the overall selection of the consensus molecules, as we considered these not suitable to enter hit‐to‐lead optimization from a drug discovery perspective. Finally, 8 compounds were selected as the most promising ones taking into consideration MM‐GBSA and chemical diversity. In Table 2 we report 2D structures of these 8 molecules including the established interactions with SARS‐CoV‐2 crucial amino acids, while Table S5 shows structures and some physicochemical properties of the overall 32 identified compounds. These molecules could represent putative modulators that can provide crucial information about the druggability of N‐terminal region. These overall 32 molecules would require further validation via biophysical or biological wet lab screening before entering a hit optimisation programme towards novel anti‐COVID‐19 therapeutics and they will be available together with the related SDF files on request by interested research groups.
Table 2.
Ligand interaction diagrams of the most promising compounds. Among the 32 consensus molecules, 8 compounds were further selected according to their MM‐GBSA and chemical diversity.
|
SELECTED COMPOUNDS | |
|---|---|
|
|
|
|
Spike_RM03 ΔΔGbinding=−58.259 kcal/mol |
Spike_RM14 ΔΔGbinding=−56.750 kcal/mol |
|
|
|
|
Spike_RM15 ΔΔGbinding=−53.986 kcal/mol |
Spike_RM25 ΔΔGbinding=−51.707 kcal/mol |
|
|
|
|
Spike_RM30 ΔΔGbinding=−51.658 kcal/mol |
Spike_RM29 ΔΔGbinding=−50.333 kcal/mol |
|
|
|
|
Spike_RM09 ΔΔGbinding=−49.420 kcal/mol |
Spike_RM24 ΔΔGbinding=−48.338 kcal/mol |
Conclusion
Our investigational analysis aimed at assessing the druggability of the S glycoprotein RBD‐ACE2 PPI to deliver potential hit molecules to enter drug discovery program aimed at finding drugs against the COVID‐19 pandemic. While targeting PPI with small molecule remains a challenge in drug discovery, our studies suggest that the S RBD‐ACE 2 alpha helix interface represents a non‐canonical PPI. Using orthogonal computational techniques and investigating the S‐ACE2 interaction interface, we propose the N‐terminal region of S glycoprotein RBD as a druggable hot spots to be targeted as a therapeutic intervention point that may interfere with the host‐guest recognition mechanism. Based on the preliminary computational studies and literature evidences, supervised virtual screening models were built and used in a consensus manner. The entire workflow yielded a list of potential ligand binders waiting to be validated in biochemical, biophysical or cellular screening. The total list of identified virtual hits will be made available to the scientific community for screening purposes. It remains to be clarified if small‐molecules targeting the S glycoprotein RBD‐ACE2 interaction represents a meaningful approach to block COVID‐19 infection or reduce its systemic viral loading.
Computational Methods
Computational alanine scanning on SARS‐CoV‐2 – ACE2 interaction interface
In order to perform the computational alanine scanning on both PDB structures of ACE2 PD‐SARS‐CoV‐2 RBD (PDB IDs: 6M17 and 6M0J) the protein complexes were first optimised using “Protein preparation wizard”74 tool (Schrödinger Release 2018–3).72, 73, 75 Bond orders were assigned into the protein structures, missing hydrogens were added, water molecules beyond 5.0 Å from het groups were deleted, and het states were generated at pH 7.4±0.2 using Epik.76, 77 Then H‐bonds assignment within protein structures were optimised using PROPKA78 at pH 7.4. The residues of both PDB complexes were imported into the “Residue scanning” tool69 released with Biologics suite to perform computational alanine scanning. The calculation type was flagged on “stability and affinity” to retrieve the ΔΔGaffinity for each mutated residue. Only the amino acids of ACE2 PD and SARS‐CoV‐2 RBD involved in the interaction interface were selected for mutating to alanine, i. e. residues in positions 21 to 48, 79 to 83, and 352 to 357 for ACE2 peptidase domain; and amino acids in positions 416, 417, 455, 456, 475 to 478 and 486 to 505 for S glycoprotein instead. Furthermore, the side‐chains of the mutated residues were refined including a backbone minimization.
MD simulations on SARS‐CoV‐2 Spike protein in complex with ACE2
The optimised PDB structures (6M17 and 6M0J) used to perform the computational alanine scanning were also considered for Molecular Dynamics simulations using Desmond (released version 11.6).70 Firstly, for both protein‐protein complexes, a system was built using “System builder” tool. TIP3P79 was chosen to simulate water solvent model with an orthorhombic box shape to include the system. The simulation box size was calculated by using a buffer with 10 Å of distance between the solute structures and the simulation box boundary. In order to neutralize the system 14 Na+ ions were added into the 6M17 simulation box and 22 Na+ into 6M0J MD system, and the applied force field was OPLS3.80 Then, the two systems were submitted for running MD simulations using the “Molecular Dynamics” tool. The simulation time was 200 nanoseconds for each system with a trajectory recording interval of 200 picoseconds, and the simulation seed was randomised. Finally, number of atoms (144,165 for PDB 6M17 and 105,302 for PDB 6M0J), pressure (1.01325 bar) and temperature (300 K) were maintained constant during the whole simulation. Then, the MD outputs were processed to identify the most abundant and frequent interactions between ACE2 PD and SARS‐CoV‐2 RBD. Indeed, the trajectories were clustered to get five clusters for PDB 6M17 and ten clusters for PDB 6M0J. The backbone was chosen to set the RMSD matrix and frequency of clustering was 10, setting average as the hierarchical cluster linkage method. Only the frames corresponding to the stable portion of RMSD plot were analysed to retrieve the key interactions between protein partners.
Virtual compound libraries preparation for molecular docking screening
In order to perform a massive molecular docking screening at ACE2‐S protein interaction interface and to identify putative modulators of this PPI, several compound libraries were downloaded and prepared for the calculations. For this purpose, Asinex, ChemDiv, Enamine, and Life Chemicals PPI‐targeted libraries were considered together with all MolPort compound database. The virtual libraries were filtered through KNIME platform81 using the SMART alerts, in order to delete those compounds containing carcinogenic, mutagenic, chelating, reactive, unstable, toxic and skin sensitising groups,82 thus getting overall about 1.8 millions of molecules. Next, all the compounds were prepared using “LigPrep” tool of Schrödinger suite. The selected force field was OPLS380 and the protonation states were generated at pH 7.4±0.2 using Epik.76 The molecules were desalted and tautomers were generated retaining compound specific chirality. Finally, no more than 32 different conformations were generated per ligand.
High‐throughput virtual screening
At the same time, three different docking grids were built, considering the three above mentioned interaction regions at ACE2 PD‐SARS‐CoV‐2 RBD interface. The grid centroids were defined selecting the key amino acids according to the previous collected data from literature and computational results analysis. In detail, for N‐terminal region Gly496, Gln498, Thr500, Asn501, Gly502, Tyr505 were selected to define the docking grid, while residues Lys417, Leu455, Phe456, Gln493 for the central region and Phe486, Asn487, Tyr489 to create the docking grid at the C‐terminal portion. Each grid was generated using the “Receptor grid generation” tool of Schrödinger suite, setting a Van der Waals (VdW) radius scaling factor of 1.0 for non‐polar atom with a partial charge cut‐off of 0.25. Then, these grids were used to perform molecular docking screenings applying a flexible protocol and the VdW radii of ligand non‐polar atoms were scaled at 0.80 with partial atomic charge cut‐off 0.15. All the mentioned libraries were docked on the three grids, in order to explore docking poses of ligands on the three interface regions. In details, due to the large number of molecules for the two compound libraries, high‐throughput virtual screening workflows were run. The related first prioritised 10,000 compounds were re‐docked using docking SP. The outputs were analysed and, especially for N‐terminal region, the most promising molecules were selected considering the main interactions established with the S protein crucial amino acids and the docking score values.
Pharmacophore screening of selected compounds from docking screening
In order to perform pharmacophore screenings, the selected molecules from MolPort and PPI libraries were optimised using the tool “Create screening database” of LigandScout software (version 4.3 – released by Inte:Ligand GmbH),83, 84, 85, 86 specifying “iCon Best”87 as conformer generation type to create high‐quality ligand conformations. The maximum number of conformations per compound was 200 and all other default settings were applied. After all compounds were prepared, it was necessary to create the pharmacophore map for the screenings. For this purpose, PDB 6M17 and PDB 6M0J were used to generate two pharmacophore maps. Chain B of PDB 6M17 and chain A of PDB 6M0J corresponding to ACE2 were converted into ligands, in order to allow the software to identify a ligand out of the two proteins. Thus, two pharmacophore maps were generated using the “Create pharmacophore” button, and they were transferred to the “Alignment perspective” window. The two pharmacophores were cleaned out deleting those features not involved into the N‐terminal region, getting three features for PDB 6M17 (Figure 4, on the left) and five features for PDB 6M0J (Figure 4, in the middle). All hydrogen‐bond vectors were converted into features to increase the ligand‐matching capacity of pharmacophores. Then, a shared pharmacophore was generated, using the tool “Generate shared feature pharmacophore”, setting 6M0J pharmacophore as reference. The result was a pharmacophore map including overall seven features (Figure 4, on the right), where a negative ionisable feature on Asp38 was deleted and the two H‐bond acceptor features corresponding to Glu37 and Asp38 side chains were converted in optional. This modified pharmacophore map was used to perform screening on the compound libraries previously generated. For this purpose, the used scoring function was “pharmacophore‐fit”, the screening mode was “match all query features”, and for the retrieval mode “get best matching conformation” was selected. Finally, for the compound libraries the maximum number of permitted omitted features was 0. The pharmacophore screenings retrieved 19 molecules of the initial 1,000 MolPort chemical entities and 22 molecules of 1,000 starting PPI ligands.
Conflict of interest
The authors declare no conflict of interest.
Supporting information
As a service to our authors and readers, this journal provides supporting information supplied by the authors. Such materials are peer reviewed and may be re‐organized for online delivery, but are not copy‐edited or typeset. Technical support issues arising from supporting information (other than missing files) should be addressed to the authors.
Supplementary
M. R. Gulotta, J. Lombino, U. Perricone, G. De Simone, N. Mekni, M. De Rosa, P. Diana, A. Padova, ChemMedChem 2020, 15, 1921.
Contributor Information
Maria Rita Gulotta, Email: mrgulotta@fondazionerimed.com.
Dr. Ugo Perricone, Email: uperricone@fondazionerimed.com.
References
- 1. Zhu N., Zhang D., Wang W., Li X., Yang B., Song J., Zhao X., Huang B., Shi W., Lu R., et al., N. Engl. J. Med. 2020, 382, 727–733. [DOI] [PMC free article] [PubMed] [Google Scholar]
- 2.“Coronavirus statics,” can be found under https://www.worldometers.info/coronavirus/, 2020.
- 3. Zhou P., Lou Yang X., Wang X. G., Hu B., Zhang L., Zhang W., Si H. R., Zhu Y., Li B., Huang C. L., et al., Nature 2020, 579, 270–273. [DOI] [PMC free article] [PubMed] [Google Scholar]
- 4. Liu C., Zhou Q., Li Y., Garner L. V., Watkins S. P., Carter L. J., Smoot J., Gregg A. C., Daniels A. D., Jervey S., et al., ACS Cent. Sci. 2020, 6, 315–331. [DOI] [PMC free article] [PubMed] [Google Scholar]
- 5. Drosten C., Günther S., Preiser W., Van der Werf S., Brodt H. R., Becker S., Rabenau H., Panning M., Kolesnikova L., Fouchier R. A. M., et al., N. Engl. J. Med. 2003, 348, 1967–1976. [DOI] [PubMed] [Google Scholar]
- 6. Hu B., Zeng L.-P., Yang X.-L., Ge X.-Y., Zhang W., Li B., Xie J.-Z., Shen X.-R., Zhang Y.-Z., Wang N., et al., PLoS Pathog. 2017, 13, 66–98. [DOI] [PMC free article] [PubMed] [Google Scholar]
- 7. Zaki A. M., Van Boheemen S., Bestebroer T. M., Osterhaus A. D. M. E., Fouchier R. A. M., N. Engl. J. Med. 2012, 367, 1814–1820. [DOI] [PubMed] [Google Scholar]
- 8. Sabir J. S. M., Lam T. T. Y., Ahmed M. M. M., Li L., Shen Y., Abo-Aba S. E. M., Qureshi M. I., Abu-Zeid M., Zhang Y., Khiyami M. A., et al., Science 2016, 351, 81–84. [DOI] [PubMed] [Google Scholar]
- 9. Yang X.-L., Hu B., Wang B., Wang M.-N., Zhang Q., Zhang W., Wu L.-J., Ge X.-Y., Zhang Y.-Z., Daszak P., et al., J. Virol. 2016, 90, 3253 LP – 3256. [DOI] [PMC free article] [PubMed] [Google Scholar]
- 10. Ge X. Y., Li J. L., Lou Yang X., Chmura A. A., Zhu G., Epstein J. H., Mazet J. K., Hu B., Zhang W., Peng C., et al., Nature 2013, 503, 535–538. [DOI] [PMC free article] [PubMed] [Google Scholar]
- 11. Haagmans B. L., Al Dhahiry S. H. S., Reusken C. B. E. M., Raj V. S., Galiano M., Myers R., Godeke G. J., Jonges M., Farag E., Diab A., et al., Lancet Infect. Dis. 2014, 14, 140–145. [DOI] [PMC free article] [PubMed] [Google Scholar]
- 12. Li F., Annu. Rev. Virol. 2016, 3, 237–261. [DOI] [PMC free article] [PubMed] [Google Scholar]
- 13. Su S., Wong G., Shi W., Liu J., Lai A. C. K., Zhou J., Liu W., Bi Y., Gao G. F., Trends Microbiol. 2016, 24, 490–502. [DOI] [PMC free article] [PubMed] [Google Scholar]
- 14. Bosch B. J., van der Zee R., de Haan C. A. M., Rottier P. J. M., J. Virol. 2003, 77, 8801 LP – 8811. [DOI] [PMC free article] [PubMed] [Google Scholar]
- 15. Gallagher T. M., Buchmeier M. J., Virology 2001, 279, 371–374. [DOI] [PMC free article] [PubMed] [Google Scholar]
- 16. Millet J. K., Whittaker G. R., Virus Res. 2015, 202, 120–134. [DOI] [PMC free article] [PubMed] [Google Scholar]
- 17. Belouzard S., Chu V. C., Whittaker G. R., Proc. Mont. Acad. Sci. 2009, 106, 5871–5876. [DOI] [PMC free article] [PubMed] [Google Scholar]
- 18. Heald-Sargent T., Gallagher T., Viruses 2012, 4, 557–580. [DOI] [PMC free article] [PubMed] [Google Scholar]
- 19. Tortorici M. A., Veesler D., Adv. Virus Res. 2019, 105, 93–116. [DOI] [PMC free article] [PubMed] [Google Scholar]
- 20. Xu H., Zhong L., Deng J., Peng J., Dan H., Zeng X., Li T., Chen Q., Int. J. Oral Sci. 2020, 12, 1–5. [DOI] [PMC free article] [PubMed] [Google Scholar]
- 21. Zou X., Chen K., Zou J., Han P., Hao J., Han Z., Front. Med. 2020, 14, 185–192. [DOI] [PMC free article] [PubMed] [Google Scholar]
- 22. Yan R., Zhang Y., Li Y., Xia L., Guo Y., Zhou Q., Science 2020, 2762, 1–10. [Google Scholar]
- 23. Prabakaran P., Xiao X., Dimitrov D. S., Biochem. Biophys. Res. Commun. 2004, 314, 235–241. [DOI] [PMC free article] [PubMed] [Google Scholar]
- 24. Li W., Zhang C., Sui J., Kuhn J. H., Moore M. J., Luo S., Wong S.-K., Huang I.-C., Xu K., Vasilieva N., et al., EMBO J. 2005, 24, 1634–1643. [DOI] [PMC free article] [PubMed] [Google Scholar]
- 25. Wan Y., Shang J., Graham R., Baric R. S., Li F., J. Virol. 2020, 1–9. [DOI] [PMC free article] [PubMed] [Google Scholar]
- 26. Masters S. L., Dunne A., Subramanian S. L., Hull R. L., Tannahill G. M., Sharp F. A., Becker C., Franchi L., Yoshihara E., Chen Z., et al., Nat. Immunol. 2010, 11, 897–904. [DOI] [PMC free article] [PubMed] [Google Scholar]
- 27. Wu K., Chen L., Peng G., Zhou W., Pennell C. A., Mansky L. M., Geraghty R. J., Li F., J. Virol. 2011, 85, 5331–7. [DOI] [PMC free article] [PubMed] [Google Scholar]
- 28. Xiong X., Tortorici M. A., Snijder J., Yoshioka C., Walls A. C., Li W., McGuire A. T., Rey F. A., Bosch B.-J., Veesler D., J. Virol. 2018, 92, 1–16. [DOI] [PMC free article] [PubMed] [Google Scholar]
- 29. Watanabe Y., Allen J. D., Wrapp D., McLellan J. S., Crispin M., Science 2020, eabb9983. [DOI] [PMC free article] [PubMed] [Google Scholar]
- 30. Xu D., Zhang Y., Proteins Struct. Funct. Bioinforma. 2012, n/a–n/a. [Google Scholar]
- 31. Gurwitz D., Drug Dev. Res. 2020, ddr.21656. [Google Scholar]
- 32. Pandey P., Rane J. S., Chatterjee A., Kumar A., Khan R., Prakash A., Ray S., J. Biomol. Struct. Dyn. 2020, 1–11. [Google Scholar]
- 33. Zhou Y., Hou Y., Shen J., Huang Y., Martin W., Cheng F., Cell Discov. 2020, 6, 14. [DOI] [PMC free article] [PubMed] [Google Scholar]
- 34. Li G., De Clercq E., Nat. Rev. Drug Discovery 2020, 19, 149–150. [DOI] [PubMed] [Google Scholar]
- 35. Wu R., Wang L., Kuo H.-C. D., Shannar A., Peter R., Chou P. J., Li S., Hudlikar R., Liu X., Liu Z., et al., Curr. Pharmacol. Reports 2020, DOI 10.1007/s40495-020-00216–7. [DOI] [PMC free article] [PubMed] [Google Scholar]
- 36. Martinez M. A., Antimicrob. Agents Chemother. 2020, 64, DOI 10.1128/AAC.00399–20. [Google Scholar]
- 37. Zhou G., Zhao Q., Int. J. Biol. Sci. 2020, 16, 1718–1723. [DOI] [PMC free article] [PubMed] [Google Scholar]
- 38. Dai W., Zhang B., Su H., Li J., Zhao Y., Xie X., Jin Z., Liu F., Li C., Li Y., et al., Science 2020, eabb4489. [Google Scholar]
- 39. Wu C., Liu Y., Yang Y., Zhang P., Zhong W., Wang Y., Wang Q., Xu Y., Li M., Li X., et al., Acta Pharm. Sin. B 2020, 10, 766–788. [DOI] [PMC free article] [PubMed] [Google Scholar]
- 40. Ekins S., Mottin M., Ramos P. R. P. S., Sousa B. K. P., Neves B. J., Foil D. H., Zorn K. M., Braga R. C., Coffee M., Southan C., et al., Drug Discovery Today 2020, 25, 928–941. [DOI] [PMC free article] [PubMed] [Google Scholar]
- 41. Walls A. C., Tortorici M. A., Frenz B., Snijder J., Li W., Rey F. A., DiMaio F., Bosch B. J., Veesler D., Nat. Struct. Mol. Biol. 2016, 23, 899–905. [DOI] [PMC free article] [PubMed] [Google Scholar]
- 42. Yu X., Zhang S., Jiang L., Cui Y., Li D., Wang D., Wang N., Fu L., Shi X., Li Z., et al., Sci. Rep. 2015, 5, 1–11. [DOI] [PMC free article] [PubMed] [Google Scholar]
- 43. Jiang L., Wang N., Zuo T., Shi X., Poon K. M. V., Wu Y., Gao F., Li D., Wang R., Guo J., et al., Sci. Transl. Med. 2014, 6, 1–10. [DOI] [PubMed] [Google Scholar]
- 44. Ying T., Prabakaran P., Du L., Shi W., Feng Y., Wang Y., Wang L., Li W., Jiang S., Dimitrov D. S., et al., Nat. Commun. 2015, 6, 8223. [DOI] [PMC free article] [PubMed] [Google Scholar]
- 45. Elshabrawy H. A., Coughlin M. M., Baker S. C., Prabhakar B. S., PLoS One 2012, 7, 1–9. [DOI] [PMC free article] [PubMed] [Google Scholar]
- 46. Li Y., Wan Y., Liu P., Zhao J., Lu G., Qi J., Wang Q., Lu X., Wu Y., Liu W., et al., Cell Res. 2015, 25, 1237–1249. [DOI] [PMC free article] [PubMed] [Google Scholar]
- 47. Du L., He Y., Zhou Y., Liu S., Zheng B. J., Jiang S., Nat. Rev. Microbiol. 2009, 7, 226–236. [DOI] [PMC free article] [PubMed] [Google Scholar]
- 48. Traggiai E., Becker S., Subbarao K., Kolesnikova L., Uematsu Y., Gismondo M. R., Murphy B. R., Rappuoli R., Lanzavecchia A., Nat. Med. 2004, 10, 871–875. [DOI] [PMC free article] [PubMed] [Google Scholar]
- 49. Corti D., Zhao J., Pedotti M., Simonelli L., Agnihothram S., Fett C., Fernandez-Rodriguez B., Foglierini M., Agatic G., Vanzetta F., et al., Proc. Natl. Acad. Sci. USA 2015, 112, 10473–10478. [DOI] [PMC free article] [PubMed] [Google Scholar]
- 50. Walls A. C., Xiong X., Park Y. J., Tortorici M. A., Snijder J., Quispe J., Cameroni E., Gopal R., Dai M., Lanzavecchia A., et al., Cell 2019, 176, 1026–1039. [DOI] [PMC free article] [PubMed] [Google Scholar]
- 51. Zhou Y., Simmons G., Expert Rev. Anti-Infect. Ther. 2012, 10, 1129–1138. [DOI] [PMC free article] [PubMed] [Google Scholar]
- 52. Chanphai P., Bekale L., Tajmir-Riahi H. A., Eur. Polym. J. 2015, 67, 224–231. [Google Scholar]
- 53. Bettinetti L., Magnani M., Padova A., in Disrupt. Protein-Protein Interfaces, Springer Berlin Heidelberg, Berlin, Heidelberg, 2013, pp. 1–29. [Google Scholar]
- 54. Mustafa S., Balkhy H., Gabere M. N., J. Infect. Public Health 2018, 11, 9–17. [DOI] [PMC free article] [PubMed] [Google Scholar]
- 55. Amanat F., Krammer F., Immunity 2020, 52, 583–589. [DOI] [PMC free article] [PubMed] [Google Scholar]
- 56. Lan J., Ge J., Yu J., Shan S., Zhou H., Fan S., Zhang Q., Shi X., Wang Q., Zhang L., et al., Nature 2020, 581, 215–220. [DOI] [PubMed] [Google Scholar]
- 57. Li F., Li W., Farzan M., Harrison S. C., Science 2005, 309, 1864–8. [DOI] [PubMed] [Google Scholar]
- 58. Walls A. C., Park Y.-J., Tortorici M. A., Wall A., McGuire A. T., Veesler D., Cell 2020, 1–12. [DOI] [PMC free article] [PubMed] [Google Scholar]
- 59. Kirchdoerfer R. N., Wang N., Pallesen J., Wrapp D., Turner H. L., Cottrell C. A., Corbett K. S., Graham B. S., McLellan J. S., Ward A. B., Sci. Rep. 2018, 8, 1–11. [DOI] [PMC free article] [PubMed] [Google Scholar]
- 60.“Molecular Dynamics Simulations Related to SARS-CoV-2,” can be found under https://www.deshawresearch.com/downloads/download_trajectory_sarscov2.cgi/, 2020.
- 61. Yan R., Zhang Y., Li Y., Xia L., Zhou Q., bioRxiv 2020, 2020.02.17.951848. [Google Scholar]
- 62. Mekni N., De Rosa M., Cipollina C., Gulotta M. R., De Simone G., Lombino J., Padova A., Perricone U., Int. J. Mol. Sci. 2019, 20, 4974. [DOI] [PMC free article] [PubMed] [Google Scholar]
- 63. Perricone U., Gulotta M. R., Lombino J., Parrino B., Cascioferro S., Diana P., Cirrincione G., Padova A., MedChemComm 2018, 9, 920–936. [DOI] [PMC free article] [PubMed] [Google Scholar]
- 64. Cukuroglu E., Engin H. B., Gursoy A., Keskin O., Prog. Biophys. Mol. Biol. 2014, 116, 165–173. [DOI] [PubMed] [Google Scholar]
- 65. Metz A., Ciglia E., Gohlke H., Curr. Pharm. Des. 2012, 18, 4630–4647. [DOI] [PubMed] [Google Scholar]
- 66. Kortemme T., Kim D. E., Baker D., Sci. Signaling 2004, 2004, pl2–pl2. [DOI] [PubMed] [Google Scholar]
- 67. Zerbe B. S., Hall D. R., Vajda S., Whitty A., Kozakov D., J. Chem. Inf. Model. 2012, 52, 2236–2244. [DOI] [PMC free article] [PubMed] [Google Scholar]
- 68. Kortemme T., Baker D., Proc. Natl. Acad. Sci. USA 2002, 99, 14116–21. [DOI] [PMC free article] [PubMed] [Google Scholar]
- 69. Beard H., Cholleti A., Pearlman D., Sherman W., Loving K. A., PLoS One 2013, 8, e82849. [DOI] [PMC free article] [PubMed] [Google Scholar]
- 70.K. J. Bowers, D. E. Chow, H. Xu, R. O. Dror, M. P. Eastwood, B. A. Gregersen, J. L. Klepeis, I. Kolossvary, M. A. Moraes, F. D. Sacerdoti, et al., in ACM/IEEE SC 2006 Conf., IEEE, 2006, pp. 43–43.
- 71. Norel R., Lin S. L., Wolfson H. J., Nussinov R., Biopolymers 1994, 34, 933–940. [DOI] [PubMed] [Google Scholar]
- 72. Friesner R. A., Banks J. L., Murphy R. B., Halgren T. A., Klicic J. J., Mainz D. T., Repasky M. P., Knoll E. H., Shelley M., Perry J. K., et al., J. Med. Chem. 2004, 47, 1739–1749. [DOI] [PubMed] [Google Scholar]
- 73. Halgren T. A., Murphy R. B., Friesner R. A., Beard H. S., Frye L. L., Pollard W. T., Banks J. L., J. Med. Chem. 2004, 47, 1750–1759. [DOI] [PubMed] [Google Scholar]
- 74. Madhavi Sastry G., Adzhigirey M., Day T., Annabhimoju R., Sherman W., J. Comput.-Aided Mol. Des. 2013, 27, 221–234. [DOI] [PubMed] [Google Scholar]
- 75. Friesner R. A., Murphy R. B., Repasky M. P., Frye L. L., Greenwood J. R., Halgren T. A., Sanschagrin P. C., Mainz D. T., J. Med. Chem. 2006, 49, 6177–6196. [DOI] [PubMed] [Google Scholar]
- 76. Shelley J. C., Cholleti A., Frye L. L., Greenwood J. R., Timlin M. R., Uchimaya M., J. Comput.-Aided Mol. Des. 2007, 21, 681–691. [DOI] [PubMed] [Google Scholar]
- 77. Greenwood J. R., Calkins D., Sullivan A. P., Shelley J. C., J. Comput.-Aided Mol. Des. 2010, 24, 591–604. [DOI] [PubMed] [Google Scholar]
- 78. Olsson M. H. M., Søndergaard C. R., Rostkowski M., Jensen J. H., J. Chem. Theory Comput. 2011, 7, 525–537. [DOI] [PubMed] [Google Scholar]
- 79. Mark P., Nilsson L., J. Phys. Chem. A 2001, 105, 9954–9960. [Google Scholar]
- 80. Harder E., Damm W., Maple J., Wu C., Reboul M., Xiang J. Y., Wang L., Lupyan D., Dahlgren M. K., Knight J. L., et al., J. Chem. Theory Comput. 2016, 12, 281–296. [DOI] [PubMed] [Google Scholar]
- 81.M. R. Berthold, N. Cebron, F. Dill, T. R. Gabriel, T. Kötter, T. Meinl, P. Ohl, C. Sieb, K. Thiel, B. Wiswedel, 2008, pp. 319–326.
- 82. Sushko I., Salmina E., Potemkin V. A., Poda G., Tetko I. V., J. Chem. Inf. Model. 2012, 52, 2310–2316. [DOI] [PMC free article] [PubMed] [Google Scholar]
- 83. Wolber G., Langer T., J. Chem. Inf. Model. 2005, 45, 160–169. [DOI] [PubMed] [Google Scholar]
- 84. Steindl T. M., Schuster D., Wolber G., Laggner C., Langer T., J. Comput.-Aided Mol. Des. 2007, 20, 703–715. [DOI] [PubMed] [Google Scholar]
- 85. Steindl T. M., Schuster D., Laggner C., Chuang K., Hoffmann R. D., Langer T., J. Chem. Inf. Model. 2007, 47, 563–571. [DOI] [PubMed] [Google Scholar]
- 86. Krovat E. M., Frühwirth K. H., Langer T., J. Chem. Inf. Model. 2005, 45, 146–159. [DOI] [PubMed] [Google Scholar]
- 87. Poli G., Seidel T., Langer T., Front. Chem. 2018, 6. [DOI] [PMC free article] [PubMed] [Google Scholar]
Associated Data
This section collects any data citations, data availability statements, or supplementary materials included in this article.
Supplementary Materials
As a service to our authors and readers, this journal provides supporting information supplied by the authors. Such materials are peer reviewed and may be re‐organized for online delivery, but are not copy‐edited or typeset. Technical support issues arising from supporting information (other than missing files) should be addressed to the authors.
Supplementary


