

Abstract
Sign-tracking behavior, in which animals interact with a cue that predicts reward, provides an example of how incentive salience can be attributed to cues and elicit motivation. The nucleus accumbens (NAc) and ventral pallidum (VP) are two regions involved in cue-driven motivation. The VP, and NAc subregions including the medial shell and core, are critical for sign-tracking. Further, connections between the medial shell and VP are known to participate in sign-tracking and other motivated behaviors. The NAc lateral shell (NAcLSh) is a distinct and understudied subdivision of the NAc, and its contribution to the process by which reward cues acquire value remains unclear. The NAcLSh has been implicated in reward-directed behavior, and has reciprocal connections with the VP, suggesting that NAcLSh and VP interactions could be important mechanisms for incentive salience. Here, we use DREADDs (Designer Receptors Exclusively Activated by Designer Drugs) and an intersectional viral delivery strategy to produce a biased inhibition of NAcLSh neurons projecting to the VP, and vice versa. We find that disruption of connections from NAcLSh to VP reduces sign-tracking behavior while not affecting consumption of food rewards. In contrast, VP to NAcLSh disruption affected neither sign-tracking nor reward consumption, but did produce a greater shift in animals’ behavior more towards the reward source when it was available. These findings indicate that the NAcLSh → VP pathway plays an important role in guiding animals towards reward cues, while VP → NAcLSh back-projections may not and may instead bias motivated behavior towards rewards.
Keywords: Sign-tracking, Reward, Incentive salience, Nucleus accumbens (shell), Ventral pallidum
1. Introduction
Sign-tracking, or autoshaping, includes a behavioral phenomenon where animals interact with a conditioned stimulus (CS+) that predicts an unconditioned stimulus (US), like a reward, even though the US delivery is not contingent on this behavior (Brown & Jenkins, 1968; Flagel & Robinson, 2017; Boakes, 1977). Sign-tracking reflects the attribution of incentive salience to the CS+ and can be highly sensitive to changes in motivational state and cue-reward relationships (Jenkins & Moore, 1973; Robinson & Berridge, 2013; Berridge & Robinson, 2003; Berridge, 2004; Chang & Smith, 2016; Smedley and Smith 2018a, 2018b; Flagel & Robinson, 2017). The nucleus accumbens (NAc) and ventral pallidum (VP), two reciprocally connected limbic regions, have long been implicated in motivated behaviors directed towards CS+s and their paired rewards (Smith, Tindell, Aldridge, & Berridge, 2009; Root, Melendez, Zaborszky, & Napier, 2015; Mogenson et al., 1980). For example, manipulations to decrease the function of the NAc can result in reduced sign-tracking behaviors (Chang, Wheeler, & Holland, 2012; Chang & Holland, 2013; Cardinal et al., 2002). Phasic activity patterns of NAc neurons, and release patterns of neurotransmitter input, can also represent the reward-related value of CS+ cues including those that evoke sign-tracking behavior (Day & Carelli, 2007; Day, Wheeler, Roitman, & Carelli, 2006; Batten, Pomerleau, Quintero, Gerhardt, & Beckmann, 2018; Flagel et al., 2011; Singer et al., 2016; Wan and Peoples, 2008; Ambroggi, Ghazizadeh, Nicola, & Fields, 2011; Saunders & Robinson, 2012). VP neuronal activity is similarly modulated by CS+ cues that are imbued with incentive salience (Tindell et al., 2005; Tindell et al., 2009; Smith, Berridge, & Aldridge, 2011; Richard et al., 2016; Ahrens, Meyer, Ferguson, Robinson, & Aldridge, 2016; Ahrens, Ferguson, Robinson, & Aldridge, 2018). Inhibition of the VP also disrupts sign-tracking behavior and does so in a manner not attributable to changes in motor expression or the value of the reward (Chang, Todd, Bucci, & Smith, 2015).
The contributions of different anatomically organized projections between the specific subregions of the NAc and VP to incentive salience remains unclear. The NAc can be divided into core and shell regions, and the shell further subdivided into medial and lateral segments (Zahm, 1999; Heimer et al., 1997; Zahm, 2000; van Dongen et al., 2005; Yang et al., 2018; Zahm & Brog, 1992; Kuo & Chang, 1992; Zaborsky et al., 1985). There is evidence that connections between the medial NAc shell and VP play an important role in forms of appetitive motivation including cue-triggered reward seeking, reward consumption, and sign-tracking (Stratford & Kelley, 1997, Smith & Berridge, 2007, Leung & Balleine, 2015, Chang, Todd, & Smith, 2018, Smith et al., 2011).
In contrast, roles for connections between the lateral NAc shell (NAcLSh) and VP remain highly understudied. The NAcLSh itself participates in positive motivation (Zhang & Kelley, 2000; Lammel et al., 2012; Mahler & Aston-Jones, 2012; Yang et al., 2018). However, it is distinct from medial NAc shell in its anatomical connectivity (Zahm & Brog, 1992, Deutch & Cameron, 1993). For example, the NAcLSh has reciprocal connections with VP in a more mid-lateral VP zone that is partly dissociable from medial NAc shell-VP connectivity (Brog, Salyapongse, Deutch, & Zahm, 1993, Zahm, 2000; Churchill & Kalivas, 1994). NAcLSh is also connected with areas linked with appetitive behavior including the ventral tegmental area, substantia nigra pars compacta, lateral hypothalamus, and extended amygdala (Yang et al., 2018, Heimer, Zahm, Churchill, Kalivas, & Wohltmann, 1991, Groenewegen & Russchen, 1984, Brog et al., 1993). Thus, anatomically, both NAcLSh and VP structures are poised to interact with one another reciprocally and to affect a broader neural network that includes areas implicated in motivation and behavioral control.
To begin addressing the role of this reciprocal connection in motivation, we investigated the effect of biasing chemogenetic inhibition of VP projections to the NAcLSh (VP → NAcLSh), or NAcLSh projections to the VP (NAcLSh → VP), in a Pavlovian conditioning procedure for food and on the primary motivation to eat food. We found that NAcLSh → VP selectively reduced sign-tracking, that VP → NAcLSh inhibition selectively increased goal-approach that also occurred during the cues, and that neither pathway manipulation detectably affected free feeding behavior. These results highlight a preferential role for the NAcLSh → VP pathway in regulating the motivational attraction to reward-paired cues. Moreover, the functional dissociation between the pathway manipulations indicates that the NAcLSh → VP conveys information to the VP for the regulation of reward cue attraction that could be insensitive to the integrity of information transferred back from the VP.
2. Materials and methods
Subjects.
Experimentally naïve male Long Evans rats (arrival weight 250–300 g) were obtained from Charles River (n = 52; Charles River, Indianapolis, IN, USA). Rats were single housed in ventilated plastic cages in a climate-controlled colony room set to a 12 h light/dark cycle (lights on at 7:00 A.M.). Experiments were conducted during the light cycle. Food and water were available ad libitum until 7 days before magazine training, at which point weight was restricted to 85% of ad libitum weight prior to testing. Restriction was maintained throughout the experiment. For restriction, rats were provided with 5–12 g of standard chow (Harlan Teklad 2014) and free access to water after each testing session. All procedures were approved by the Dartmouth Institutional College Animal Care and Use Committee.
Surgical procedures.
Rats were anesthetized with isoflurane gas and placed in a stereotaxic apparatus (Stoelting, Kiel, WI, USA). Surgery was conducted under aseptic conditions. A 5 μl, 33-gauge beveled needle-tipped syringe (World Precision Instruments, Sarasota, FL, USA) was lowered to the bilateral target sites and allowed to rest for 3 min. Viral vectors were infused at a rate of 0.15 μl/min the following targets in mm from bregma: VP (−0.12 AP, ± 2.4 ML, −8.2 DV), NAcLSh (+1.44 AP, ± 2.0 ML, −8.2 DV) (Paxinos and Watson, 2009). Post-infusion, the needle was allowed to rest for 5 min to allow viral dispersion. Two groups of animals were used to assess the NAcLSh → VP pathway: NAcLSh → VP Inhibition and NAcLSh → VP Control. The inhibition group received 0.6 μl of AAV-hSyn-DIO-hM4D(Gi)-mCherry (n = 13; AAV5, UNC Vector Core; n = 4; AAV8, Addgene) in the NAcLSh and 1.0 μl CAV-Cre (IGMM, France) or CAV-Cre-GFP (IGMM, France) in the VP. Controls for the NAcLSh → VP projection received an AAV vector lacking the DREADD molecule (AAV5-hSyn-DIO-mCherry; n = 9, UNC Vector Core) in the NAcLSh and 1.0 μl CAV-Cre or CAV-Cre-GFP in the VP. Viral injection volumes were determined through pilot surgeries prior to experimentation. Adequate expression was seen using the reported 0.6uL volume for the DREADD and 1.0uL volume for the CAV-Cre. The decided upon volumes were similar to what had worked previously for other members of the lab in chemogenetic targeting of VP (Chang et al., 2015; Chang et al., 2018) and medial regions of NAc shell (Chang et al., 2018). As in those studies, we targeted here a central region of both structures along their rostrocaudal axis; ultimate variation in rostrocaudal placement (see histology maps) relates to surgical variables.
Likewise, two groups of animals were used to assess the VP → NAcLSh pathway: VP → NAcLSh Inhibition and VP → NAcLSh Control. The inhibition group received 0.6 μl of AAV-hSyn-DIO-hM4D(Gi)-mCherry (n = 12, AAV5, UNC Vector Core; n = 4, AAV8, Addgene) in the VP and 1.0 μl CAV2-Cre or CAV2-Cre-GFP in the NAcLSh. Controls of the VP → NAcLSh projection received the same virus structure with the omission of the receptor (AAV5-hSyn-DIO-mCherry; n = 10, UNC Vector Core) in VP and 1.0 μl CAV2-Cre or CAV2-Cre-GFP in the NAcLSh. Similar intersectional strategies to the one used here have shown to be effective in previous reports (Allsop et al., 2018; Boender, de Jong, Boekhoudt, Luijendijk, & van der Plasse, 2014; Carter, Soden, Zweifel, & Palmiter, 2013; Nair et al., 2013; Senn et al., 2014). Surgical incisions were closed with surgical clips and covered with Neosporin. Rats were given intraperitoneal (IP) injections at 3 mg/kg of Ketoprofen and 5 mL of 0.9% sterile saline after surgery and monitored for the remainder of the experiment. Clips were removed under isoflurane anesthetic within 2 weeks of surgery. Animals were recovered with food, DietGel (Clear H2O, ME, USA), and water. Food restriction and behavioral procedures began a minimum of 3 weeks post-surgery.
Test Apparatus.
Conditioning procedures were conducted in standard operant chambers (Med Associates, St. Albans, VT) that were enclosed in sound- and light-attenuating cabinets and were outfitted with fans for ventilation and white noise. Chambers contained two retractable levers on either side of a recessed magazine where food rewards would be delivered. Lever depressions were recorded automatically, and magazine entries were recorded through breaks in an infrared beam at the magazine site. Free feeding procedures were conducted in cleaned plastic home-cages affixed with a glass petri dish to contain food.
Test Procedures.
The experimental design included one day of magazine training, twelve days of Pavlovian conditioning training, and 2 days of free-feeding testing. For magazine training, one 30-minute session of magazine training was conducted to habituate rats to the chamber and grain pellet reward delivery (BioServ, 45 mg Dustless Precision Pellets, Rodent Grain-Based Diet). Pellets were delivered such that over a 30 min period, about 60 pellets were delivered [p(pellet per second) = 1/30]. Magazines were checked after testing to confirm consumption of reward pellets.
Pavlovian conditioning then began for 12 consecutive daily sessions. A given session contained 25 CS+ trials where the 10 sec insertion of a retractable lever was followed by the delivery of 2 grain pellets into the magazine, and 25 CS− trials where the 10 sec insertion of the other lever was followed by nothing. Trials were pseudorandomized such that no more than two of the same trial followed in sequence with intertrial intervals of approximately 2 min. Conditioning sessions were roughly 1 h in length. Thirty minutes prior to each session, intraperitoneal injections of clozapine-n-oxide (CNO) were given. CNO was dissolved in sterile water to a concentration of 0.001 g/ml and was given at a relatively low 1 mg/kg dose that we and others have found effective for behavioral studies including Pavlovian conditioning tasks (Smith, Bucci, Luikart, & Mahler, 2016; Chang et al., 2015; Chang et al., 2018).
Within 5 days of the last conditioning session, rats were administered free feeding tests in 2 consecutive sessions, 24 h apart. Rats were given CNO injections as above, and then 30 min later given access to 16 g of grain pellets in clean home-cages. Rats were given 1 h to consume 16 g of grain pellets. Food weight was measured pre- and post-feeding to calculate grams consumed.
Histology.
After completion of behavioral procedures, rats were deeply anesthetized with 1 mL phenobarbital and perfused with 0.9% saline solution for approximately 6–8 min followed by perfusion of 10% formalin until fixture of head and neck tissue (approximately 3–4 min). Brain tissue was extracted, saturated with 20% sucrose and frozen to −80 °C until sliced to 60 μm thick sections and mounted. Slides were coverslipped with Vectashield mounting medium containing DAPI (Vector Labs). Fluorescent expression was imaged via Olympus BX53 fluorescent microscope with DP73 camera. A small number of animals (n = 5 in NAcLSh → VP; n = 3 in VP → NAcLSh) underwent mCherry immunofluorescence if they showed dimmer, although still present, viral expression that could still be mapped. In these cases, expression was atypical in the form of incomplete cell body expression that appeared “fleck-like” and resulted as a consequence in overall dimmer levels of fluorescence (see Results, Viral Expression and Supplemental Analysis & Figures). For this, 60 μm slices were washed in 0.1 M PBS (3 × 10 min), blocked in a 3% normal donkey serum (one hour), and incubated overnight in primary antibody (rabbit anti-DsRed, 1:500; Clontech). The next day, slices were again rinsed in 0.1 M PBS (3 × 10 min) and then incubated for 4–5 hr in secondary antibody (donkey anti-rabbit Alexafluor 594, 1:500; Thermo Scientific). After a last rinse in 0.1 M PB (3 × 10 min), slices were mounted and coverslipped with DAPA-containing Vectashield (Vector Labs). Per-animal expression was manually transcribed onto printed images (Paxinos & Watson, 2007) and then transcribed digitally via PowerPoint (Microsoft) at 90% transparency. Per-animal expression maps were then combined into group expression maps by digitally overlaying the expression areas. VP expression was defined by Paxinos and Watson (2009) coordinates (AP: −0.12, ML: 2.4, DV: −8.2) with the target being ventral to anterior commissure and lateral/anterior to the substantia innominata and lateral preoptic area, but dorsal to magnocellular preoptic nucleus. NAcLSh expression was targeted on coordinates (AP: +1.44 mm, ML: 2.0 mm, DV: −8.2 mm) with expression localized to the area lateral and ventral to the accumbens core, but dorsal to the most rostral portion of VP and medial to the endopiriform nucleus.
Our histology inclusion criteria were as follows: (1) no defects (lesions, cell death, or infection) that would exclude the animal on the basis of health. (2) The presence of dense clusters of labeled cells within the area of interest (i.e., the upstream area; VP in the VP → NAcLSh animals; NAcLSh in the NAcLSh → VP animals). Dim/atypical viral expression merited mCherry immunochemistry (this was applied for 24% of animals that were included in analysis [n = 8/33]). In order for animals to qualify for immunochemistry protocols, they needed to show expression (even if expression was atypical) in the regions of interest. An absence of florescent expression merited exclusion from the study. Qualification for inclusion based on histology was not related to overall fluorescence level or density, which would have been problematic by having some animals undergo immunostaining. (3) Minimal (less than approximately 20 cells) or unilateral only spread of Gi outside the area of interest. Any fluorescent expression that was unexpected (i.e., in an area it wasn’t supposed to be) was checked under multiple filters to determine if it was mCherry-specific. If it was generally fluorescent (i.e., glowed regardless of filter) and not cell bound it was regarded as non-cellular, fluorescent remnants and deemed non-problematic. (4) Acceptable expression was mCherry-specific, cell-bound, bilateral, and greater than an approximate 40 cells in the area of interest. Animals who met the above criteria were included in analysis.
Fluorescent Retrograde Tracer (CAV2-zsGreen).
As the GFP tag in the subset of rats with CAV2-Cre-GFP injections was not reliably detectable, we estimated CAV2 spread in 6 separate animals (3 received a 1.0 μl injection into the VP; 3 received a 1.0 μl injection into the NAcLSh) that were unilaterally injected with CAV2-zsGreen (Zweifel Laboratory, University of Washington). Injection, histology, and imaging procedures were performed as above.
Statistical Modeling and Analysis.
All statistical tests were carried out using R (R Core Team, 2016). Categorical variables with multiple levels (e.g., Cue Block) were dummy coded to make predetermined comparisons between levels (e.g., pre CS+ vs. CS+ block, post CS+ vs. CS+ block). All linear mixed models are fit by maximum likelihood and t-tests use Satterthwaite approximations of degrees of freedom (R; “lmerTest”, Kuznetsova et al., 2015; Bates et al., 2015). The reported statistics will include parameter estimates (β values), confidence intervals (95% bootstrapped confidence intervals around dependent variable), standard error of the parameter estimate (SE), and p-values (R; “lmerTest”, Kuznetsova et al., 2015). Graphs were created through GraphPad Prism (version 7.0a) and designed with Adobe Illustrator.
Conditioning data were analyzed initially for lever presses per minute (total lever presses over the session/minutes of lever availability) in a linear mixed model which accounts for the fixed effects of lever type (CS+ or CS−) by group (inhibition or control) by interaction with session of training (sessions 1–12), and for random effects of individual rat intercepts (i.e., individual session one values) and slopes (i.e., individual rat learning rates). NAcLSh → VP inhibition group and NAcLSh → VP controls were analyzed in an individual model while the opposite projection group and its control was analyzed separately. Following the initial analysis, additional models investigate components of the primary analysis by modeling either lever response rate (i.e., CS+ presses per minute during conditioning, CS− presses per minute during conditioning) and either subgroup (i.e., CS+ vs. CS− ppm during conditioning: NAcLSh → VP inhibition group, CS+ vs. CS− ppm during conditioning: NAcLSh → VP site specific control group). See example of the main analysis below:
When trends appeared non-linear, transformations of session were tested to best fit learning rate curves (including logarithmic, quadratic, and exponential growth) and utilized if the transformation was of statistically better fit as determined by an analysis of variance comparing model deviances (p < 0.05, R; “anova” {lmerTest}) for nested models and Akaike information criterion (AIC) for non-nested model comparison (i.e., the model with the lowest AIC, ΔAIC = Model AIC – Null Model AIC). It is worth noting that when examining logarithmic or exponential components of session, the linear term is not included in the model. Both the logarithmic and exponential curves fit an increasing or decreasing function that levels off by themselves. They do not need, and should not add, the linear term as it is redundant. However, quadratic models include the linear fit as well, as in this case it is not redundant. An equation containing Χ and Χ2 is a second order polynomial. It fits empirical curves that are partly linear but have a bend or leveling off. The coefficient for the Χ term shows how much the curve increases and the Χ2 term shows how prominent the bend is. Parameter estimates for the transformed independent variable (i.e. session) are presented in the units of the dependent variable (i.e. ppm) and can be interpreted such that the dependent variable units increase for every transformed component of the independent variable. For example, the logarithmic transformation of session might yield a significant effect with an estimate of 1.28 ppm and this can be interpreted to mean that the press rate increases 1.28 for every increase of one log session. We similarly analyzed the latency to lever press upon CS+ delivery (see Supplementary Analysis and Figures).
Magazine entry data was analyzed for overall magazine entries made by each group over each of the training sessions in linear mixed models similar to the structure for lever presses (above). Further analysis investigates when some of those magazine entries occurred by looking at the 10 s block leading up to the CS+, the 10 s CS+ presentation block, and the 10 s block after the CS+ presentation (the reward period). Predetermined contrasts of the cue blocks were constructed such that each block was compared to the reward period.
Free feeding data was similarly analyzed for amount of food consumed (grams) in a linear mixed model which accounts for the group (i.e., NAcLSh → VP inhibition group and NAcLSh → VP control were analyzed in an individual model while the opposite projection group and its control were analyzed separately), individual animal weights taken during free feeding experiments, session (i.e., session 1 and 2 of free feeding), and random effects of rat.
3. Results
3.1. Viral expression
All animals were evaluated for robust expression of hM4Di receptors in the upstream area of interest (i.e. in VP for the VP → NAcLSh projection); those without clear expression or expression outside the area of interest were excluded from analysis (n = 15, due mainly to a faulty virus batch). Additionally, 3 animals were excluded during behavioral testing for health reasons. Thus, analysis was run with group sizes as: 14 animals in NAcLSh → VP analysis (control group = 6; inhibition group = 8), 19 animals in VP → NAcLSh analysis (control group = 9, inhibition group = 10). Linear mixed model analysis of repeated measures data can accommodate uneven group sizes (Gibbons, Hedeker, & DuToit, 2010).
The vast majority of animals in the NAcLSh → VP inhibition group exhibited hM4Di-mCherry expression in the lateral shell area as previously defined between bregma +1.20–2.16 mm with one animal showing some expression slightly more medial (although this animal had anterior expression more lateral; Fig. 1A). Two animals had very discrete expression of hM4Di-mCherry in anterior portions of VP, but with the vast majority of expression in NAcLSh, and were thus included in analyses. Similarly, animals in the NAcLSh → VP site-specific control exhibited mCherry expression in the NAcLSh area. Notedly, mCherry expression from the control virus appeared more robust, and tended spread into a larger area than the DREADD-containing inhibitory virus (Fig. 1B). These controls were included in analysis given that they would control for viral mediated gene delivery at a level covering the DREADD expression areas and even beyond. Animals in the VP → NAcLSh inhibition group had robust hM4Di expression in the defined VP region between bregma −0.36–+0.36 mm (Fig. 2A). Two animals showed more rostral VP expression up to +1.68 mm, but by far the most dense expression occurred in the VP in these animals. Given the minor spread beyond the target area of hM4Di expression, we refer to manipulations here as pathway-biased rather than pathway-specific. VP → NAcLSh control group expression was similarly greatest in VP with more spread dorsally as seen in the NAcLSh → VP control group (Fig. 2B).
Fig. 1.
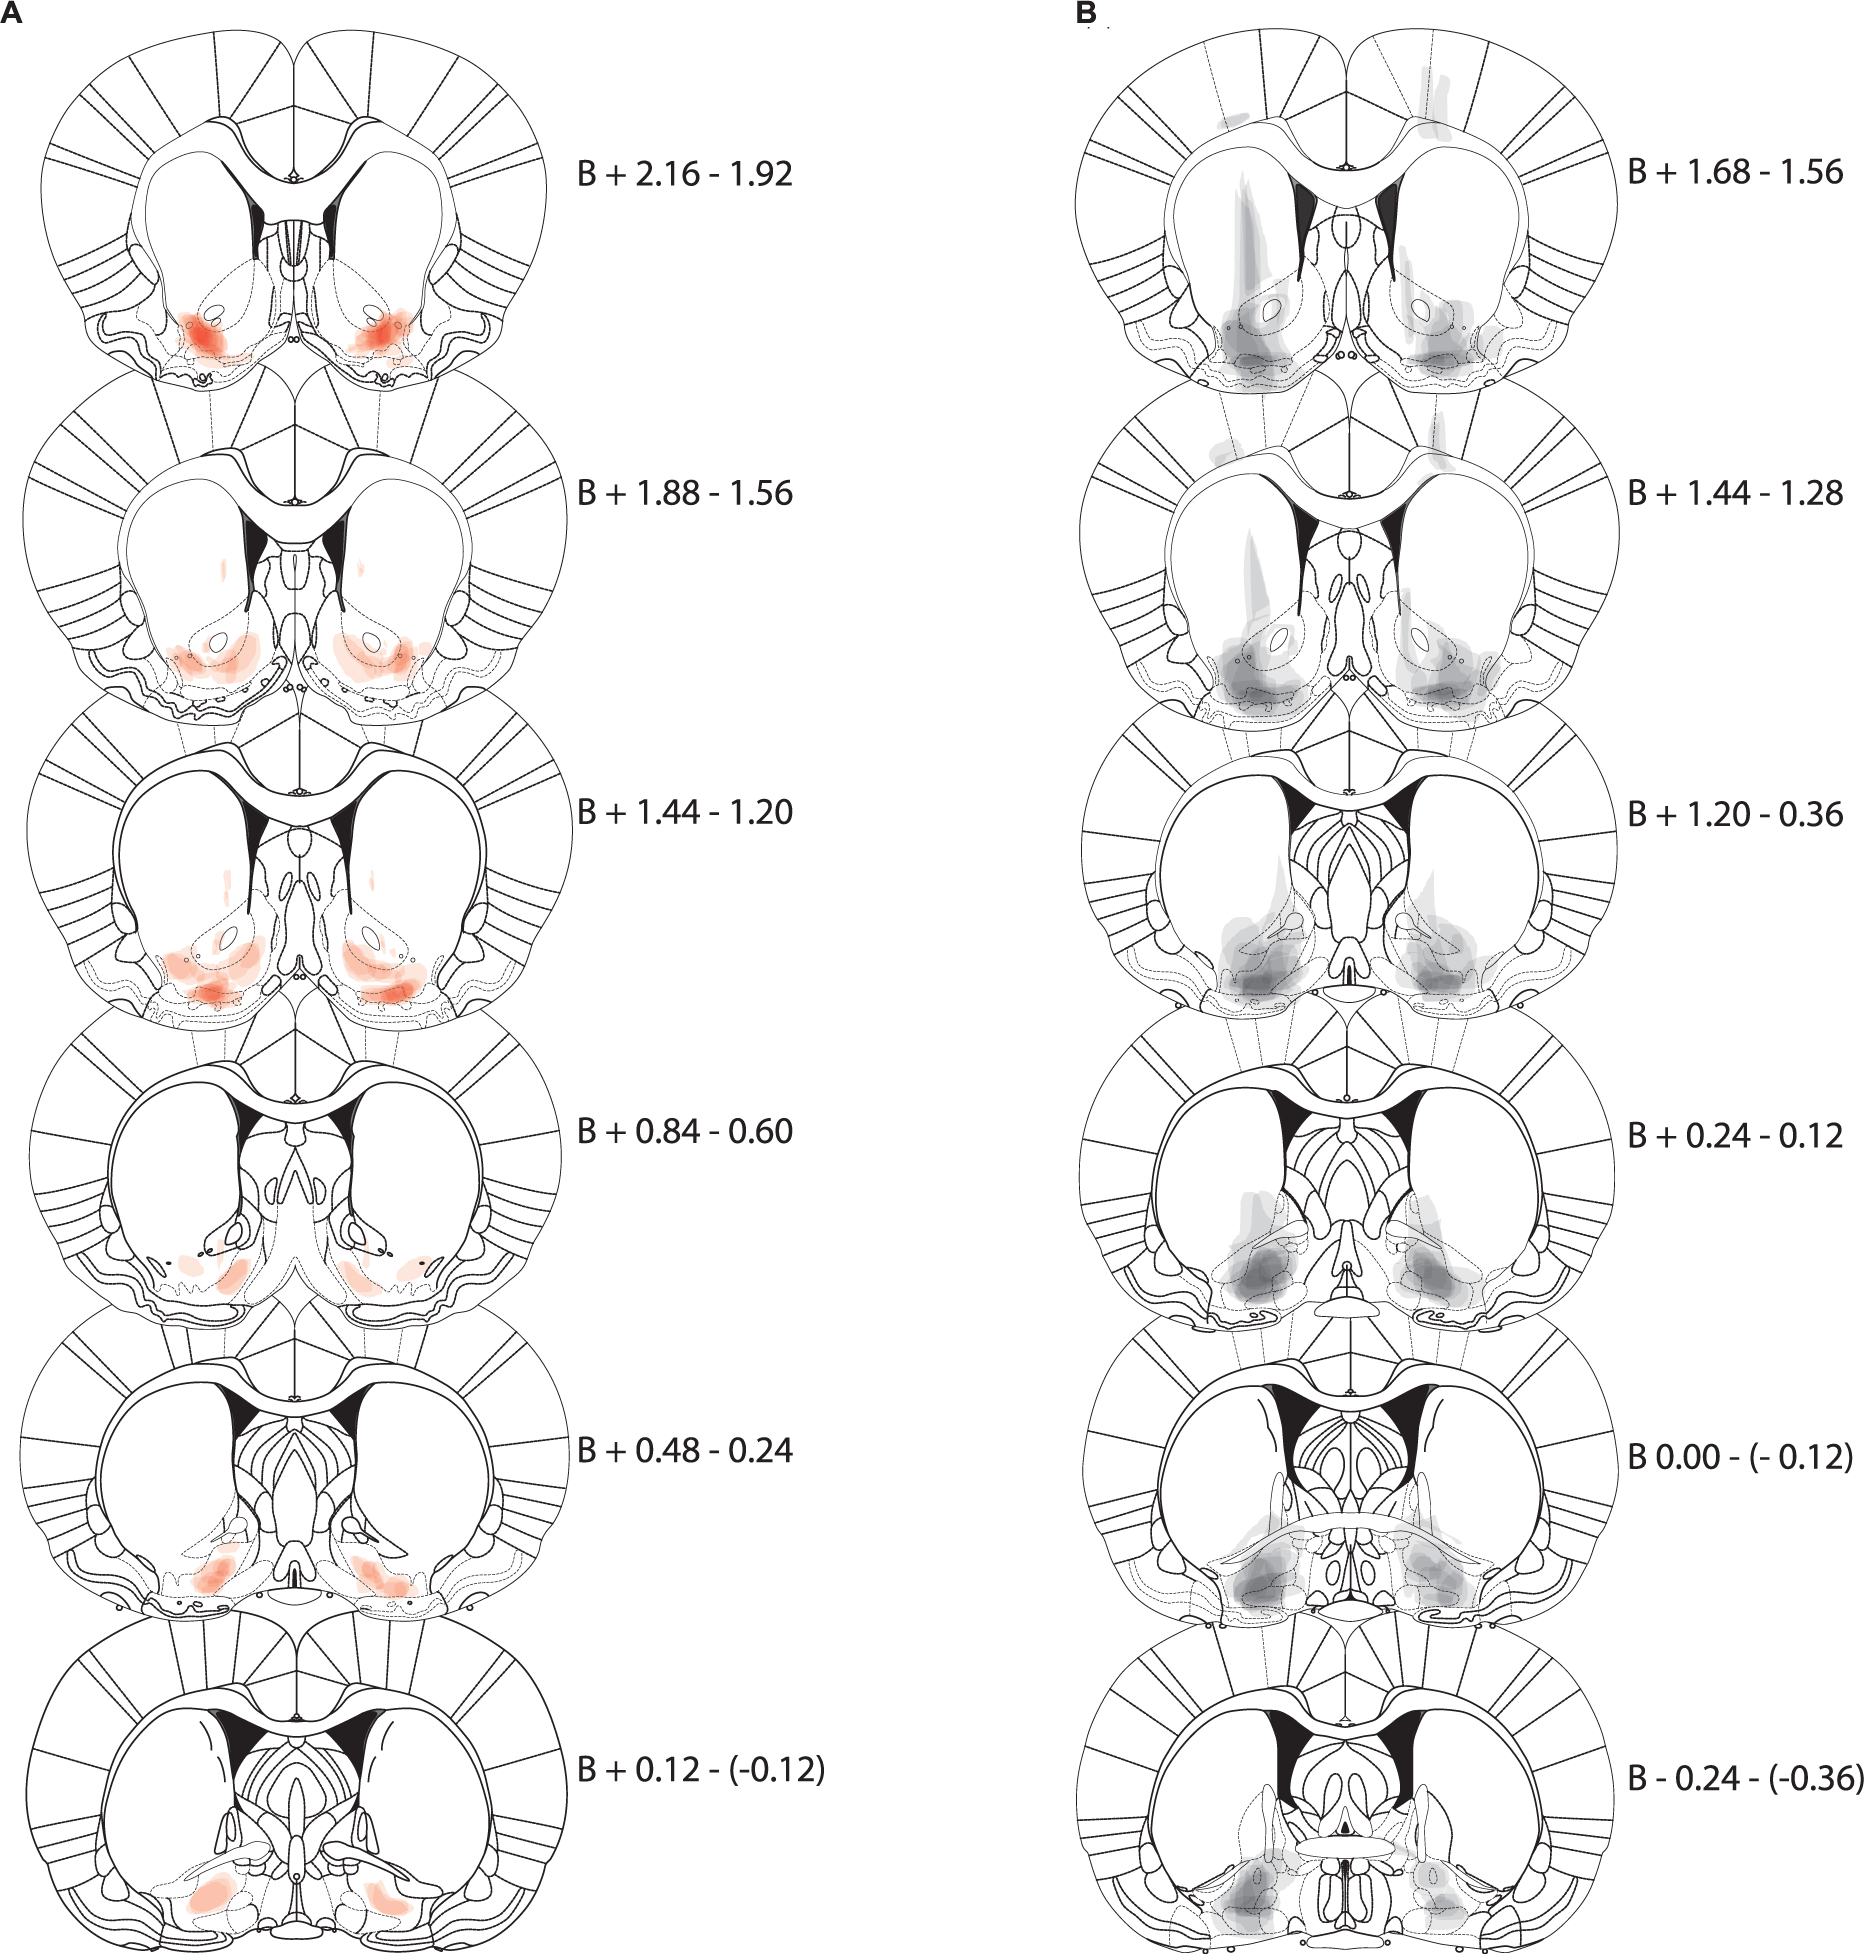
NAcLSh → VP expression maps. Each coronal section represents a range of three sections relative to Bregma (B, in mm). Expression for each animal is plotted at 90% transparency with per-animal expression overlaid. Sections run anterior (top) to posterior (bottom). (A) Expression map of AAV-hSyn-DIO-hM4D(Gi)-mCherry in NAcLSh following CAV2-Cre injections in the VP (i.e., NAcLSh → VP inhibition animals; red). (B) Expression map of AAV-hSyn-DIO-mCherry in NAcLSh (i.e., controls; black). (For interpretation of the references to colour in this figure legend, the reader is referred to the web version of this article.)
Fig. 2.
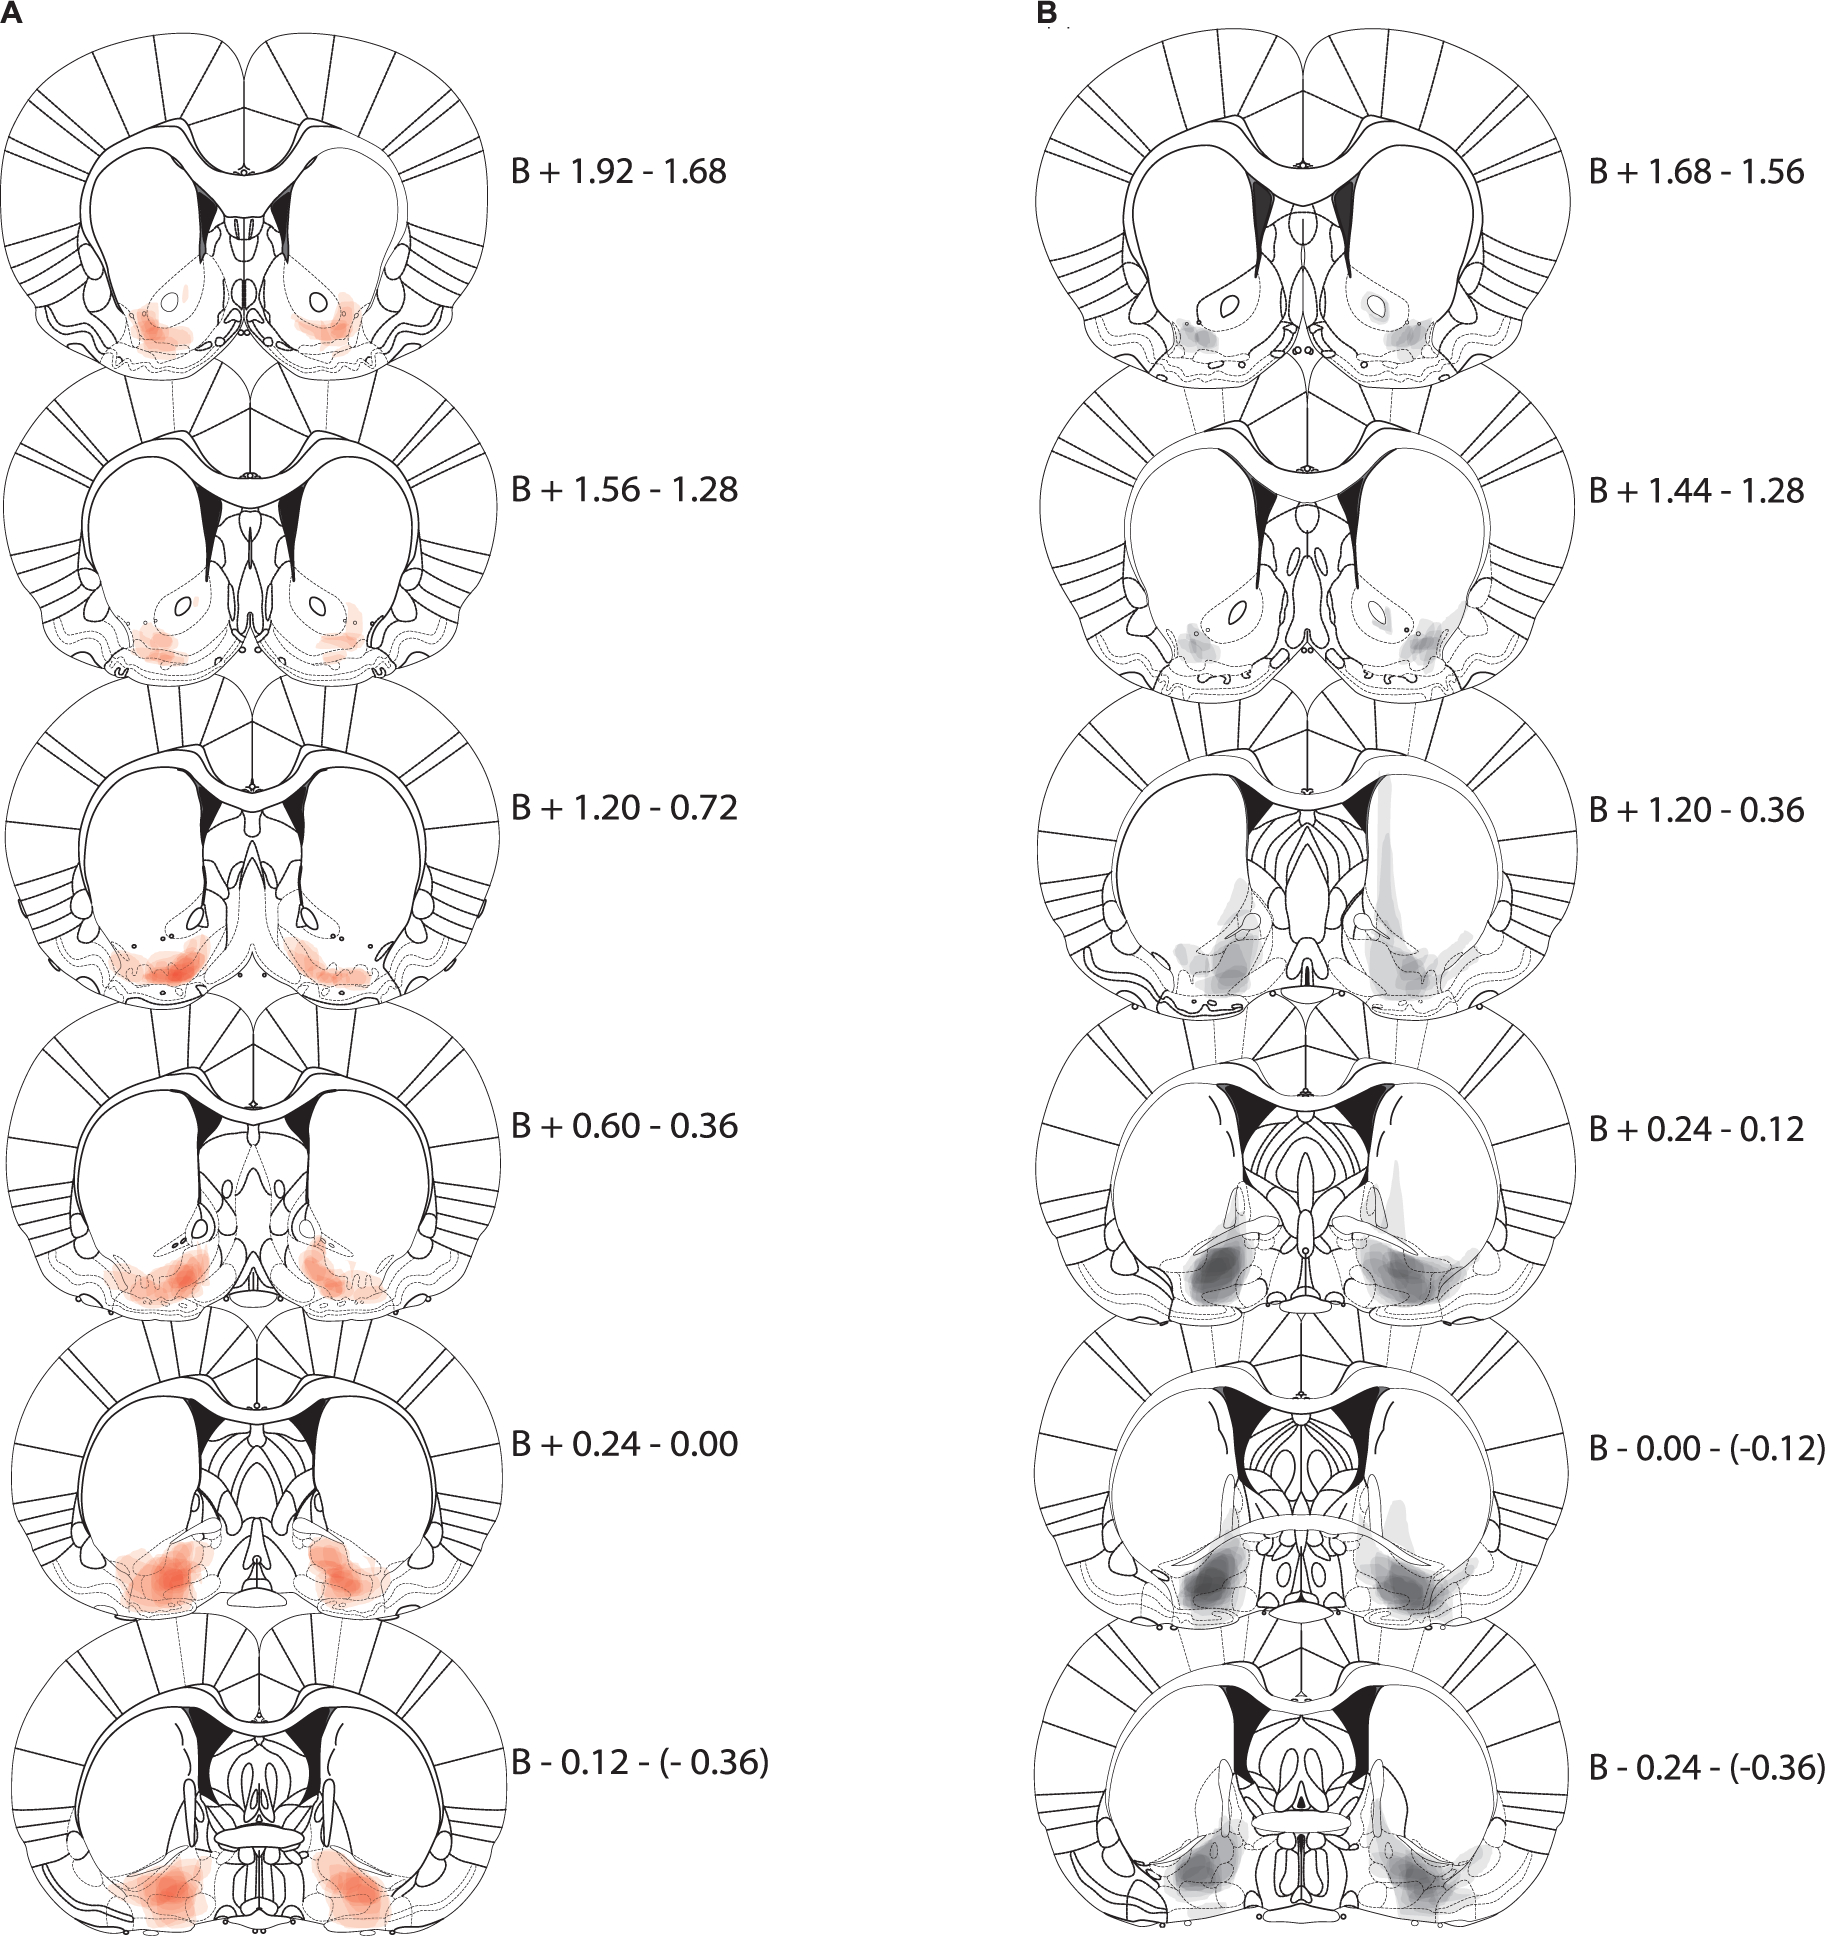
VP → NAcLSh expression maps. Each coronal section represents a range of three sections relative to Bregma (B, in mm). Expression for each animal is plotted at 90% transparency with per-animal expression overlaid. Sections run anterior (top) to posterior (bottom). A) Expression map of AAV-hSyn-DIO-hM4D(Gi)-mCherry in VP following CAV2-Cre injections in NAcLSh (i.e., VP → NAcLSh inhibition animals; red). B) Expression map of AAV-hSyn-DIO-mCherry in VP (i.e., controls; black). (For interpretation of the references to colour in this figure legend, the reader is referred to the web version of this article.)
A few animals in manipulation groups (NAcLSh → VP inhibition [n = 5 of 8], VP → NAcLSh inhibition [n = 3 of 10]), showed hM4Di-mCherry expression that could be characterized as “fleck-like” where expression was not clearly arranged in the neuronal membranes. This expression was only visible in the TexasRed filter, and not in other filters, nor was there any sign of cell death as judged by DAPI expression. This provided confidence that the expression was the mCherry tag, as did the statistically similar results on the main behavior of interest (CS+ responding) of these animals (Supplementary Fig. 1).
CAV expression estimation (CAV2-zsGreen).
In the animals who received NAcLSh injections of CAV-zsGreen, discrete localization of zsGreen was seen in lateral VP (Fig. 3A). In animals who received VP injections, discrete localizations of zsGreen was seen in very lateral portions of our NAcLSh target (Fig. 3B). In both of these cases, the zsGreen expression was highly confined anatomically.
Fig. 3.
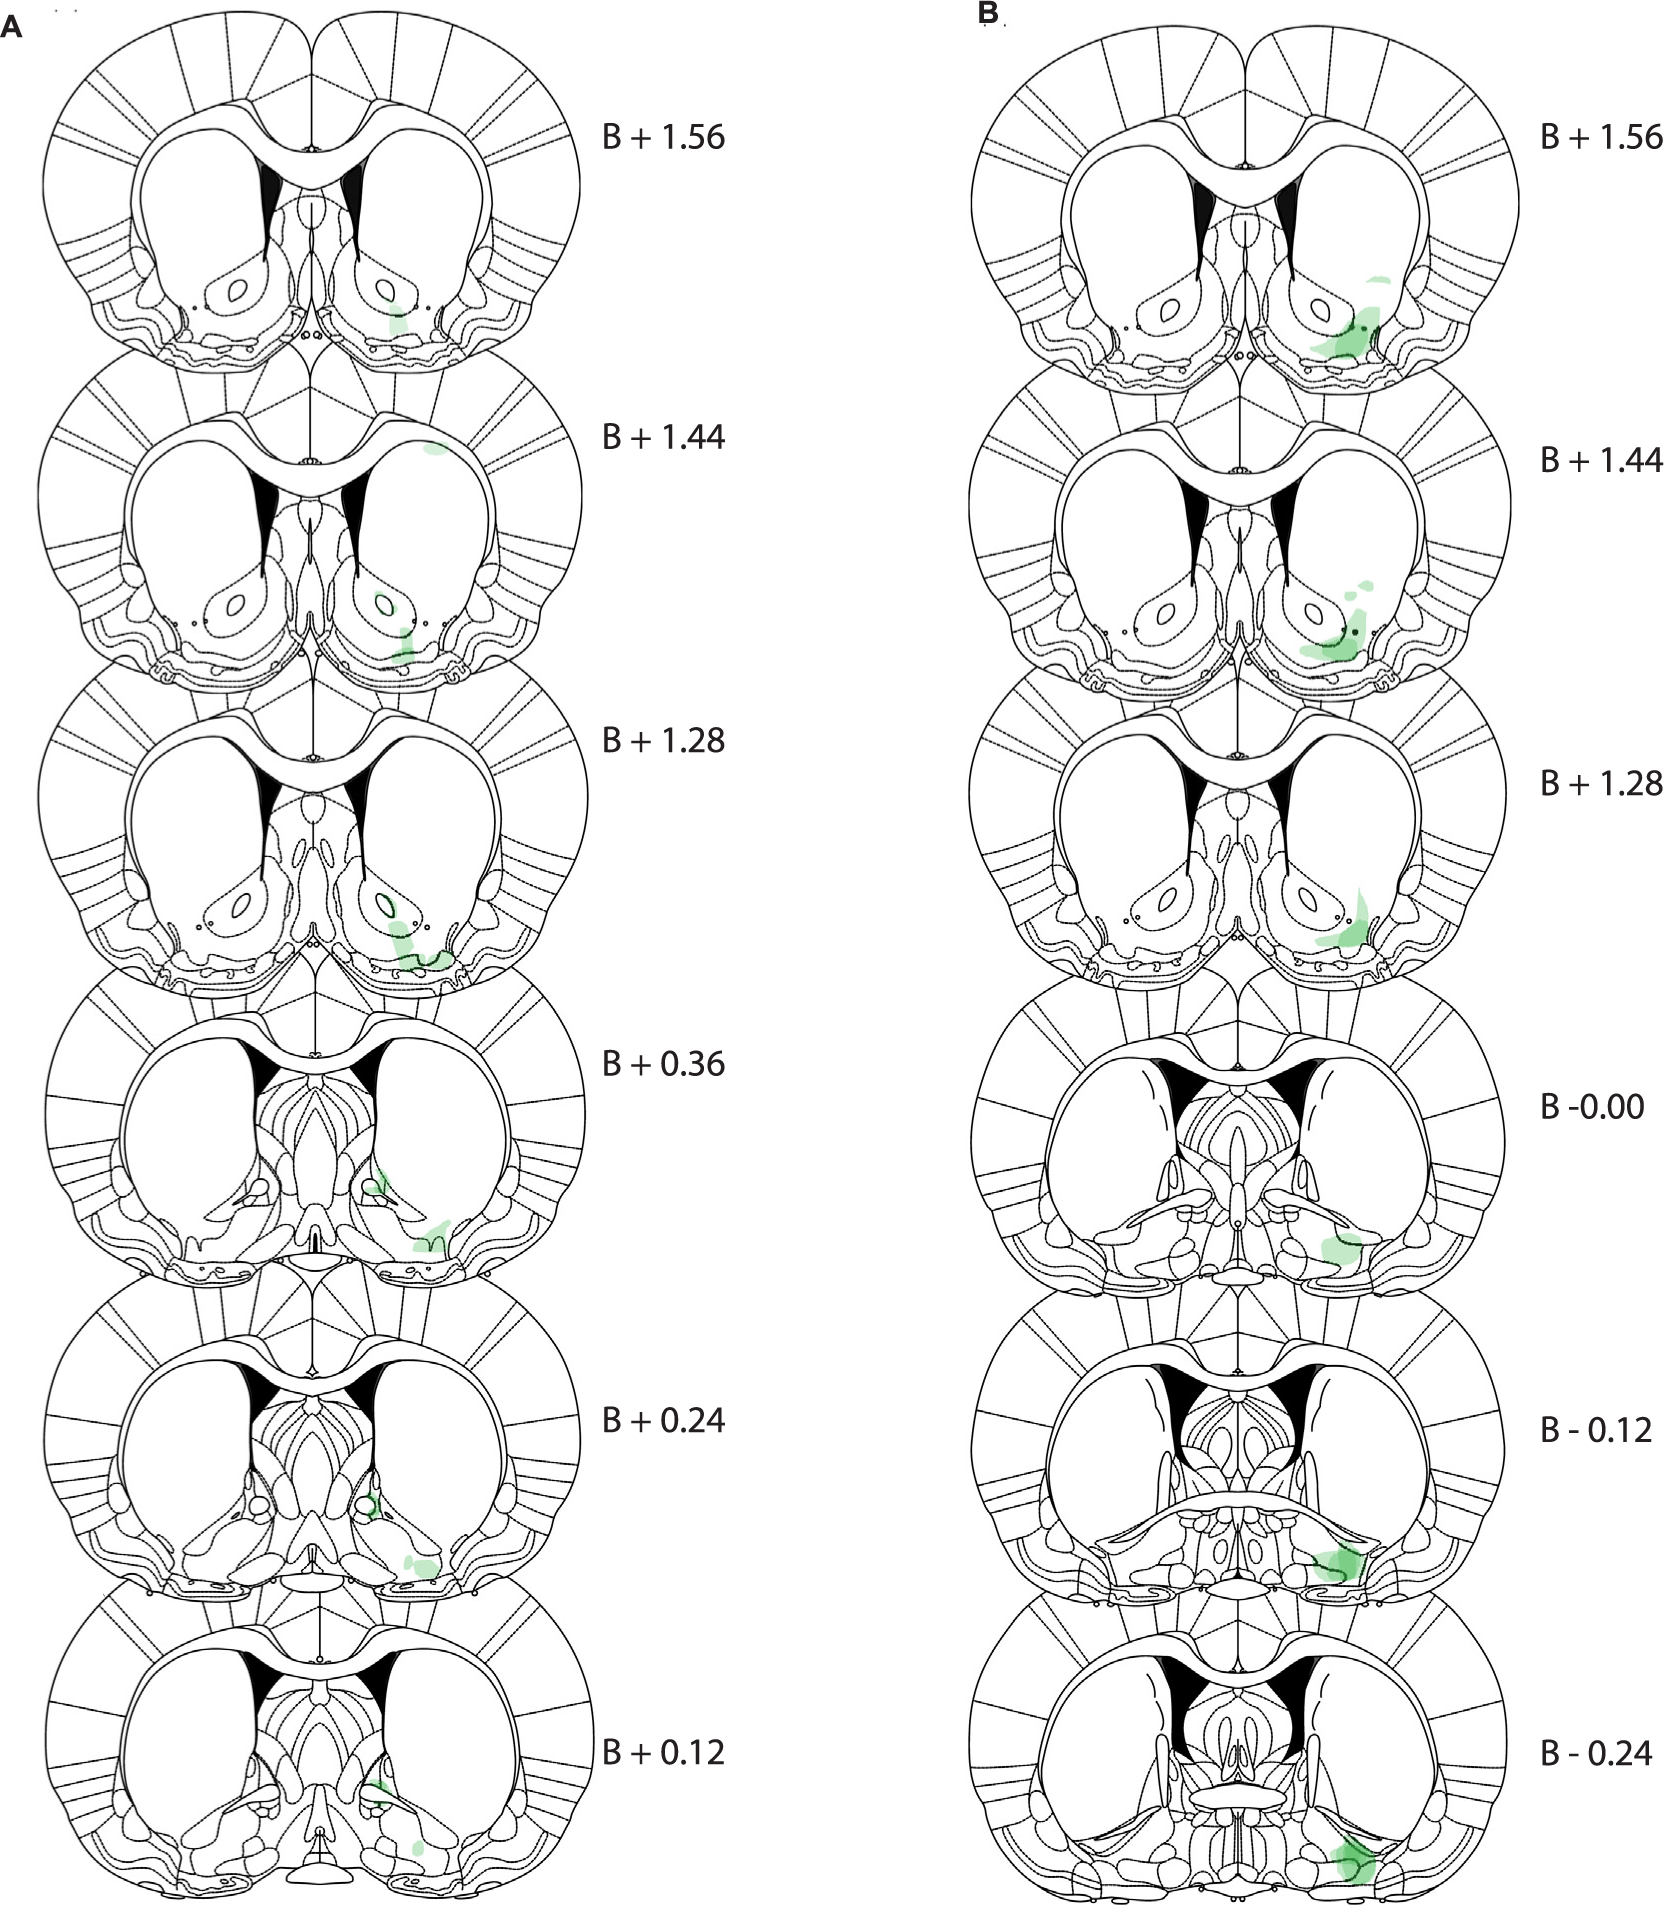
CAV-zsGreen histology. (A) Expression of retrograde tracer CAV2-zsGreen after injection into NAcLSh target (transparency: 70%; green). (B) Expression of CAV2-zsGreen after injection into the VP target (transparency: 70%; green). Expression will reflect retrograde transport into neurons projecting to the injection site, including interneurons. (For interpretation of the references to colour in this figure legend, the reader is referred to the web version of this article.)
3.2. NAcLSh to VP projection inhibition analysis
NAcLSh to VP General Lever Responding during Conditioning.
To generally determine if press rates differed by lever type (CS+ vs. CS−), group (NAcLSh → VP inhibition vs. NAcLSh → VP control), and session (1–12), a linear mixed model with random effects of session and rat was constructed. Linear variables were scaled (standardized).
Results indicate that while all rats preferred the CS+ lever, the NAcLSh → VP inhibition group sign-tracked less towards the CS+ lever than NAcLSh → VP controls. The quadratic fit of session significantly contributed to the model (Χ2(4) = 31.89, p < 0.001). A significant main effect of lever type revealed the CS+ lever was generally preferred over the CS− by all animals (Fig. 4A; est: 23.3 ppm; CI: 21.2–25.2; SE: 1.02; p < 0.001). The main effect of group was significant (est: 6.16 ppm; CI: 0.41–11.7; SE: 2.83; p = 0.044) and the NAcLSh → VP inhibition animals pressed the CS+ lever less than NAcLSh → VP controls as seen in a significant interaction of lever type by group (est: 22.8 ppm; CI: 18.3–26.3; SE: 2.05; p < 0.001). All animals had increased press rates by the end of training as determined by a main effect of linear session (est: 10.3 ppm; CI: 4.00–16.7; SE: 3.29; p = 0.006). The quadratic component of session was also significant (est: −8.67; CI: −15.6–(−1.53); SE: 3.64; p = 0.031). However, the CS+ is pressed more by all animals by the end of training as determined by a significant interaction of lever type by linear session (est: 4.76 ppm; CI: 2.84–6.80; SE: 1.03; p < 0.001). Press rates differed by group over sessions (est: 3.62 ppm; CI: 0.23–6.72; SE: 1.54; p = 0.033), however the three-way interaction of lever type by linear session by group was not significant (est: 3.91 ppm; CI: −0.40–7.84; SE: 2.05; p = 0.058).
Fig. 4.
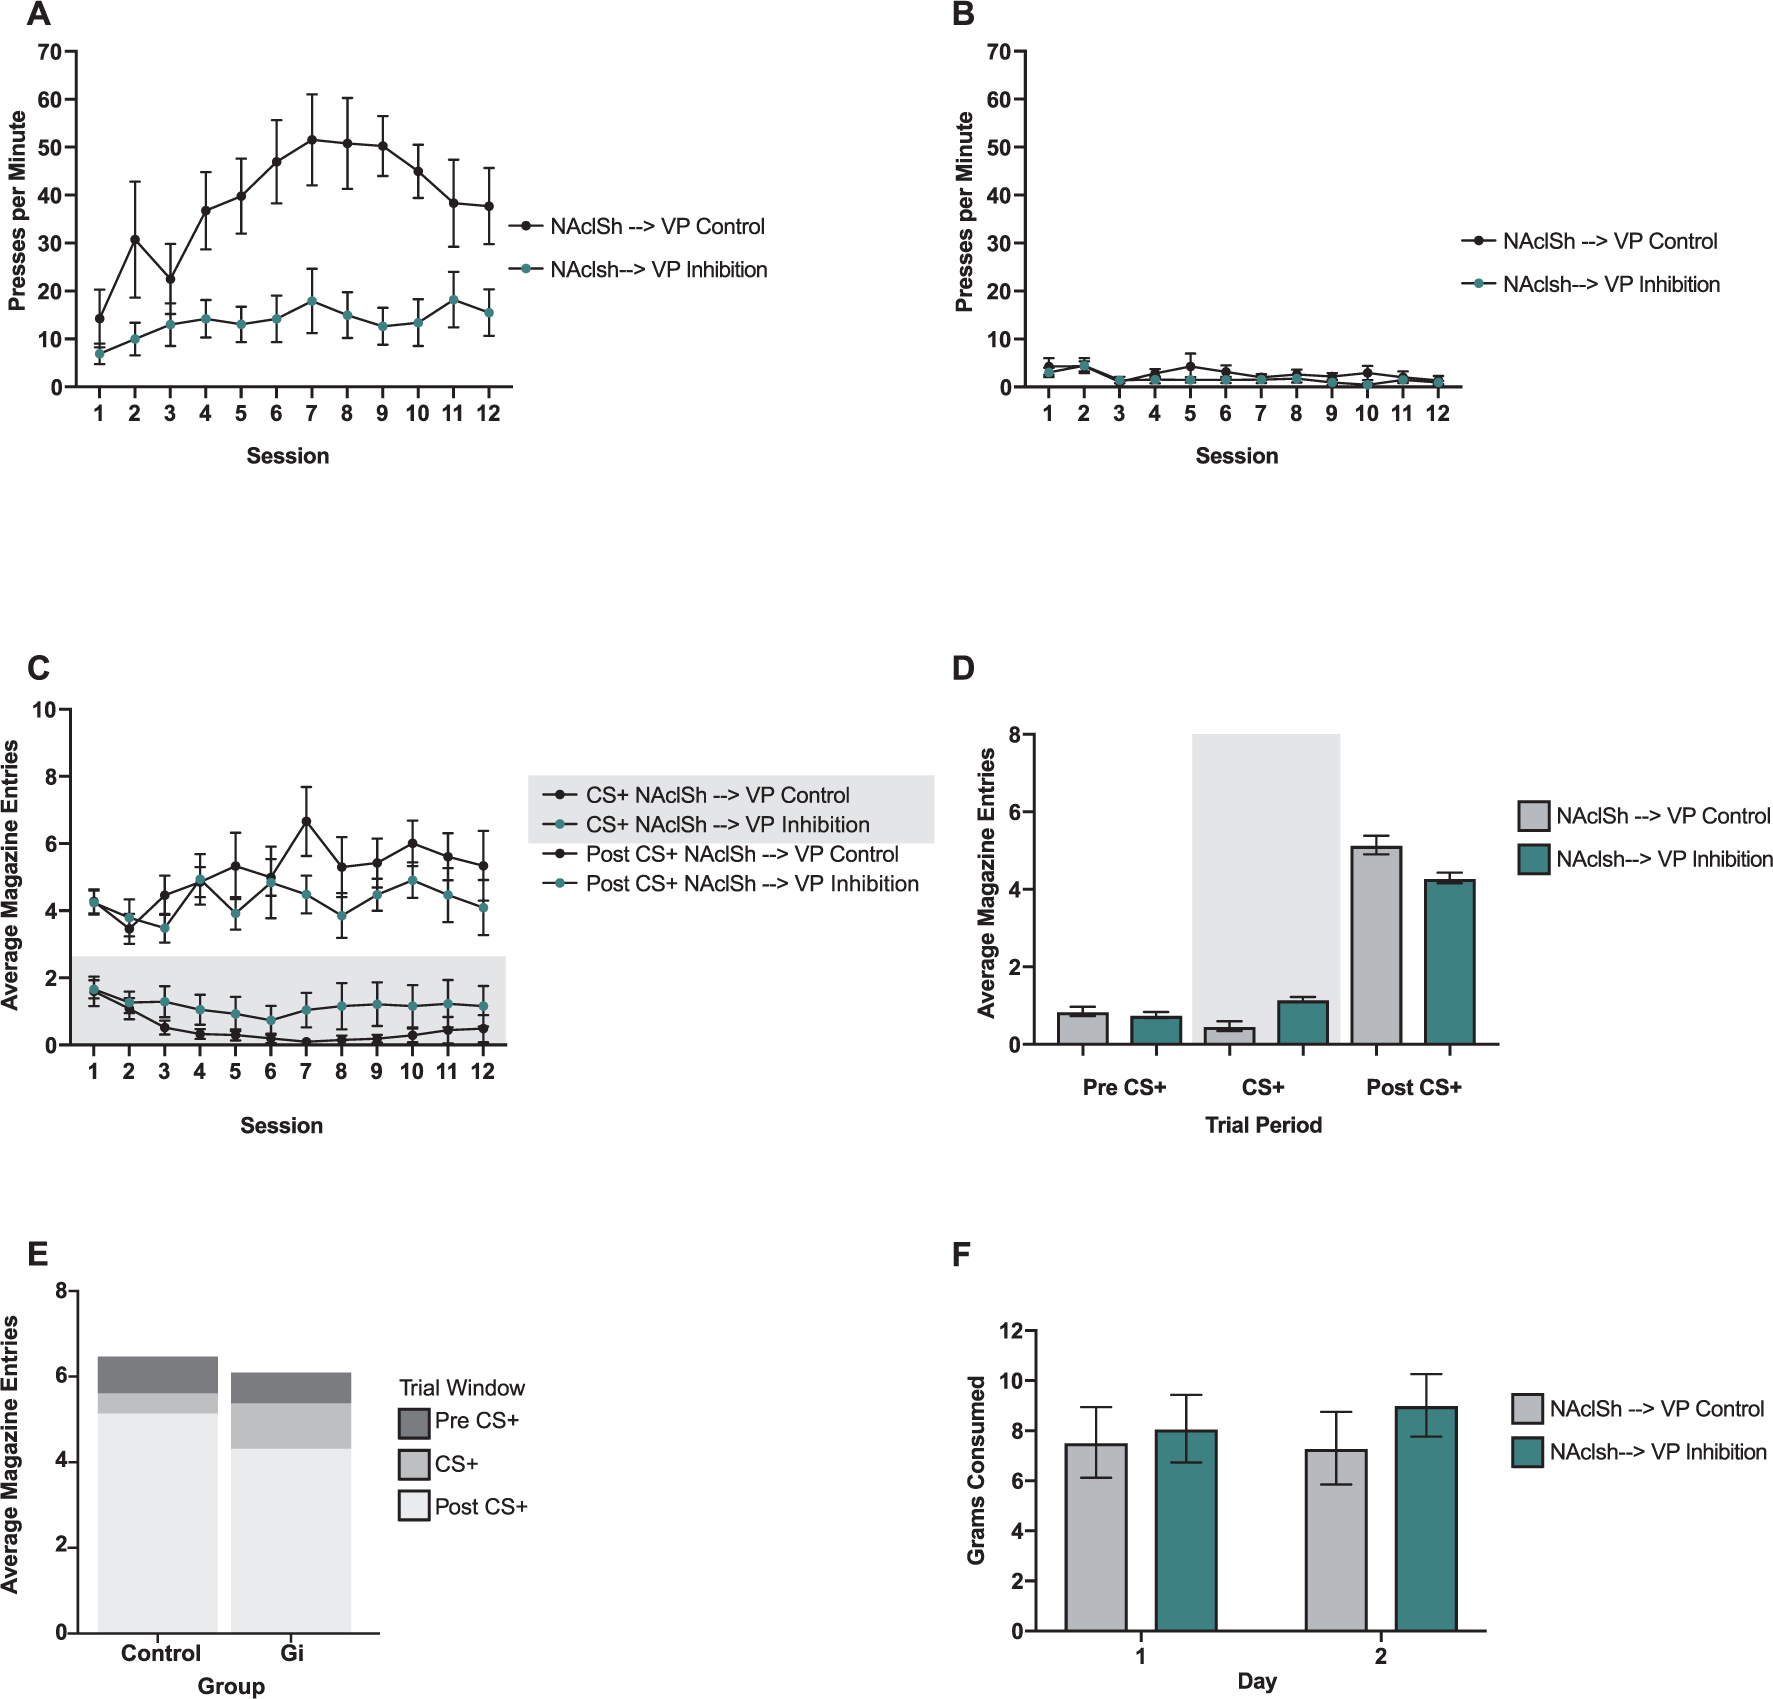
Effects of NAcLSh → VP inhibition. (A) Presses per minute (ppm) on the CS+ lever over the 12 training sessions for the NAcLSh → VP inhibition group (green) and the NAcLSh → VP control group (black). (B) Ppm on the CS− lever for both groups. (C) Average magazine entries per session during the 10 sec CS+ presentation (shaded grey background) and the 10 sec post CS+ block (i.e., reward delivery) for both the NAcLSh → VP control (black) and NAcLSh → VP inhibition group (green). (D) Average magazine entries per 10 sec block type (10 sec Pre CS+, 10 sec CS+ [shaded grey background], 10 sec Post CS+) in the NAcLSh → VP inhibition group (green) and the NAcLSh → VP control group (grey). (E) Average magazine entries per block type in the NAcLSh → VP control group (left) NAcLSh → VP inhibition group (right) with the whole bar representing the total magazine entries made during the 30 s trial period encompassing all three blocks. (F) Grams of food consumed over the two free feeding sessions in NAcLSh → VP inhibition group (green) and the NAcLSh → VP control group (grey). For all graphs, bars and lines show mean and errors show ± SEM. (For interpretation of the references to colour in this figure legend, the reader is referred to the web version of this article.)
CS+ presses per minute during conditioning.
The inhibition of the NAcLSh → VP pathway resulted in a decrease in ppm toward the CS+ lever compared to the NAcLSh → VP control group. The NAcLSh → VP projection data of CS+ ppm over time appeared non-linear in form; comparison of a model containing quadratic and linear components against a model containing only linear components revealed a significant contribution of quadratic session to the model (Χ2(4) = 72.62, p < 0.001). Thus, a linear mixed model was constructed with CS+ ppm by main effects of group (NAcLSh → VP inhibition vs. NAcLSh → VP control), by session (1–12; both linear and quadratic fits), with random effects of animal starting level and learning rate:
This model had both significant quadratic (est: −0.39 ppm; CI: −0.68–(−0.11); SE: 0.15; p = 0.017) and linear (est: 6.40 ppm; CI: 3.15–9.72; SE: 1.69; p = 0.002) fit components and did not show a main effect of group (est: −4.48 ppm; CI: −17.9–9.18; SE: 6.14; p = 0.478). The group by linear fit (est: 2.36 ppm; CI: 0.34–4.27; SE: 0.86; p = 0.015) interaction was significant. This result indicated that animals with the NAcLSh → VP pathway inhibited showed markedly reduced sign-tracking behavior as a function of training time compared to controls (Fig. 4A).
CS− ppm during conditioning.
Both the NAcLSh → VP inhibition group and the NAcLSh → VP control group decreased ppm toward the non-paired lever similarly. CS− ppm data appeared linear and a linear mixed model fitting CS− press rates by main effects of group by session (1–12; natural log transformation), with random effects of animal starting level and learning rate:
We detected no significant difference between Gi and controls (est: 0.80 ppm; CI: −1.35–3.26; SE: 1.12; p = 0.486) nor a significant interaction of group by session (est: 0.04 ppm; CI: −0.14–0.21; SE: 0.09; p = 0.676), indicating that NAcLSh → VP inhibition and NAcLSh → VP control groups did not differ overall in interaction with the non-predictive lever nor in how they terminated pressing overtime. There was a significant main effect of session (est: −0.19 ppm; CI: −0.28–(−0.09); SE: 0.04; p < 0.001) showing that both groups decreased CS− pressing over the course of training (Fig. 4A).
CS+ vs. CS− ppm during conditioning.
Ppm on the paired (CS+) and non-paired (CS−) lever were compared within each group by fixed effects of time (i.e., session) and lever type (CS+ vs. CS−; see analysis below). Both NAcLSh → VP inhibition animals and the NAcLSh → VP control group showed a preference for the paired CS+ lever over the non-paired CS− lever. Although the degree of CS+ sign-tracking was reduced in the inhibition group compared to controls (see analysis above), the inhibition group still showed a preference for the CS+ compared to the CS−. In short, sign-tracking during NAcLSh → VP inhibition was reduced but was not eliminated to the level of CS− sign-tracking.
CS+ vs. CS− ppm during conditioning: NAcLSh → VP inhibition group.
Data appeared linear and a linear mixed model was used to analyze press rate by lever type and session interaction with random slope and rat intercepts:
There was a significant main effect of press rates comparing the CS− to CS+ levers (est: 6.69 ppm; CI: 2.74–10.8; SE: 2.08; p = 0.002) with an average of nearly 6.69 ppm greater towards the paired lever. There was not a significant main effect of session (est: 0.20 ppm; CI: −0.18–0.58; SE: 0.20; p = 0.346). However, a significant session by cue interaction (est: 0.81 ppm; CI: 0.24–1.36; SE: 0.28; p = 0.005) illustrated an increase in sign-tracking to the paired CS+ lever over time (Fig. 4A).
CS+ vs. CS− ppm during conditioning: NAcLSh → VP site-specific control group.
A quadratic transformation in session significantly contributed to the model (Χ2(4) = 22.40, p < 0.001) and thus was included in the final model:
There was a significant main effect of press rates toward the CS+ (est: 22.1 ppm; CI: 14.0–30.6; SE: 4.20; p < 0.001). Both linear (est: 5.84 ppm; CI: 2.61–8.96; SE: 1.62; p = 0.006) and quadratic (est: −0.39 ppm; CI: −0.67–(−0.11); SE: 0.14; p = 0.029) transformations in session were significant. A linear session by cue interaction (est: 1.94 ppm; CI: 0.73–3.01; SE: 0.57; p < 0.001) showed a significant increase in presses toward the CS+ lever over sessions compared to the CS− lever (Fig. 4A).
Magazine entries during conditioning.
NAcLSh → VP inhibition and NAcLSh → VP control groups did not differ in their overall magazine entries per day nor in how they entered the magazine over sessions. Total magazine entries per day appeared linear and were analyzed by a linear mixed model with fixed effects of group (NAcLSh → VP inhibition and NAcLSh → VP control groups) by session with random slopes and intercepts:
The main effect of group was not significant (est: −31.4 entries; CI: −226–176; SE: 104; p = 0.767). The main effect of session was significant (est: −16.1 entries; CI: −30.5–(−1.95); SE: 7.51; p = 0.049), indicating that all animals decreased their number of entries by the end of training. The interaction of group by session was not significant (est: 15.8 entries; CI: −14.6–46.7; SE: 15.0; p = 0.311), and thus NAcLSh → VP inhibition and NAcLSh → VP control groups did not differ over sessions in their magazine entry behavior (Fig. 4B).
Magazine entries by cue block during conditioning.
Although the NAcLSh → VP inhibition group and the NAcLSh → VP control group did not differ in overall magazine entries, as above, there was a difference in how each group distributed their entries with respect to the CS+ versus post-CS+ time blocks over sessions. The NAcLSh → VP control group displayed more traditional sign-tracking behavior where they developed a decreased magazine entry rate during cue presentation and increased magazine entries during the post-cue block when reward was available. The NAcLSh → VP inhibition group did not show this shift over time, exhibiting less of a difference in entries between the CS+ and post CS+ block.
Magazine entries recorded during ten-sec cue blocks (pre CS+, CS +, post CS+ [i.e., reward delivery]) each were averaged over 25 trials per day (i.e., an average entries per trial in the pre CS+ block). A predetermined contrast analyzed the CS+ presentation block against the reward delivery block and if more magazine entries were performed during the reward block (as expected) compared to the cue presentation. Another contrast analyzed the 10 s block prior to CS+ presentation against the reward delivery and if magazine entries were greater during the reward (as expected) compared to the time prior to cue delivery. The average entries per block appeared linear and were analyzed in a linear mixed model by fixed effects of session, group, and cue, with random effects for individual rat intercepts (random slopes could not be included due to failed convergence):
No significant main effect of group was found (est: −0.02 avg. entries; CI: −0.90–1.03; SE: 0.49; p = 0.961). However, a significant session effect was found (est: 0.10 avg. entries; CI: 0.05–0.15; SE: 0.03; p < 0.001). Regardless of group, contrasts to compare pre CS+ to post CS+ blocks was significant with 2.85 average entries greater during the post CS+ block compared to pre CS+ (est: −2.85 avg. entries; CI: −3.42–(−2.32); SE: 0.29; p < 0.001). CS+ presentation to post CS + block was also significant with 2.90 average entries greater during the post CS+ block compared to pre CS+ (est: −2.09 avg. entries; CI: −3.56−(−2.36); SE: 0.29; p < 0.001). The trend towards greater entries during the post CS+ block developed over time as seen in a significant pre CS+ to post CS+ by session interaction (est: −0.16 avg. entries; CI: −0.22–(−0.08); SE: 0.04; p < 0.001) and significant CS+ to post CS+ by session interaction (est: −0.15 avg. entries; CI: −0.21–(−0.07); SE: 0.04; p < 0.001; Fig. 4C). The NAcLSh → VP inhibition group and the NAcLSh → VP control group differed in how they entered the magazine over sessions, with a significant group by session interaction (est: 0.13 avg. entries; CI: 0.02–0.22; SE: 0.05; p = 0.018). A three way interaction of group by session by CS+ vs. post CS+ blocks was significant (est: −0.20 avg. entries; CI: −0.33–(−0.04); SE: 0.08; p = 0.009), indicating that the NAcLSh → VP control group made slightly more magazine entries during the post-CS+ reward block, and fewer entries during the CS+ itself, over sessions compared to the NAcLSh → VP inhibition group (Fig. 4C). Notedly, this difference was only seen over sessions and was not present overall as determined by a non-significant CS+ versus post CS+ by group interaction (est: −0.17 avg. entries; CI: −1.29–0.91; SE: 0.58; p = 0.767; Fig. 4D and E). The NAcLSh → VP inhibition group and the NAcLSh → VP control group did not differ over sessions in how they entered the magazine during the ten second blocks before vs. during CS + presentation (i.e., the three way interaction of group by session by contrast of pre CS+ to post CS+; est: −0.10 avg. entries; CI: −0.25–0.05; SE: 0.08; p = 0.173). The overall interaction of preCS+ versus post CS+ by group interaction was not significant (est: −0.15 avg. entries; CI: −1.16–1.03; SE: 0.58; p = 0.942; Fig. 4D and E).
Free feeding.
The NAcLSh → VP inhibition and the NAcLSh → VP control groups did not differ in the amount of food consumed during free feeding tests nor did their weights impact feeding behavior. A linear mixed model of total grams of food consumed as a function of group (NAcLSh → VP control versus NAcLSh → VP inhibition) by day (days 1 and 2) and body weight (in grams) by day, with random effects of individual animal, was constructed:
There was not a significant main effect of grams consumed by day of testing (est: 0.42 g; CI: −0.44–1.18; SE: 0.41; p = 0.319) nor main effect of grams consumed by group (est: −11.25 g; CI: −32.8–9.79; SE: 11.1; p = 0.325). Grams consumed did not differ by body weight (est: −0.01 g; CI: −0.05–0.02; SE: 0.02; p = 0.410). There was not a significant group by day interaction (est: −1.33 g; CI: −3.23–0.26; SE: 0.82; p = 0.123) nor group by weight interaction (est: 0.03 g; CI: −0.03–0.10; SE: 0.03; p = 0.323; Fig. 4F).
3.3. VP → NAcLSh projection inhibition analysis
VP to NAcLSh General lever responding during conditioning.
To generally determine if press rates differed by lever type (CS+ vs. CS−), group (VP → NAcLSh inhibition vs. VP → NAcLSh control), and session (1–12) a linear mixed model with random effects of session and rat was constructed.
Rats in both the VP → NAcLSh inhibition group and the VP → NAcLSh control group showed a preference for the CS+ lever, which developed over training. However, the VP → NAcLSh inhibition group and the VP → NAcLSh control group did not differ in their behavior toward either the CS+ or CS− levers. Transformations in session did not significantly contribute to the model structure and as such only linear forms of session were included in the final model. The CS+ was preferred by all animals as determined by a significant main effect of lever type (Fig. 5A; est: 11.1 ppm; CI: 8.29–13.8; SE: 1.40; p < 0.001). A non-significant main effect of group indicated that the VP → NAcLSh inhibition and VP → NAcLSh control groups did not generally differ in press rates (est: −3.36 ppm; CI: −7.95–1.51; SE: 2.36; p = 0.171). The VP → NAcLSh inhibition and VP → NAcLSh control groups had similar press rates toward both the CS+ and CS− levers as determined by a non-significant interaction of lever type by group (est: −2.68 ppm; CI: −7.97–2.68; SE: 2.79; p = 0.338). The CS+ lever preference also developed over sessions as seen in a significant lever type by session interaction (est: 1.13 ppm; CI: 0.76–1.52; SE: 0.19; p < 0.001). Press rates did not differ by group over sessions (est: 0.19 ppm; CI: −0.39–0.85; SE: 0.30; p = 0.534) nor did the three way interaction of lever type by session by group (est: −0.01 ppm; CI: −0.75–0.78; SE: 0.380; p = 0.988).
Fig. 5.
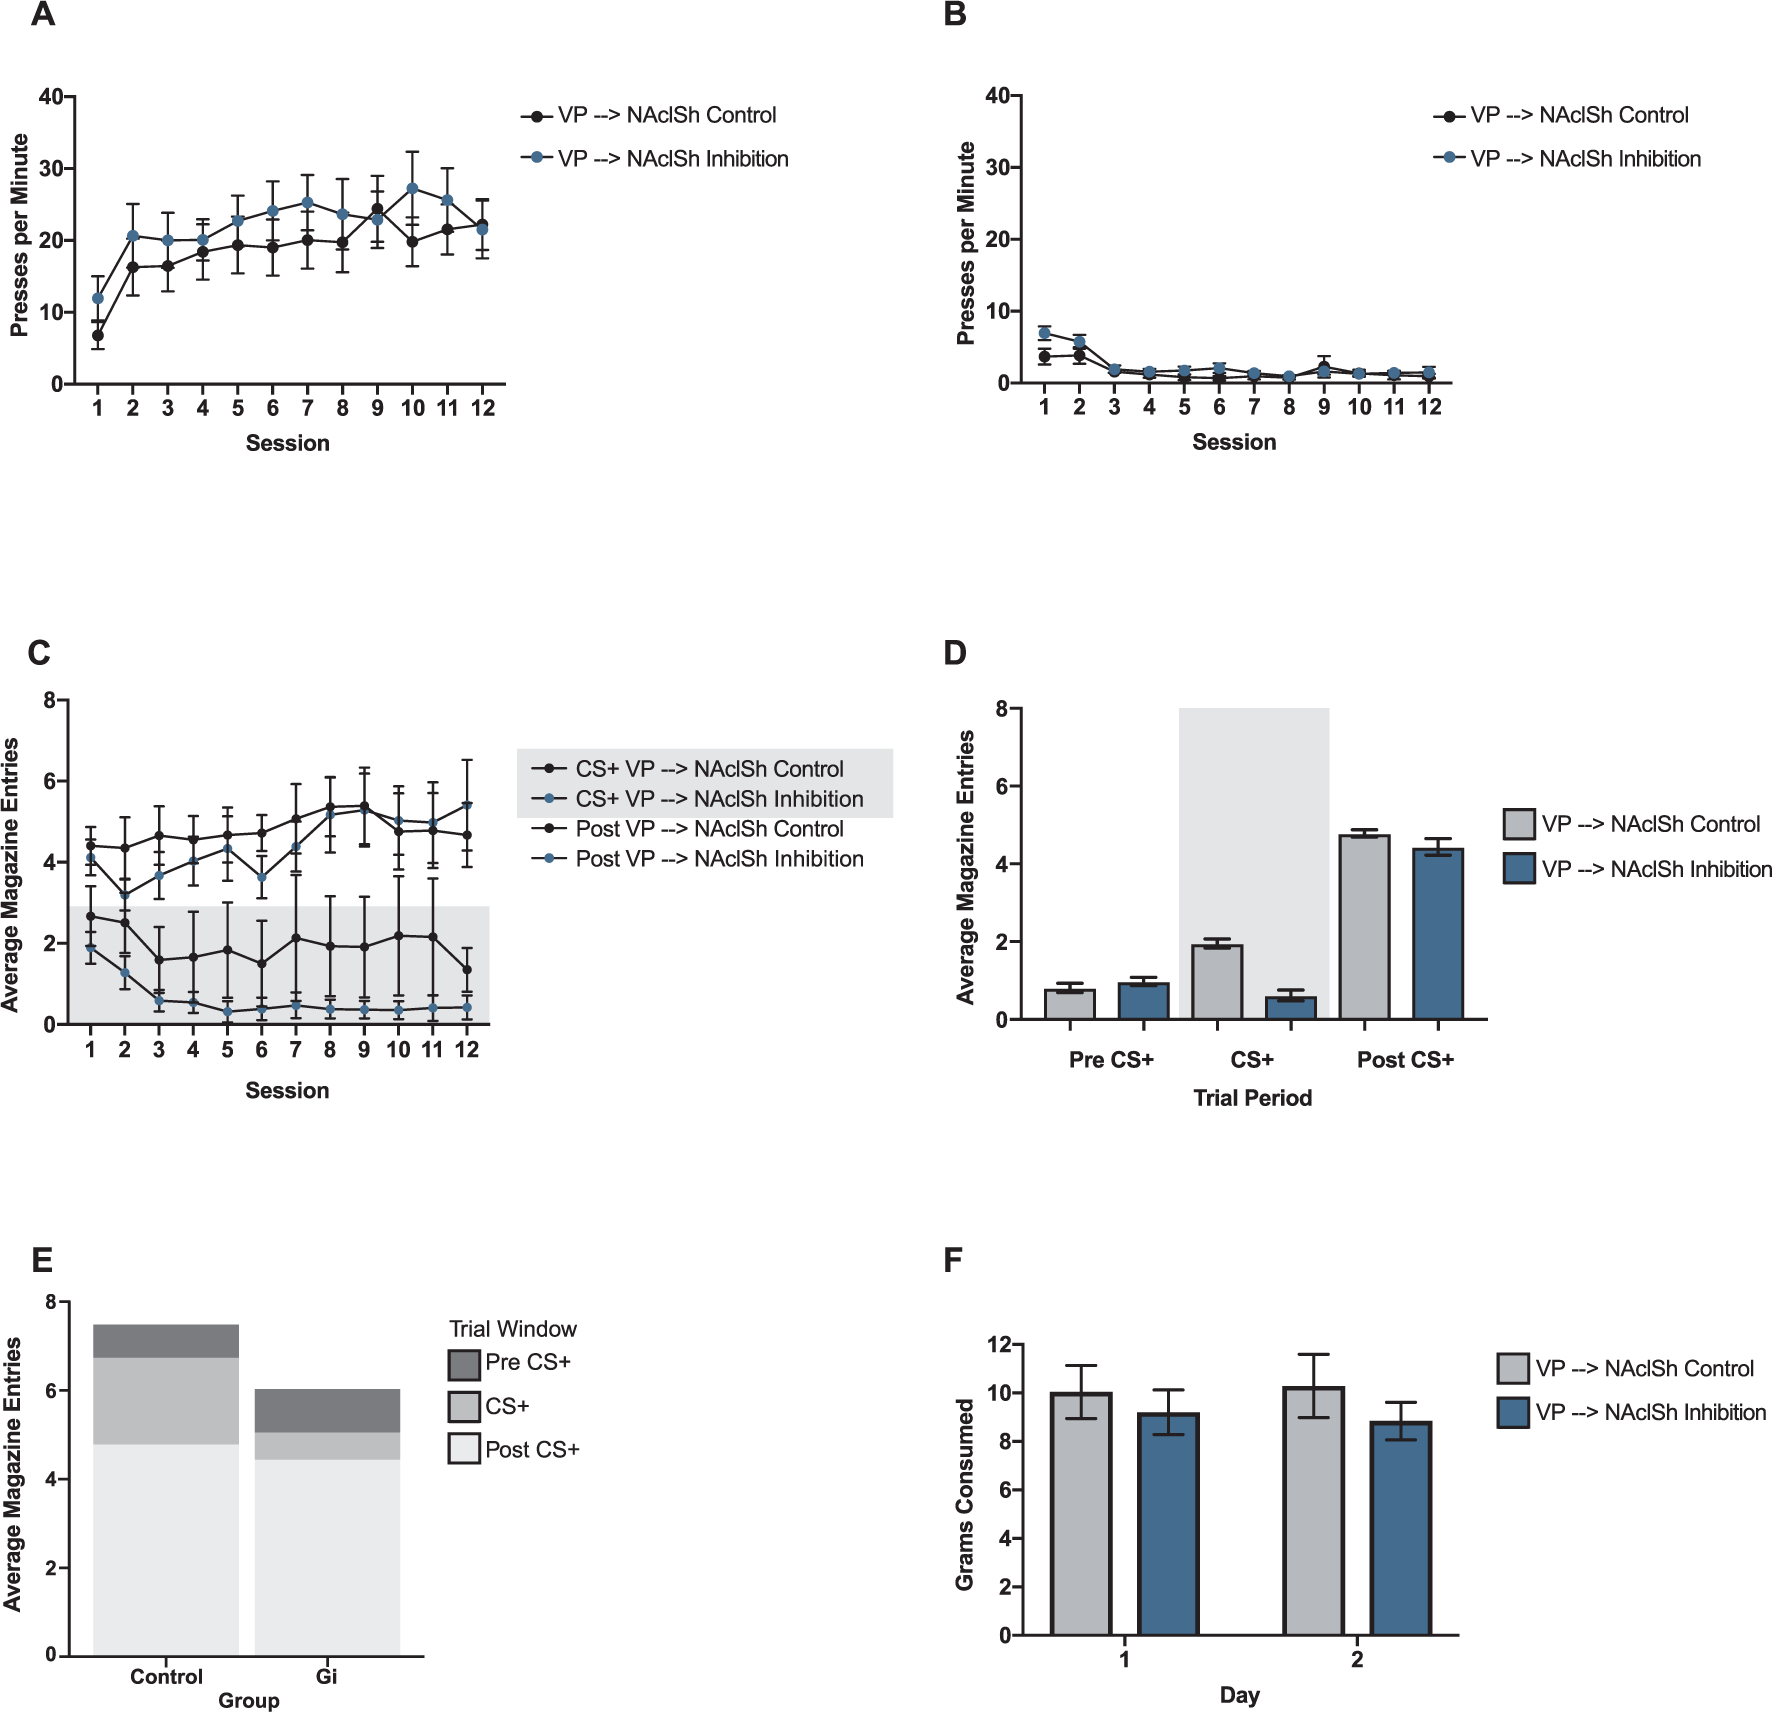
Effects of VP → NAcLSh inhibition. (A) Presses per minute (ppm) on the CS+ lever over the 12 training sessions for the VP → NAcLSh inhibition group (blue) and the VP → NAcLSh control group (black). (B) Ppm on the CS− lever for both groups. (C) Average magazine entries per session during the 10 sec CS+ presentation (shaded grey background) and the 10 sec post CS+ block (i.e., reward delivery) for both groups. (D) Average magazine entries per 10 sec block type (10 sec Pre CS+, 10 sec CS+, 10 sec Post CS+) in the VP → NAcLSh inhibition group (blue) and the VP → NAcLSh control group (grey). (E) Average magazine entries per block type in the VP → NAcLSh control group (left) VP → NAcLSh inhibition group (right) with the whole bar representing the total magazine entries made during the 30 s trial period encompassing all three blocks. (F) Grams of food consumed over the two free feeding sessions in VP → NAcLSh inhibition group (blue) and the VP → NAcLSh control group (grey). For all graphs, bars and lines show mean and errors show ± SEM.
CS+ ppm during conditioning.
The VP → NAcLSh inhibition group and the VP → NAcLSh controls did not differ in sign-tracking to the CS + lever. The VP → NAcLSh projection data of CS+ responses over time appeared non-linear in form and model fit significantly improved after addition of a quadratic fit of session (Χ2(4) = 50.9, p < 0.001) and thus were included in the final model. The same model structure for CS + ppm analysis for the opposite projection group (see above) was used here:
Results showed an insignificant main effect of group (est: −4.57 ppm; CI: −12.5–4.02; SE: 4.16; p = 0.285). A significant linear component of session (est: 3.16 ppm; CI: 0.95–5.45; SE: 1.13; p = 0.012) identified that all animals learned over training. The quadratic component of session was also significant (est: −0.176 ppm; CI: −0.34–(−0.01); p = 0.037) again indicating that animals learned to acquire CS+ responding at a similar rate. Group by linear session was not significant in analysis (est: 0.213 ppm; CI: −0.93–1.40; SE: 0.56; p = 0.705; Fig. 5A), indicating that both the VP → NAcLSh inhibition and VP → NAcLSh control groups learned at the same rate over sessions. Thus, unlike the reduced sign-tracking observed with NAcLSh → VP inhibition compared to the NAcLSh → VP controls, sign-tracking with VP → NAcLSh inhibition appeared equivalent to the VP → NAcLSh controls. Sign-tracking levels were generally lower in the VP → NAcLSh groups compared to those targeting the NAcLSh → VP, but still in a normal range based on prior studies, which highlights the importance of controls that are specific to pathways being targeted (Fig. 5A).
CS− ppm during conditioning.
A significant main effect of group showed that rats with VP → NAcLSh inhibition pressed the non-paired CS− more than the VP → NAcLSh controls. However, over sessions both groups decreased press rates similarly toward the CS−. Data appeared linear and the model of CS− responses by fixed effects of group by linear session was constructed:
There was a significant main effect of group (est: −2.02 ppm; CI: −3.79–(−0.34); SE: 0.88; p = 0.034). There was a significant main effect of linear session (est: −0.27 ppm; CI: −0.38−(−0.17); SE: 0.05; p < 0.001), indicating that all animals decreased pressing toward the CS− lever. The group by linear session interaction was not significant (est: 0.19 ppm; CI: 0.01–0.40; SE: 0.10; p = 0.063; Fig. 5A), indicating that all animals showed similar decreases in CS− press rates over sessions.
CS+ vs. CS− ppm during conditioning.
Both the VP → NAcLSh inhibition group and the VP → NAcLSh control group preferred the paired CS+ lever over the non-paired CS− lever. Press rates on the CS+ and CS− levers were compared within each group by fixed effects of time (i.e. session) and lever type (CS+ v. CS−). The following model structure is used in the next two sections.
CS+ vs. CS− ppm during conditioning: VP → NAcLSh inhibition group.
The VP → NAcLSh inhibition group preferred the CS+ lever over the CS− lever. There was a significant main effect of cue type (est: 12.4 ppm; CI: 8.24–16.6; SE: 2.11; p < 0.001) such that the CS+ was significantly preferred over the CS− in pressing behavior. There was not a significant main effect of linear session (est: 0.20 ppm; CI: −0.32–0.74; SE: 0.26; p = 0.450). However, a lever cue by session interaction was significant (est: 1.14 ppm; CI: 0.58–1.69; SE: 0.29; p < 0.001), such that rates of preference toward the CS+ lever increased over time (Fig. 5A).
CS+ vs. CS− ppm during conditioning: VP → NAcLSh site specific control group.
The VP → NAcLSh control group also preferred the CS+ lever over the CS− lever. There was a main effect of cue type (est: 9.73 ppm; CI: 6.10–13.4; SE: 1.78; p < 0.001) as confirmation of this. There was a significant main effect of session (est: 0.39 ppm; CI: 0.14–0.67; SE: 0.14; p = 0.018) and session by lever type interaction (est: 1.13 ppm; CI: 0.65–1.64; SE: 0.24; p < 0.001), indicating that control animals interacting with the CS+ lever more over time (Fig. 5A).
Magazine entries during conditioning.
Total magazine entries per session appeared linear and model fit a linear mixed model of magazine entries by group (VP → NAcLSh inhibition group and the VP → NAcLSh control group) and day with random slopes and intercepts was constructed:
The VP → NAcLSh inhibition and the VP → NAcLSh control groups did not differ in magazine entries as determined by a non-significant group effect (est: 122 entries; CI: −50.8–296; SE: 91.4; p = 0.198). Magazine entries did not change over sessions as seen in an insignificant main effect of session (est: −11.7 entries; CI: −30.0–7.27; SE: 8.76; p = 0.196). The VP → NAcLSh inhibition and the VP → NAcLSh control groups similarly maintained magazine entry rates over time as seen in an insignificant group by session interaction (est: −19.7 entries; CI: −57.3–12.8; SE: 17.5; p = 0.276; Fig. 5B).
Magazine entries during cue blocks.
Despite the lack of effect of VP → NAcLSh inhibition on sign-tracking behavior and overall magazine entries, it did lead to a difference in magazine entry distribution: the VP → NAcLSh inhibition group distributed their entries such that fewer entries were made in the CS+ presentation block and more entries in the post CS+ block compared to the VP → NAcLSh controls over sessions. The statistical model structure is the same as the opposite projection group above and includes the same cue block contrasts described above.
There was a significant main effect of group (est: 1.63 entries; CI: 0.41–2.95; SE: 0.66; p = 0.016) and linear session (est: 0.13 entries; CI: 0.06–0.20; SE: 0.03; p < 0.001). Main effects of pre-CS+ versus post-CS+ block (est: −2.64 entries; CI: −3.37−(−1.85); SE: 0.36; p < 0.001) and CS+ versus post-CS+ block (est: −2.27 entries; CI: −2.95−(−1.52); SE: 0.36; p < 0.001) were significant in that magazine entries were greatest in the post-CS+ reward block compared to the pre-CS+ and CS+ blocks (Fig. 5C and D). A group by linear session interaction was significant (est: −0.21 entries; CI: −0.33–(−0.07); SE: 0.07; p = 0.002). The group by pre-CS+ versus post-CS+ block interaction was not significant (est: −1.16 entries; CI: −2.48–0.23; SE: 0.72; p = 0.108; Fig. 5D). The group by CS+ versus post-CS+ block interaction was not significant (est: −0.94 entries; CI: −2.29–0.63; SE: 0.72; p = 0.193). All animals tended to increase magazine entries over sessions during the reward block compared to the pre-CS+ block (est: −0.17 entries; CI: −0.27−(−0.07); SE: 0.05; p < 0.001) and compared to the CS+ presentation (est: −0.18; CI: −0.27−(−0.09); SE: 0.05; p < 0.001; Fig. 5C). The three-way interaction of group by session by pre-CS+ vs. reward block was not significant (est: 0.10 entries; CI: −0.08–0.28; SE: 0.10; p = 0.307), indicating that all animals distributed their magazine entries similarly toward the post-CS+ reward block compared to the pre-CS+ block over sessions (Fig. 5C). The three-way interaction of group by session by CS+ presentation vs. reward block was significant (est: 0.33 entries; CI: 0.14–0.51; SE: 0.09; p < 0.001), indicating that over time, the VP → NAcLSh inhibition group entered the magazine less during the CS+ presentation and more during the post-CS+ reward block compared to VP → NAcLSh controls (Fig. 5C).
Free feeding.
There was no difference in food consumption during free feeding tests between animals with VP → NAcLSh inhibition and the VP → NAcLSh controls. The same model structure used in the NAcLSh → VP feeding analysis was used here:
There was not a main effect of group (est: −7.48 g; CI: −21.8–7.84; SE: 7.89; p = 0.354), meaning all animals consumed food similarly in free feeding tests. Animals remained consistent with their food intake over the two days of testing as seen in an insignificant main effect of day (est: 0.11 g; CI: −1.10; SE: 0.61; p = 0.856) and insignificant main effect of group by day (est: −0.98 g; CI: −3.61–1.53; SE: 1.23; p = 0.432). However, intriguingly, there was a main effect of weight (est: −0.028 g; CI: −0.05−(−0.01); SE: 0.01; p = 0.020) whereby animals of greater weight tended to eat slightly less. However, this effect of weight was generalized over both the VP → NAcLSh inhibition and the VP → NAcLSh control groups as seen in an insignificant group by weight interaction (est: 0.022 g; CI: −0.02–0.06; SE: 0.02; p = 0.322; Fig. 5F).
4. Discussion
To investigate the importance of NAcLsh and VP connections in the ability of reward cues to draw in motivated behavior, we used a pathway-biased chemogenetic manipulation strategy to inhibit projections from the NAcLSh to the VP, and vice versa, in a Pavlovian conditioning procedure. Inhibition of the NAcLsh → VP pathway resulted in a marked reduction of sign-tracking behavior to a CS+ lever. In stark contrast, inhibition of the reverse VP → NAcLSh pathway left sign-tracking behavior normal. However, it was not as though VP → NAcLSh inhibition was unremarkable. Those animals showed a shift over time to having greater magazine-directed behavior when reward was available after the post CS+ reward block versus to when the CS+ was presented compared to controls. Inhibition of the NAcLSh → VP instead had a greater tendency to exhibit magazine entries during the CS+ itself.
It is unlikely that the NAcLSh → VP inhibition results can be explained by a loss of the CS+ -reward association. These animals still retained their normal magazine directed behavior, some of which was CS+ -driven, and did not change their normally low level of CS− interaction. An increase in entries in the post-cue block (i.e., reward delivery) is generally expected given that this is when animals are consuming the reward. However, of interest here is the VP → NAcLSh inhibition group showing greater entries than controls during the reward period relative to the CS+ lever presentation period. And given the NAcLSh → VP animals are not interacting with the CS+ lever as much when it is presented, they tend to increase their magazine entries during the CS+ compared to controls (as control CS+ behavior is competing with their ability to enter the magazine as much). None of the sign-tracking or magazine entry effects we observed could be explained by a change in the motivational value of the food reward because free feeding behavior was unaffected by any manipulation. We hesitate to conclude that neither pathway is necessary for the motivation to eat, given that robust manipulations of either the NAcLSh or the VP can indeed affect eating behavior (e.g., Zhang & Kelley, 2000; Cromwell & Berridge, 1993). Two possibilities are either that the DREADD manipulation was subtle enough to leave other brain areas capable of driving eating behavior normally or that neither pathway is involved in free eating. In either case, the roles for other areas connected with the NAc and VP that are known to regulate eating (e.g., the lateral hypothalamus) deserve a similar circuit-based investigation. NAc projections to the lateral hypothalamus may well be an important circuit for feeding behavior.
These results for magazine entries and sign-tracking further underscore the importance of NAc/VP interactions in regulating motivated behaviors and give particular new importance to the NAcLSh → VP pathway in determining how motivationally attractive a reward-paired cue is to animals. It remains to be tested whether connections from other subregions of the NAc to the VP play a similarly important role. The NAc core and medial shell subregions participate importantly in sign-tracking behavior (Day & Carelli, 2007; Flagel et al., 2011; Cardinal et al., 2002; Singer et al., 2016; Chang, Wheeler, & Holland, 2012). Therefore, it’s possible that NAc output to the VP contributes similarly to incentive salience processes. As a potential caveat to this notion, we have recently found that a disconnection procedure to reduce communication between the NAc medial shell and VP not only failed to reduce sign-tracking, but instead increased it (Chang et al., 2018). This result was curious with respect to other studies that have shown decreases in cue-directed reward seeking and reward consumption using similar manipulations (e.g., Smith & Berridge, 2007, Leung & Balleine, 2015). Such findings collectively raise the importance of comparing NAc-VP subregional interactions across multiple motivation measures, and for comparing disconnection vs. pathway-based manipulation procedures to fully understand how NAc and VP subregions interact for motivated behavior.
Another intriguing notion that these results raise is that the NAcLSh neurons that project to the VP do not appear to require a fully intact feedback signal to affect motivation. On the conceptual side, feedback projections are a common organizational principle of the brain and it remains unclear to what extent such feedback is necessary for the function of the principle site. In the case here, we can speculate that the motivationally-relevant information conveyed form the NAcLSh to the VP does not necessarily require information to be received back from the VP to the NAcLSh. Mechanistically, there are many details yet to resolve. For instance, it is possible that the VP projections to the NAcLSh do not actually synapse on the same NAcLSh neurons that project to the VP, which would help explain the pathway dissociation here. More generally, both the NAc and VP are composed of heterogeneous cell types (Smith et al., 2009; Root et al., 2015; Bobadilla et al., 2017; Meredith & Totterdell, 1999; Yang et al., 2018), suggesting that feedforward or feedback signals between these structures will likely result in a complex mix of inhibitory and excitatory neuronal effects (Hakan, Berg, & Henriksen, 1992; Hakan, Eyl, & Henriksen, 1994; Hakan and Eyl, 1995; Heimer & Wilson, 1975; Churchill & Kalivas, 1994; Napier & Mitrovic, 1999). As such, the VP → NAcLSh DREADD manipulation here might not have led to the “relevant” sort of modulation of NAcLSh activity – whether targeting the relevant neuronal subpopulations or engaging the related activity patterns – to effect sign-tracking behavior (Gore, Schwartz, & Daniel, 2015). Nevertheless, the dissociation of NAcLSh → VP inhibition reducing sign-tracking and shifting magazine-directed behavior to the CS+ time, and VP → NAcLSh inhibition shifting magazine-directed behavior to the reward when it was presented, lays the groundwork for considering that the function of these forward and back projections might well be different for directing motivated behaviors.
Further regarding the cellular consequences of our manipulations, we cannot be certain what changes in circuit-level activity are occurring during the DREADD manipulations as both areas interact in larger circuits. It is known that CNO will reduce the activity of putative Gi-DREADD-expressing neurons in awake behaving animals (Chang et al., 2015; Smith et al., 2016). However, non-Gi-expressing neurons can also be affected locally, perhaps through interneurons or axon collaterals (Chang et al., 2015). As NAc and VP interact through bidirectional GABAergic connections, plausibly a consequence of inhibiting a pathway would be to disinhibit the recipient site. However, there are also neuromodulators involved in NAc-VP interaction, such as NAc projections targeting cholinergic neurons in VP (Churchill & Kalivas, 1994; Zahm, 2000; Zaborszky and Cullinan, 1992; Root et al., 2015; Smith et al., 2009). Thus, we must remain agnostic as to what the circuit activity changes are that relate to the behavioral effects here.
We note that the dual lever, CS+ and CS−, procedure used here seems to reliably produce an abundance of sign-tracking responses (Chang et al., 2015). Just as various CRs can occur from different forms of CSs (Holland, 1977), we speculate that the paired CS+ becomes more salient when another, explicitly unpaired, lever is presented. However, this hypothesis has not been directly tested. Another possibility could be a genetic predisposition for sign-tracking responses in the animals acquired through our vendor. However, we have also seen high rates of sign-tracking in genetically distinct, transgenic lines acquired elsewhere, on this task (unpublished observations). The sign-tracking/goal-tracking distinction that other labs find in the single CS+ condition (often with a paired cue light) reflects a behavioral tendency of animals from different genetic backgrounds (Flagel et al., 2010; Flagel et al., 2011). However, generally, the form a conditioned response takes can vary based on task conditions. Animals can be made to goal-track as a dominant response, such as if an auditory CS+ is used, or to sign-track as a dominant response, such as here by using CS +/CS− lever cues (Holland, 1997). When an animal sign-tracks – regardless of their natural tendencies – we regard them as having attributed motivational value to the lever CS+ (Berridge, 2004). Thus, we argue that animals here equivalently valued the CS+ as expressed through sign-tracking.
Finally, we acknowledge limitations of this study. We note that there is evidence that CNO metabolizes into clozapine which in turn could activate DREADD receptors or affect behavior on its own (Gomez et al., 2017; Löffler, Körber, Nubbemeyer, & Fehsel, 2012; Mahler & Aston-Jones, 2018). We additionally note that, in our data, both control groups exhibit a level of sign-tracking and magazine entry behavior that is consistent with prior lab records of behavior in animals not treated with CNO, and moreover that the lack of CNO effect in the VP → NAcLSh DREADD group compared to the positive CNO effect in the NAcLSh → VP DREADD group strongly favors the interpretation of behavior being changed as a pathway-biased result of inhibition rather than nonspecific effects of CNO/clozapine itself. Additionally, we and others have found previously that there is no effect on behavior, sign-tracking or otherwise, when DREADD receptors are expressed but a vehicle is given instead of CNO compared to when CNO is given to control-virus-expressing rats; that is, behavior is comparable when CNO or vehicle is given (Chang et al., 2015; Smith et al., 2016). Finally, we note that we did not evaluate whether behavioral effects were the result of learning or performance, and issue that deserves future attention. However, a prior study on DREADD inhibition of the VP found a reduction in sign-tracking that was related to acquisition rather than performance (Chang et al., 2015).
The results presented here further support the notion that both the NAc shell and VP are involved in cue-driven motivation. However, we show these circuits are uniquely contributing to behavior as the DREADD inhibition of NAcLSh projection to VP resulting in a decrease in sign-tracking behavior that was not present in the inhibition of the VP to NAcLSh projection. Instead, the VP → NAcLSh projection inhibition seemed to bias animal behavior toward the magazine during reward delivery. Importantly, neither projection inhibition resulted in a reduction in primary motivation to consume food rewards in free consumption test sessions. Our results call for more insight into the reciprocity and circuit dynamics of these, and adjacent areas contributing to motivation and reward processes.
Supplementary Material
Acknowledgements
We would like to thank Alex Brown for assistance with histology and the Zweifel laboratory for CAV2-zsGreen.
Funding
This work was supported by funding from The Whitehall Foundation (2014-05-77), the NIH (R01DA044199), and the NSF (IOS1557987) to KSS. The authors have no competing interests to declare.
Footnotes
Appendix A. Supplementary material
Supplementary data to this article can be found online at https://doi.org/10.1016/j.nlm.2019.05.001.
References
- Ahrens AM, Meyer PJ, Ferguson LM, Robinson TE, & Aldridge JW (2016). Neural activity in the ventral pallidum encodes variation in the incentive value of a reward cue. Journal of Neuroscience, 36, 7957–7970. [DOI] [PMC free article] [PubMed] [Google Scholar]
- Ahrens AM, Ferguson LM, Robinson TE, & Aldridge JW (2018). Dynamic encoding of incentive salience in the ventral pallidum: Dependence on the form of the reward cue. eNeuro, 5 ENEURO.0328–17.2018. [DOI] [PMC free article] [PubMed] [Google Scholar]
- Allsop SA, Wichmann R, Mills F, Burgos-Robles A, Chang CJ, Felix-Ortiz AC, et al. (2018). Corticoamygdala transfer of socially derived information gates observational learning. Cell, 173, 1329–1342.e18. [DOI] [PMC free article] [PubMed] [Google Scholar]
- Ambroggi F, Ghazizadeh A, Nicola SM, & Fields HL (2011). Roles of nucleus accumbens core and shell in incentive-cue responding and behavioral inhibition. Journal of Neuroscience, 31, 6820–6830. [DOI] [PMC free article] [PubMed] [Google Scholar]
- Bates D, Maechler M, Bolker B, & Walker S (2015). Fitting linear mixed-effects models using lme4. Journal of Statistical Software, 67, 1–48. [Google Scholar]
- Batten SR, Pomerleau F, Quintero J, Gerhardt GA, & Beckmann JS (2018). The role of glutamate signaling in incentive salience: Second-by-second glutamate recordings in awake Sprague-Dawley rats. Journal of Neurochemistry, 145, 276–286. [DOI] [PMC free article] [PubMed] [Google Scholar]
- Berridge KC (2004). Motivation concepts in behavioral neuroscience. Physiology & Behavior, 81, 179–209. [DOI] [PubMed] [Google Scholar]
- Berridge KC, & Robinson TE (2003). Parsing reward. Trends in Neurosciences, 26, 507–513. [DOI] [PubMed] [Google Scholar]
- Boakes R (1977). Performance on learning to associate a stimulus with positive reinforcement In Davis H & Hurwitz H (Eds), Operant-Pavlovian Interactions. Lawrence Erlbaum Associates, Hillsdale, NJ, pp. 67–97. [Google Scholar]
- Bobadilla AC, Heinsbroek JA, Gipson CD, Griffin WC, Fowler CD, Kenny PJ, et al. (2017). Corticostriatal plasticity, neuronal ensembles, and regulation of drug-seeking behavior. Progress in Brain Research, 235, 93–112. [DOI] [PMC free article] [PubMed] [Google Scholar]
- Boender AJ, de Jong JW, Boekhoudt L, Luijendijk MCM, van der Plasse G, et al. (2014). Combined use of the canine adenovirus-2 and DREADD-technology to activate specific neural pathways in vivo. PLOS ONE, 9, e95392. [DOI] [PMC free article] [PubMed] [Google Scholar]
- Brog JS, Salyapongse A, Deutch AY, & Zahm DS (1993). The patterns of afferent innervation of the core and shell in the “accumbens” part of the rat ventral striatum: Immunohistochemical detection of retrogradely transported fluoro-gold. The Journal of Comparative Neurology, 338, 255–278. [DOI] [PubMed] [Google Scholar]
- Brown PL, & Jenkins HM (1968). Auto-shaping of the pigeon’s key-peck. Journal of the Experimental Analysis of Behavior, 11, 1–8. [DOI] [PMC free article] [PubMed] [Google Scholar]
- Cardinal RN, Parkinson JA, Lachenal G, Halkerston KM, Rudarakanchana N, Hall J, et al. (2002). Effects of selective excitotoxic lesions of the nucleus accumbens core, anterior cingulate cortex, and central nucleus of the amygdala on autoshaping performance in rats. Behavioral Neuroscience, 116, 553–567. [DOI] [PubMed] [Google Scholar]
- Carter ME, Soden ME, Zweifel LS, & Palmiter RD (2013). Genetic identification of a neural circuit that suppresses appetite. Nature, 503, 111–114. [DOI] [PMC free article] [PubMed] [Google Scholar]
- Chang SE, Wheeler DS, & Holland PC (2012). Roles of nucleus accumbens and basolateral amygdala in autoshaped lever pressing. Neurobiology of Learning and Memory, 97, 444–451. [DOI] [PMC free article] [PubMed] [Google Scholar]
- Chang SE, & Holland PC (2013). Effects of nucleus accumbens core and shell lesions on autoshaped lever-pressing. Behavioural Brain Research, 256, 36–42. [DOI] [PMC free article] [PubMed] [Google Scholar]
- Chang SE, & Smith KS (2016). An omission procedure reorganizes the microstructure of sign-tracking while preserving incentive salience. Learning & Memory, 23, 151–155. [DOI] [PMC free article] [PubMed] [Google Scholar]
- Chang SE, Todd TP, Bucci DJ, & Smith KS (2015). Chemogenetic manipulation of ventral pallidal neurons impairs acquisition of sign-tracking in rats. European Journal of Neuroscience, 42, 3105–3116. [DOI] [PMC free article] [PubMed] [Google Scholar]
- Chang SE, Todd TP, & Smith KS (2018). Paradoxical accentuation of motivation following accumbens-pallidum disconnection. Neurobiology of Learning and Memory, 149, 39–45. [DOI] [PMC free article] [PubMed] [Google Scholar]
- Churchill L, & Kalivas PW (1994). A topographically organized gamma-aminobutyric acid projection from the ventral pallidum to the nucleus accumbens in the rat. Journal of Comparative Neurology, 345, 579–595. [DOI] [PubMed] [Google Scholar]
- Cromwell HC, & Berridge KC (1993). Where does damage lead to enhanced food aversion: The ventral pallidum/substantia innominata or lateral hypothalamus? Brain Research, 624, 1–10. [DOI] [PubMed] [Google Scholar]
- Day JJ, & Carelli RM (2007). The nucleus accumbens and Pavlovian reward learning. Neuroscientist, 13, 148–159. [DOI] [PMC free article] [PubMed] [Google Scholar]
- Day JJ, Wheeler RA, Roitman MF, & Carelli RM (2006). Nucleus accumbens neurons encode Pavlovian approach behaviors: Evidence from an autoshaping paradigm. European Journal of Neuroscience, 23, 1341–1351. [DOI] [PubMed] [Google Scholar]
- Deutch AY, & Cameron DS (1993). Pharmacological characterization of dopamine systems in the nucleus accumbens core and shell. Neuroscience, 46, 49–56. [DOI] [PubMed] [Google Scholar]
- Flagel SB, Clark JJ, Robinson TE, Mayo L, Czuj A, Akers Ca, et al. (2011). A selective role for dopamine in reward learning. Nature, 469, 53–57. [DOI] [PMC free article] [PubMed] [Google Scholar]
- Flagel SB, & Robinson TE (2017). Neurobiological basis of individual variation in stimulus-reward learning. Current Opinion in Behavioral Sciences, 13, 178–185. [DOI] [PMC free article] [PubMed] [Google Scholar]
- Flagel SB, Robinson TE, Clark JJ, Clinton SM, Watson SJ, Seeman P, et al. (2010). An animal model of genetic vulnerability to behavioral disinhibition and responsiveness to reward-related cues: Implications for addiction. Neuropsychopharmacology, 35, 388–400. [DOI] [PMC free article] [PubMed] [Google Scholar]
- Gibbons RD, Hedeker D, & DuToit S (2010). Advances in analysis of longitudinal data. Annual Reviews in Clinical Psychology, 6, 79–107. [DOI] [PMC free article] [PubMed] [Google Scholar]
- Gore F, Schwartz EC, & Daniel Salzman C. (2015). Manipulating neural activity in physiologically classified neurons: Triumphs and challenges. Philosophical Transactions of the Royal Society B, 370. [DOI] [PMC free article] [PubMed] [Google Scholar]
- Gomez JL, Bonaventura J, Lesniak W, Mathews WB, Sysa-shah P, Rodriguez LA, et al. (2017). Chemogenetics revealed: DREADD occupancy and activation via converted clozapine. Science, 507, 503–507. [DOI] [PMC free article] [PubMed] [Google Scholar]
- Groenewegen HJ, & Russchen FT (1984). Organization of the efferent projections of the nucleus accumbens to pallidal, hypothalamic, and mesencephalic structures: A tracing and immunohistochemical study in the cat. The Journal of Comparative Neurology, 223, 347–367. [DOI] [PubMed] [Google Scholar]
- Hakan RL, Berg GI, & Henriksen SJ (1992). Electrophysiological evidence for reciprocal connectivity between the nucleus accumbens septi and ventral pallidal region. Brain Research, 581, 344–350. [DOI] [PubMed] [Google Scholar]
- Hakan RL, Eyl C, & Henriksen SJ (1994). Neuropharmacology of the nucleus accumbens: Systemic morphine effects on single-unit responses evoked by ventral pallidum stimulation. Neuroscience, 63, 85–93. [DOI] [PubMed] [Google Scholar]
- Hakan RL, & Eyl C (1995). Neuropharmacology of the nucleus accumbens: Iontophoretic applications of morphine and nicotine have contrasting effects on single-unit responses evoked by ventral pallidal and fimbria stimulation. Synapse, 20, 175–184. [DOI] [PubMed] [Google Scholar]
- Heimer L, Zahm DS, Churchill L, Kalivas PW, & Wohltmann C (1991). Specificity in the projection patterns of accumbal core and shell in the rat. Neuroscience, 41, 89–125. [DOI] [PubMed] [Google Scholar]
- Heimer L, Wilson RD (1975). The subcortical projections of allocortex: Similarities in the neuronal associations of the hippocampus, the piriform cortex and the neocortex In Santini M (Ed.) Golgi Centennial Symposium Proceedings (pp. 173–93). Raven Press: New York. [Google Scholar]
- Heimer L, Alheid GF, de Olmos JS, Groenewegen HJ, Haber SN, Harlan RE, et al. (1997). The accumbens: Beyond the core-shell dichotomy. The Journal of Neuropsychiatry and Clinical Neurosciences, 9, 354–381. [DOI] [PubMed] [Google Scholar]
- Holland P (1977). Conditioned stimulus as a determinant of the form of the Pavlovian conditioned response. Journal of Experimental Psychology: Animal Behavior Processes, 3, 77–104. [DOI] [PubMed] [Google Scholar]
- Jenkins HM, & Moore BR (1973). The form of the auto-shaped response with food or water reinforcers. Journal of the Experimental Analysis of Behavior, 20, 163–181. [DOI] [PMC free article] [PubMed] [Google Scholar]
- Kuo H, & Chang HT (1992). Ventral pallido-striatal pathway in the rat brain: A light and electron microscopic study. Journal of Comparative Neurology, 321, 626–636. [DOI] [PubMed] [Google Scholar]
- Kuznetsova A, Brockhoff PB, Christensen RHB (2015). lmerTest: Tests in Linear Mixed Effects Models. R package version 2.0–33. [Google Scholar]
- Lammel S, Lim BK, Ran C, Huang KW, Betley MJ, Tye KM, et al. (2012). Input-specific control of reward and aversion in the ventral tegmental area. Nature, 491, 212–217. [DOI] [PMC free article] [PubMed] [Google Scholar]
- Leung BK, & Balleine BW (2015). Ventral pallidal projections to mediodorsal thalamus and ventral tegmental area play distinct roles in outcome-specific Pavlovian-instrumental transfer. Journal of Neuroscience, 35, 4953–4964. [DOI] [PMC free article] [PubMed] [Google Scholar]
- Löffler S, Körber J, Nubbemeyer U, & Fehsel K (2012). Comment on “Impaired respiratory and body temperature control upon acute serotonergic neuron inhibition”. Science, 337, 646. [DOI] [PubMed] [Google Scholar]
- Mahler SV, & Aston-Jones GS (2012). Fos activation of selective afferents to ventral tegmental area during cue-induced reinstatement of cocaine seeking in rats. Journal of Neuroscience, 32, 13309–13325. [DOI] [PMC free article] [PubMed] [Google Scholar]
- Mahler SV, & Aston-Jones GS (2018). CNO evil? Consideration for the use of DREADDs in behavioral neuroscience. Neuropsychopharmacology, 43, 934–936. [DOI] [PMC free article] [PubMed] [Google Scholar]
- Meredith GE, & Totterdell S (1999). Microcircuits in nucleus accumbens’ shell and core involved in cognition and reward. Psychobiology, 27, 165–186. [Google Scholar]
- Mogenson GJ, Jones DL, & Yim CY (1980). From motivation to action: Functional interface between the limbic system and the motor system. Progress in Neurobiology, 14, 69–97. [DOI] [PubMed] [Google Scholar]
- Nair SG, Strand NS, & Neumaier JF (2013). DREADDing the lateral habenula: A review of methodological approaches for studying lateral habenula function. Brain Research, 1511, 93–101. [DOI] [PMC free article] [PubMed] [Google Scholar]
- Napier TC, & Mitrovic I (1999). Opioid modulation of ventral pallidal inputs. Annals of the New York Academy of Sciences, 877, 176–201. [DOI] [PubMed] [Google Scholar]
- Paxinos G, & Watson C (2009). The Rat Brain in Stereotaxic Coordinates. San Diego, CA: Academic Press. [Google Scholar]
- Richard JM, Ambroggi F, Janak PH, Fields HL, Francisco S, & Sciences B (2016). Ventral pallidum neurons encode incentive value and promote cue-elicited instrumental actions. Neuron, 90, 1165–1173. [DOI] [PMC free article] [PubMed] [Google Scholar]
- R. Core Team, 2016. R: a Language and Environment for Statistical Computing R Foundation for Statistical Computing, Vienna, Austria. [Google Scholar]
- Robinson MJF, & Berridge KC (2013). Instant transformation of learned repulsion into motivational ‘wanting’. Current Biology, 23, 282–289. [DOI] [PMC free article] [PubMed] [Google Scholar]
- Root DH, Melendez RI, Zaborszky L, & Napier TC (2015). The ventral pallidum: Subregion-specific functional anatomy and roles in motivated behaviors. Progress in Neurobiology, 130, 29–70. [DOI] [PMC free article] [PubMed] [Google Scholar]
- Saunders BT, & Robinson TE (2012). The role of dopamine in the accumbens core in the expression of Pavlovian conditioned responses. European Journal of Neuroscience, 36, 2521–2532. [DOI] [PMC free article] [PubMed] [Google Scholar]
- Senn V, Wolff SBE, Herry C, Grenier F, Ehrlich I, Gründemann J, et al. (2014). Long-range connectivity defines behavioral specificity of amygdala neurons. Neuron, 81, 428–437. [DOI] [PubMed] [Google Scholar]
- Singer BF, Bryan MA, Popov P, Scarff R, Carter C, Wright E, et al. (2016). The sensory features of a food cue influence its ability to act as an incentive stimulus and evoke dopamine release in the nucleus accumbens core. Learning & Memory, 23, 595–606. [DOI] [PMC free article] [PubMed] [Google Scholar]
- Smedley EB, & Smith KS (2018a). Evidence of structure and persistence in motivational attraction to serial Pavlovian cues. Learning & Memory, 25, 78–89. [DOI] [PMC free article] [PubMed] [Google Scholar]
- Smedley EB, & Smith KS (2018b). Evidence for a shared representation of sequential cues that engage sign-tracking. Behavioral Processes, 157, 489–494. [DOI] [PMC free article] [PubMed] [Google Scholar]
- Smith KS, Berridge KC, & Aldridge JW (2011). Disentangling pleasure from incentive salience and learning signals in brain reward circuitry. Proceedings of the National Academy of Sciences of the United States of America, 108, E255–E264. [DOI] [PMC free article] [PubMed] [Google Scholar]
- Smith KS, Bucci DJ, Luikart BW, & Mahler SV (2016). DREADs: Use and application in behavioral neuroscience. Behavioral Neuroscience, 130, 137–155. [DOI] [PMC free article] [PubMed] [Google Scholar]
- Smith KS, & Berridge KC (2007). Opioid limbic circuit for reward: Interaction between hedonic hotspots of nucleus accumbens and ventral pallidum. Journal of Neuroscience, 27, 1594–1605. [DOI] [PMC free article] [PubMed] [Google Scholar]
- Smith KS, Tindell AJ, Aldridge JW, & Berridge KC (2009). Ventral pallidum roles in reward and motivation. Behavioural Brain Research, 196, 155–167. [DOI] [PMC free article] [PubMed] [Google Scholar]
- Stratford TR, & Kelley AE (1997). GABA in the nucleus accumbens shell participates in the central regulation of feeding behavior. The Journal of Neuroscience, 17, 4434–4440. [DOI] [PMC free article] [PubMed] [Google Scholar]
- Tindell AJ, Berridge KC, Zhang J, Peciña S, & Aldridge JW (2005). Ventral pallidal neurons code incentive motivation: Amplification by mesolimbic sensitization and amphetamine. European Journal of Neuroscience, 22, 2617–2634. [DOI] [PubMed] [Google Scholar]
- Tindell AJ, Smith KS, Berridge KC, & Aldridge JW (2009). Dynamic computation of incentive salience: ‘wanting’ what was never ‘liked’. The Journal of Neuroscience, 29(39), 12220–12228. [DOI] [PMC free article] [PubMed] [Google Scholar]
- van Dongen YC, Deniau JM, Pennartz CMA, Galis-de Graaf Y, Voorn P, Thierry AM, et al. (2005). Anatomical evidence for direct connections between the shell and core subregions of the rat nucleus accumbens. Neuroscience, 136, 1049–1071. [DOI] [PubMed] [Google Scholar]
- Wan X, & Peoples LL (2008). Amphetamine exposure enhances accumbal responses to reward-predictive stimuli in a pavlovian conditioned approach task. The Journal of Neuroscience, 28, 7501–7512. [DOI] [PMC free article] [PubMed] [Google Scholar]
- Yang H, de Jong JW, Tak Y, Peck J, Bateup HS, & Lammel S (2018). Nucleus accumbens subnuclei regulate motivated behavior via direct inhibition and disinhibition of VTA dopamine subpopulations. Neuron, 97, 1–16. [DOI] [PMC free article] [PubMed] [Google Scholar]
- Záborszky L, Alheid GF, Beinfeld MC, Eiden LE, Heimer L, & Palkovits M (1985). Cholecystokinin innervation of the ventral striatum: A morphological and radioimmunological study. Neuroscience, 14, 427–453. [DOI] [PubMed] [Google Scholar]
- Záborszky L, & Cullinan WE (1992). Projections from the nucleus accumbens to cholinergic neurons of the ventral pallidum: A correlated light and electron microscope double-immunolableing study in rat. Brain Research, 570, 92–101. [DOI] [PubMed] [Google Scholar]
- Zahm DS (1999). Functional-anatomical implications of the nucleus accumbens core and shell subterritories. Annals of the New York Academy of Sciences, 877, 113–128. [DOI] [PubMed] [Google Scholar]
- Zahm DS (2000). An integrative neuroanatomical perspective on some sub- cortical substrates of adaptive responding with emphasis on the nucleus accumbens. Neuroscience & Biobehavioral Reviews, 24, 85–105. [DOI] [PubMed] [Google Scholar]
- Zahm DS, & Brog JS (1992). On the significance of subterritories in the “accumbens” part of the rat ventral striatum. Neuroscience, 50, 751–767. [DOI] [PubMed] [Google Scholar]
- Zhang M, & Kelley AE (2000). Enhanced intake of high-fat food following striatal muopioid stimulation: Microinjection mapping and Fos expression. Neuroscience, 99, 267–277. [DOI] [PubMed] [Google Scholar]
Associated Data
This section collects any data citations, data availability statements, or supplementary materials included in this article.