Abstract
Retinotopic mapping, the mapping of visual input on the retina to cortical neurons, is an important topic in vision science. Typically, cortical neurons are related to visual input on the retina using functional magnetic resonance imaging (fMRI) of cortical responses to slowly moving visual stimuli on the retina. Although it is well known from neurophysiology studies that retinotopic mapping is locally diffeomorphic (i.e., smooth, differentiable, and invertible) within each local area, the retinotopic maps from fMRI are often not diffeomorphic, especially near the fovea, because of the low signal-noise ratio of fMRI. The aim of this study is to develop and solve a mathematical model that produces diffeomorphic retinotopic mapping from fMRI data. Specifically, we adopt a geometry concept, the Beltrami coefficient, as the tool to define diffeomorphism, and model the problem in an optimization framework. Efficient numerical methods are proposed to solve the model. Experimental results with both synthetic and real retinotopy data demonstrate that the proposed method is superior to conventional smoothing methods.
Index Terms—: Retinotopic Mapping, Diffeomorphic Smoothing, Beltrami Coefficient
1. INTRODUCTION
Almost half of the human cerebral cortex is dedicated to visual processing. Identifying and analyzing visual areas of the human brain is an extremely important topic in vision science and neurobiology [1]. Retinotopic mapping via functional magnetic resonance imaging (fMRI) provides a noninvasive way of defining the location and size of receptive filed of populations of visual neurons on the retina [2]. Typically, cortical neurons are related to visual input on the retina using fMRI of cortical responses to slowly moving visual stimuli on the retina. The visual stimulus is carefully designed so that the stimulus pattern is unique with respect to each retinal location [3, 4]. By recording and analyzing the fMRI signals at each cortical location, one can decode the best retinal visual input coordinate that generates such fMRI signals [2, 5]. Previous studies have revealed that much of the visual cortex is organized into visual regions (e.g., V1, V2) with a retinotopic map in each region [6]. It is well known from neurophysiology studies that retinotopic mapping is topology preserving (i.e., local neighborhood relationships are maintained) and diffeomorphic (i.e., smooth, differentiable, and invertible) within each visual area [7, 8]. However, the decoded visual coordinates from fMRI retinotopic mapping studies are not guaranteed to be diffeomorphic or topological preserving. One reason is the signal-noise ratio and spatial resolution of fMRI signals are low. Another reason is that the decoding process largely deciphers the fMRI signal point by point without considering the local smoothness, although Gaussian spatial smoother has been applied to fMRI signal processing [9].
Some have conducted spatial smoothing on retinotopic maps to perform automatic delineation of visual regions [10, 7]. However, the smoothing is applied to the visual coordinates one dimension at a time, e.g., the x and y visual coordinates separately. There is no guarantee of diffeomorphism. Another promising approach is registering the noisy retinotopic maps to a diffeomorphic template and assigning the template retinotopic coordinates after registration [11]. It relies on diffeomorphic registration of two surfaces, which is not easy to achieve. Even if the registration issue can be solved, how to define the right template will remain a big problem.
Can we pursuit a spatial smoother specifically designed for retinotopic mapping which generates new diffeomorphic visual coordinate close to the raw coordinate? It is easy (e.g., use Euclidean distance) to measure coordinate changes during the smoothing process, the crucial question is how to define, quantify, and ensure the diffeomorphic condition.
In this work, we adopt the Beltrami coefficient to quantify the diffeomorphism as it also quantifies angle deviation. The reason we care angle deviation is that previous work shows retinotopic mappings preserve angles to a considerable extent [12, 13]. We further model the smoothing process as an optimization procedure with diffeomorphic constraints and elaborate the numerical steps to solve the optimization problem. We tested our algorithm on a synthetic dataset and a real dataset. The synthetic data is generated using an ideal retinotopic mapping model (ground truth) with added noise. The application of our proposed method to the synthetic data generates diffeomorphic results without any big deviations, while other methods violate the condition. The real dataset is the Human Connectome Project 7T retinotopy (HCP) data [14]. We also achieved diffeomorphic retinotopic mapping. In addition, we obtained Beltrami coefficients that quantify angle distortions for each subject. Our method guarantees diffeomorphic results and minimizes the angle distortion, two important conditions for a valid retinotopic mapping research.
2. PROBLEM RESTATEMENT
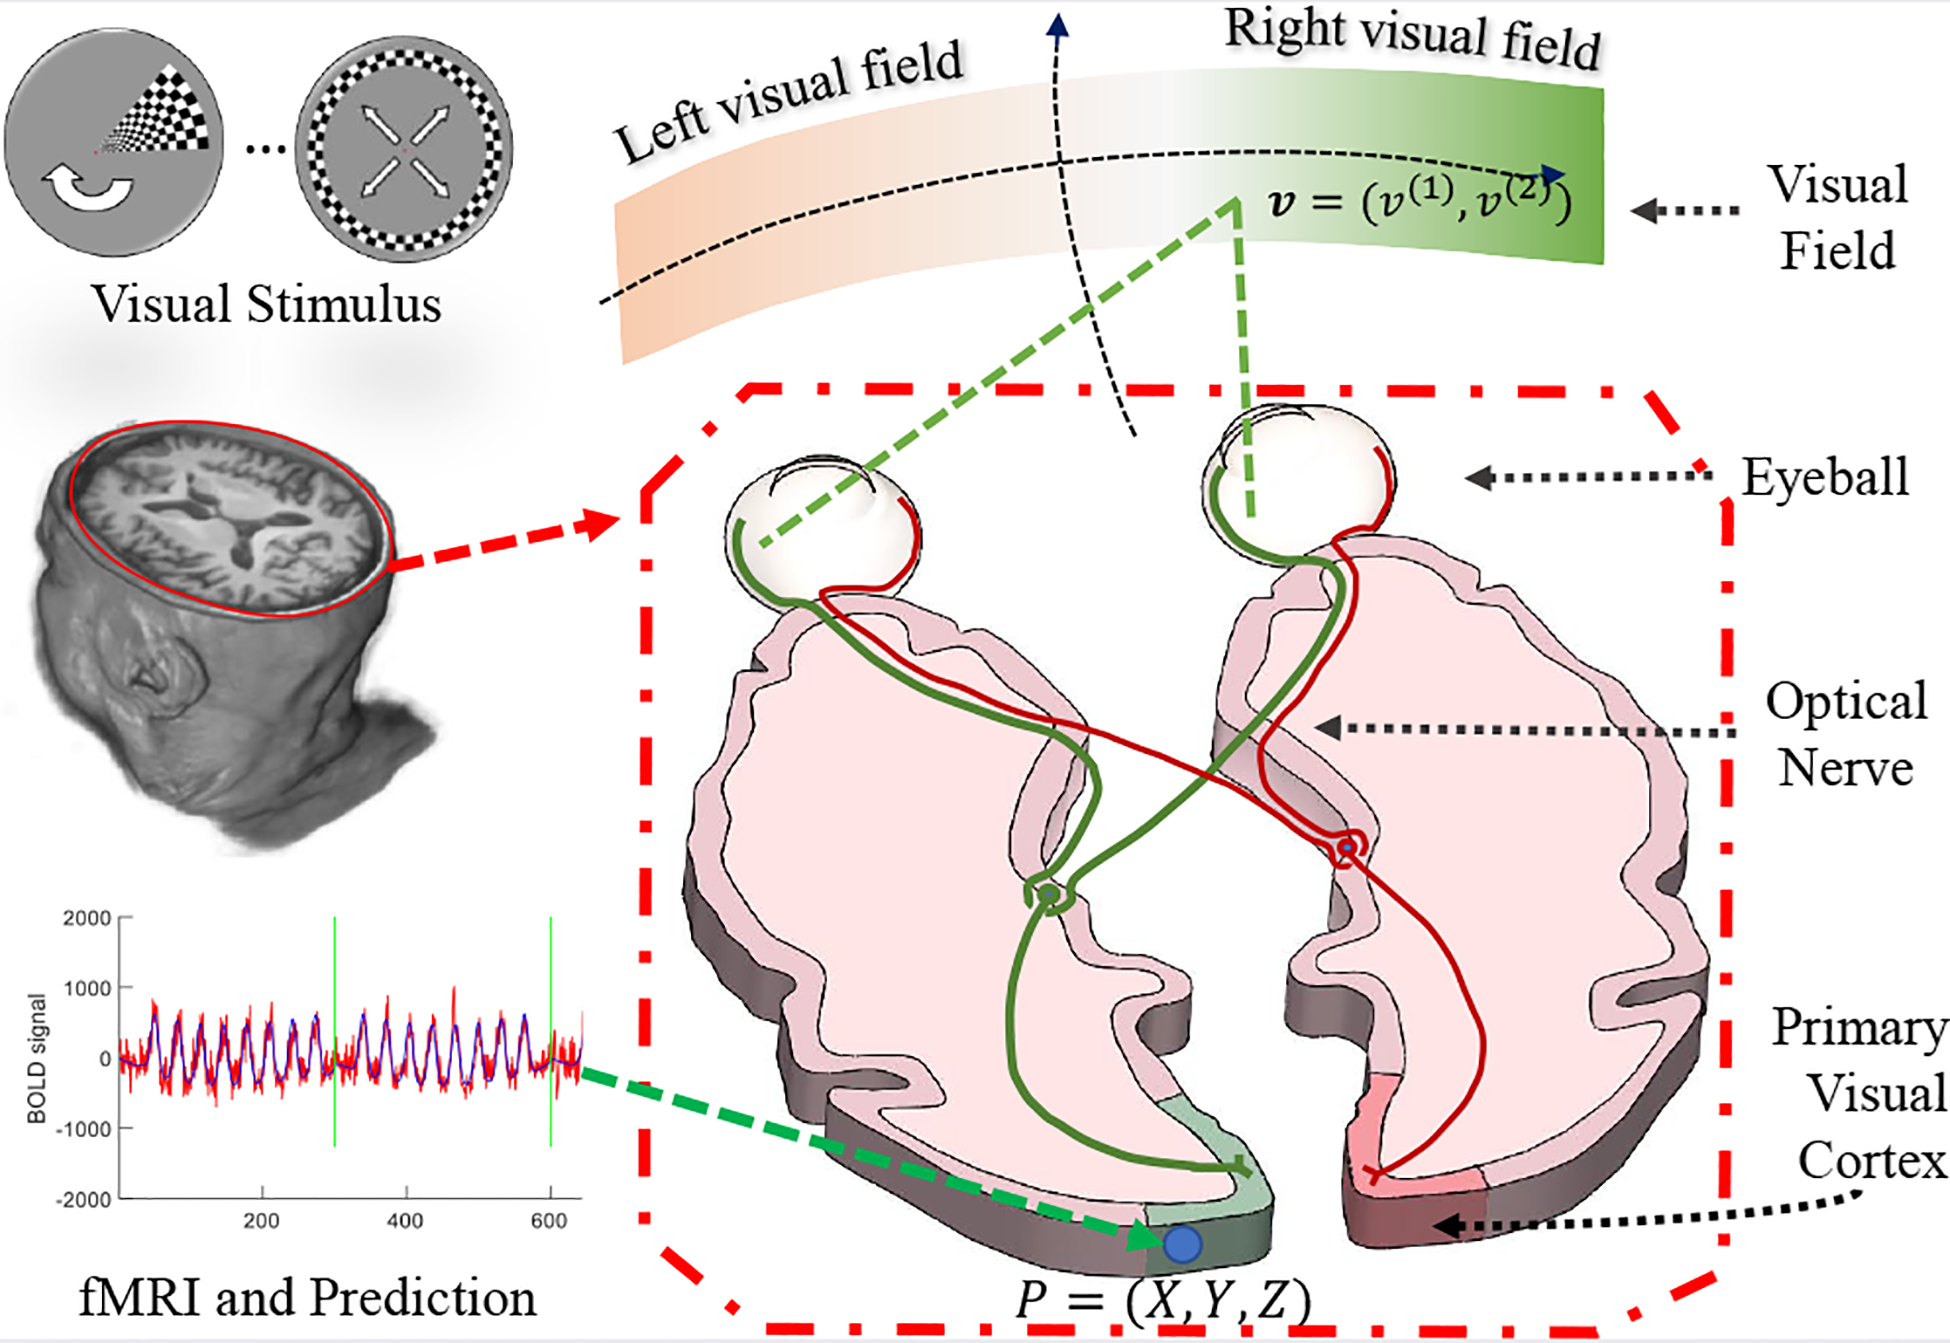
We restate the problem in a biological intuitive and mathematically rigorous way. Assume there is a light spot on point in the visual field, as shown in Fig. 1. After the visual system’s perception, propagation, and dispensation, the light spot will eventually active a population of neurons. The main purpose of retinotopic mapping is to find the center v and the extent of its receptive field on the retina, for each point on visual cortex.
Fig. 1.

Illustration of visual system to the visual cortex.
fMRI provides a noninvasive way to determine v and σ for P, based on the following procedure. (1) Design a stimulus time sequence s (t; v), such that the stimulus sequence is unique for every visual coordinate, i.e., s (t; v1) ≠ s (t; v2), ∀ v1 ≠ v2; (2) Present the stimulus sequence to an individual and record the fMRI signals from the visual cortex; (3) For each fMRI time sequence on a cortical location, y (t; P), determine the corresponding receptive field, including its center location v and its size σ on the retina, that most-likely generated the fMRI signals. Specifically, given the neurons’ spatial response r (v′; v, σ) (a predefined model depicts neural response around v) and the hemodynamic function h (t) (a model of the time course of neural activation to a stimulus), the predicted fMRI signal can be written as:
| (1) |
where, β is a coefficient that converts the units of response to the unit of fMRI activation. Then the parameters v and σ are given by minimizing the prediction error,
| (2) |
The retinotopic mapping of the entire visual cortex is obtained when (v, σ) is solved for every point on the cortical surface. Previous work has shown that nearby visual cortex will share nearby visual coordinates, i.e., topology preserving [15, 11, 16]. The notion retinotopic mapping preserves topology means that, if f is the retinotopic mapping, f : P ↦ v, then a neighboring point P′ of P, will have visual coordinate v′ close to v. That is, f is diffeomorphic in the domain of cortical surface.
Unfortunately, due to the low signal-noise ratio of fMRI, f is not guaranteed to be diffeomorphic. We propose a diffeomorphic smoothing on f, such that the new mapping is diffeomorphic and is close to v. We adopt the Beltrami coefficient [17] to quantify the diffeomorphism,
| (3) |
where is the metric tensor. If ∣μf∣< 1 then f is diffeomorphic. Furthermore, the bigger ∣μf∣ is, the larger angle deviation is. Therefore, the diffeomorphism defined in this way also provides a measure of angle deviation. We aim to find , such that,
| (4) |
3. MODEL AND METHOD
3.1. Model in Discrete
In practice, cortical surface S is usually not an analytical function but consists of a bunch of vertices VS and triangular faces FS, i.e. S = (FS, VS). Similarly, visual space can also be discretized. Instead of taking another discretization, it is beneficial to take the same discretization as S. Then, the remaining problem is to find a visual coordinate vi for every vertex Pi ∈ VS.
It is easier to discuss and solve problems on 2D instead of the original 3D cortical surface. Since diffeomorphism is transitive (If f and c are both diffeomorphic function, then the composite function f ○ c is also diffeomorphic), we can compute a conformal mapping (diffeomorphic and angle preserving) from the occipital region of the cortex to a parametric disk [18] to simplify the problem to 2D. As shown in Fig. 2. the gray colored region is mapped to the unit disk by . Although conformal mapping is angle preserving, it introduces distance distortion. To reduce the distortion, we cut a geodesic disk patch: pick a point on the cortical surface that corresponds to the fovea as the center point, then we calculate the geodesic distances from all cortical position to the center point [19] and only keep the portion of cortical surface whose geodesic distance to the center point is within a certain value. If we can solve with constraint , then we can obtain diffeomorphic retinotopic mapping by f = fc ○ c. Accordingly, we simplify Eq. (4) to,
| (5) |
To solve Eq. (5) in discrete, we form the energy as,
| (6) |
where Fi = fc (ui) is the raw result from Eq. (2), is to be solved, is the Beltrami coefficient at ui, λ1 and λ2 are constants. Compared to Eq. (5), gradient of , , is introduced to increase smoothness, and ∣μi∣2 is used to reduce non-diffeomorphism as well as angle distortion.
Fig. 2.

Illustration of several spaces and relations between them.
3.2. Numerical Method
Unfortunately, it is hard to minimize the energy in Eq. (6) directly, as it mixes the Beltrami coefficient and the mapping function together. The solution is to alternatively solv with respect to function and Beltrami coefficient in separate steps. Unavoidably, we need tools to convert the mapping function and Beltrami coefficient back and forth.
3.2.1. Beltrami Coefficient
Since we have a parametric coordinate u for the cortical surface S, the definition, Eq. (3), can be simplified to,
| (7) |
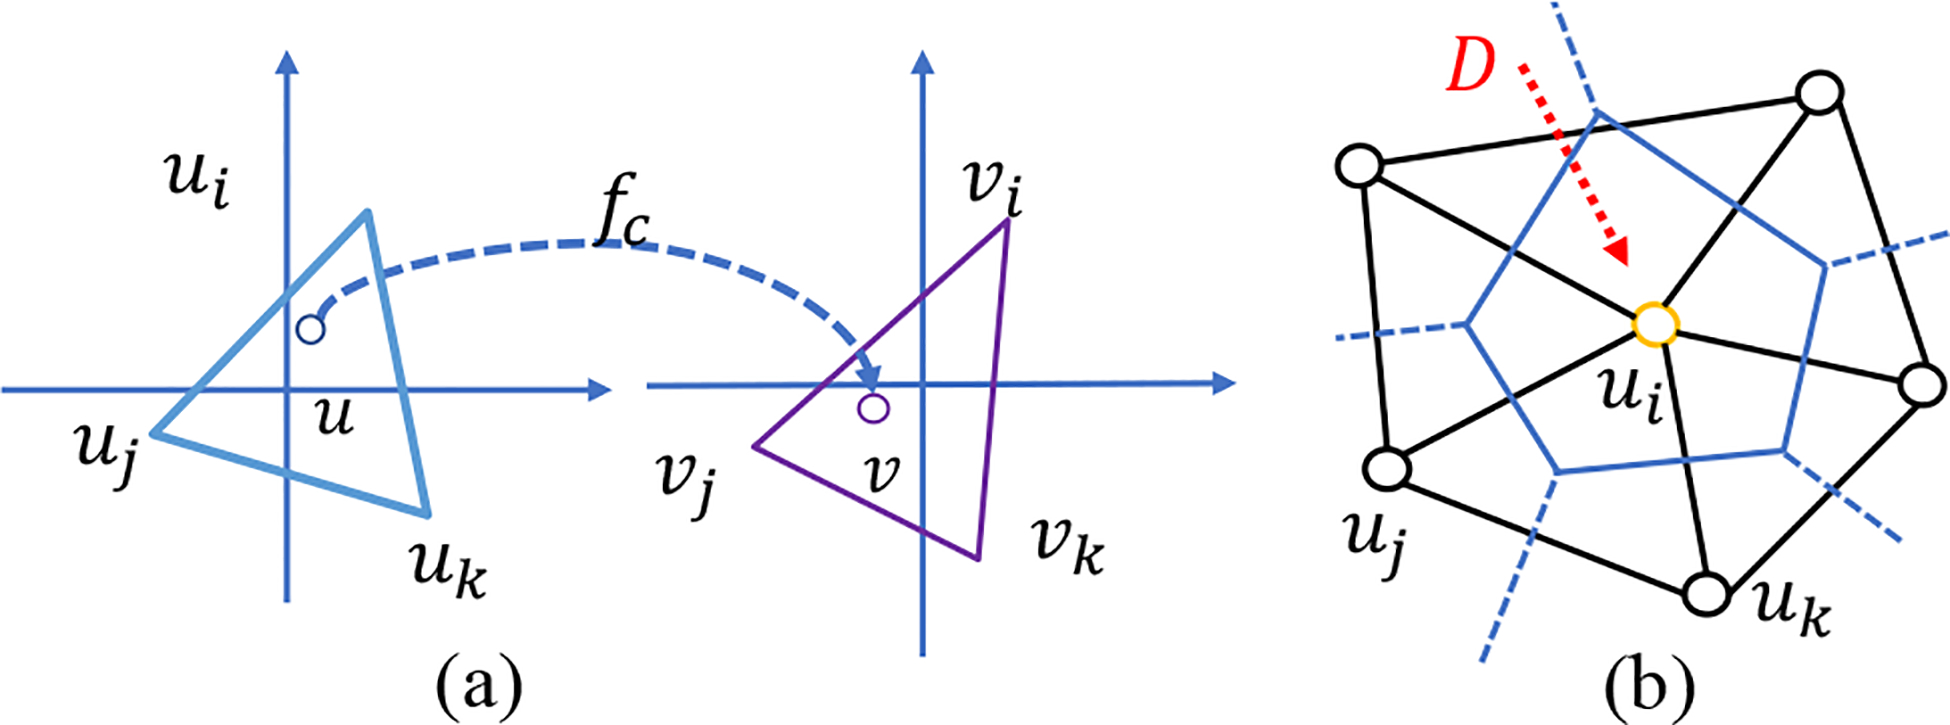
Given the explicit form of function f(u), we can compute μf according to Eq. (7). In the discrete case, fc is interpreted linearly on each triangle. As shown in Fig. 3(a), for u within the triangle Δuiuj uk, fc (u) = αivi + αjvj + αkvk, where vi = fc (ui), vj = fc (uj), and vk = fc (uk). The coefficients αi, αj, and αk are called barycentric coefficients. Specifically, αi (similarly for αj and αk) is the area portion of triangle Δuujuk to Δuiujuk, i.e. αi = Area (Δuujuk) /Area (Δuiujuk). Now we can compute the Beltrami coefficient according to Eq. (7). It is easy to see that is a constant for each triangle.
Fig. 3.

(a) Illustration of approximate the mapping in discrete. (b) The divergence approximation on the vertex ring.
3.2.2. Linear Beltrami Solver (LBS)
We briefly introduce the LBS to recovery function f = (f(1), f(2)) for the given Beltrami coefficient μ = ρ + iτ .It was first introduced in [20, 21]. According to the definition in Eq. (7), we have,
| (8) |
After re-organizing Eq. (8) and eliminating f(2), we derive,
| (9) |
where and , ∇f(1) = (∂f(1)/∂u(1) + ∂f(1)/∂u(2)), and the divergence ∇ on vector G = A∇f(1) = (G(1), G(2)) is defined as ∇ · G = ∂G(1)/∂u(1) + ∂G(2)/∂u(2). By solving the partial equation Eq. (9) with certain boundary conditions, we can solve f(1). Similarly, f(2) can be solved.
In the discrete case, the function is linearly interpreted on each triangle. The gradient of f, ∇f (u), can be written out. For the divergence on vector G, ∇ · G, it is approximated on the dual cell of each vertex (a cell consisted of circumcenters of neighboring triangles). As shown in Fig. 3(b), consider the vertex ui with its neighbors N(ui), the divergence on vector G is approximated by,
| (10) |
Applying the approximations, we have a linear equation for each fi together with its neighboring vertices, according to Eq. (9). Finally, we can solve f efficiently by collecting all the equations and write them in a matrix form.
3.2.3. Laplacian Smoothing and Chopping
Now we can convert between the function and Beltrami coefficient. Our purpose is to make a smooth result. We apply the smooth operation on the function and Beltrami coefficient by the Laplacian smoothing. For instance, to get a smooth Beltrami coefficient v, we solve the following,
| (11) |
where λ is a constant. Eq. (11) can be efficiently solved by its Euler-Lagrange equation (−∇ · ∇ + 2λI) ν = 2λμ.
Although we penalize the non-diffeomorphism in Eq. (6), if there is a consistent point whose ∣μ∣ > 1, it breaks the diffeomorphic result. To avoid this situation, we shrink ν′ = ν/ ∣ν∣, if ∣ν∣ > 1. This process is called Chop.
3.2.4. Algorithm
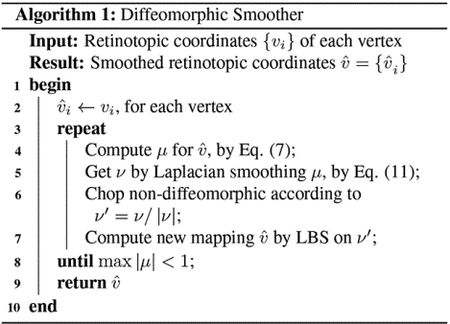
The overall smoothing process is summarized in Alg. 1.

4. RESULTS
4.1. Synthetic Data
We first evaluate the performance of the algorithm on synthetic data. The ground truth mapping is given by,
| (12) |
We choose log function as it is a good approximation of the retinotopic mapping from visual space to the flattened cortical surface, introduced by Schwartz [12]. As shown in Fig. 4(a), the visual domain is mapped to the parametric space Fig. 4(b). We also show the mapping with a small amount of noise in Fig. 4(c) and a large amount of noise in Fig. 4(d). We apply several smoothing methods on the synthetic mapping data in both small and big noise cases including Average Smoothing, Median Smoothing, and Laplacian Smoothing [22]. The result for the big noisy case is shown in Fig. 5. All of them are spatial smoothing procedures. Average Smoothing takes the average around each neighborhood. Median Smoothing takes the median value of each neighborhood. Laplacian smoothing is the so-called “Perfect Smoothing”. Except for the proposed method, all smoothing procedures process the coordinates u(1) and u(2) separately. We list the performance metric of all the methods in Table 1.
Fig. 4.

Function domain, its mapping result and mapping results with noise: (a) mapping domain on the visual field; (b) mapping result without noise; (c) mapping result with weak noise under Peak Signal-Noise Ratio (PSNR) is 20 dB; (d) mapping result with strong noise (PSNR = 10 dB).
Fig. 5.

Smoothing results for map with big noise: (a) average smoothing; (b) median smoothing; (c) Laplacian smoothing; (d) the proposed smoothing.
Table 1.
Comparing different smoothing methods by four metrics, mean value deviation of function, the max of the function deviation, and the number of overlapped triangles (non-diffeomorphic triangles). Value deviation means error to the ground truth. For cells with two values like “A/B”, “A” is the result for the map with a small added noise (PSNR = 20 dB); while “B” is the result for the map with a big added noise (PSNR = 10 dB).
| Method | Value Deviation | # Flipped Triangles | |
|---|---|---|---|
| Mean | Max | ||
| Before Smoothing | 0.25/0.40 | 0.64/1.05 | 19/56 |
| Average Smoothing | 0.18/0.24 | 0.62/0.77 | 3/8 |
| Median Smoothing | 0.22/0.28 | 0.69/0.83 | 2/24 |
| Laplacian Smoothing | 0.23/0.36 | 0.66/0.92 | 11/43 |
| Proposed | 0.19/0.22 | 0.65/0.75 | 0/0 |
We found that (1) all the smoothing methods helped reduce the noise, and reduce flipped triangles (i.e. triangle violates the topology preserving condition); (2) with a small amount of added noise, the topology violation problem is not severe, average smoothing can also achieve almost diffeomorphic results; (3) however, with a large amount of added noise, only our method can achieve diffeomorphic result.
4.2. HCP Data
With 7-Tesla MRI systems, the signal-to-noise ratio of retinotopic mapping has been dramatically improved. Still, the mapping is noisy and non-diffeomorphic. We apply our smoother on data from a 7T MRI system. The details of the dataset can be found in [14]. Because we only interested in smoothing, we took publicly available data of the decoded retinotopic coordinate for each cortical vertex of five subjects [23], and evaluate the performance of our method. The total number of flipped triangles for raw data is 1313, for the average, median, and Laplacian methods are 1289, 1312, and 1337, respectively. Proposed method has no flip triangles.
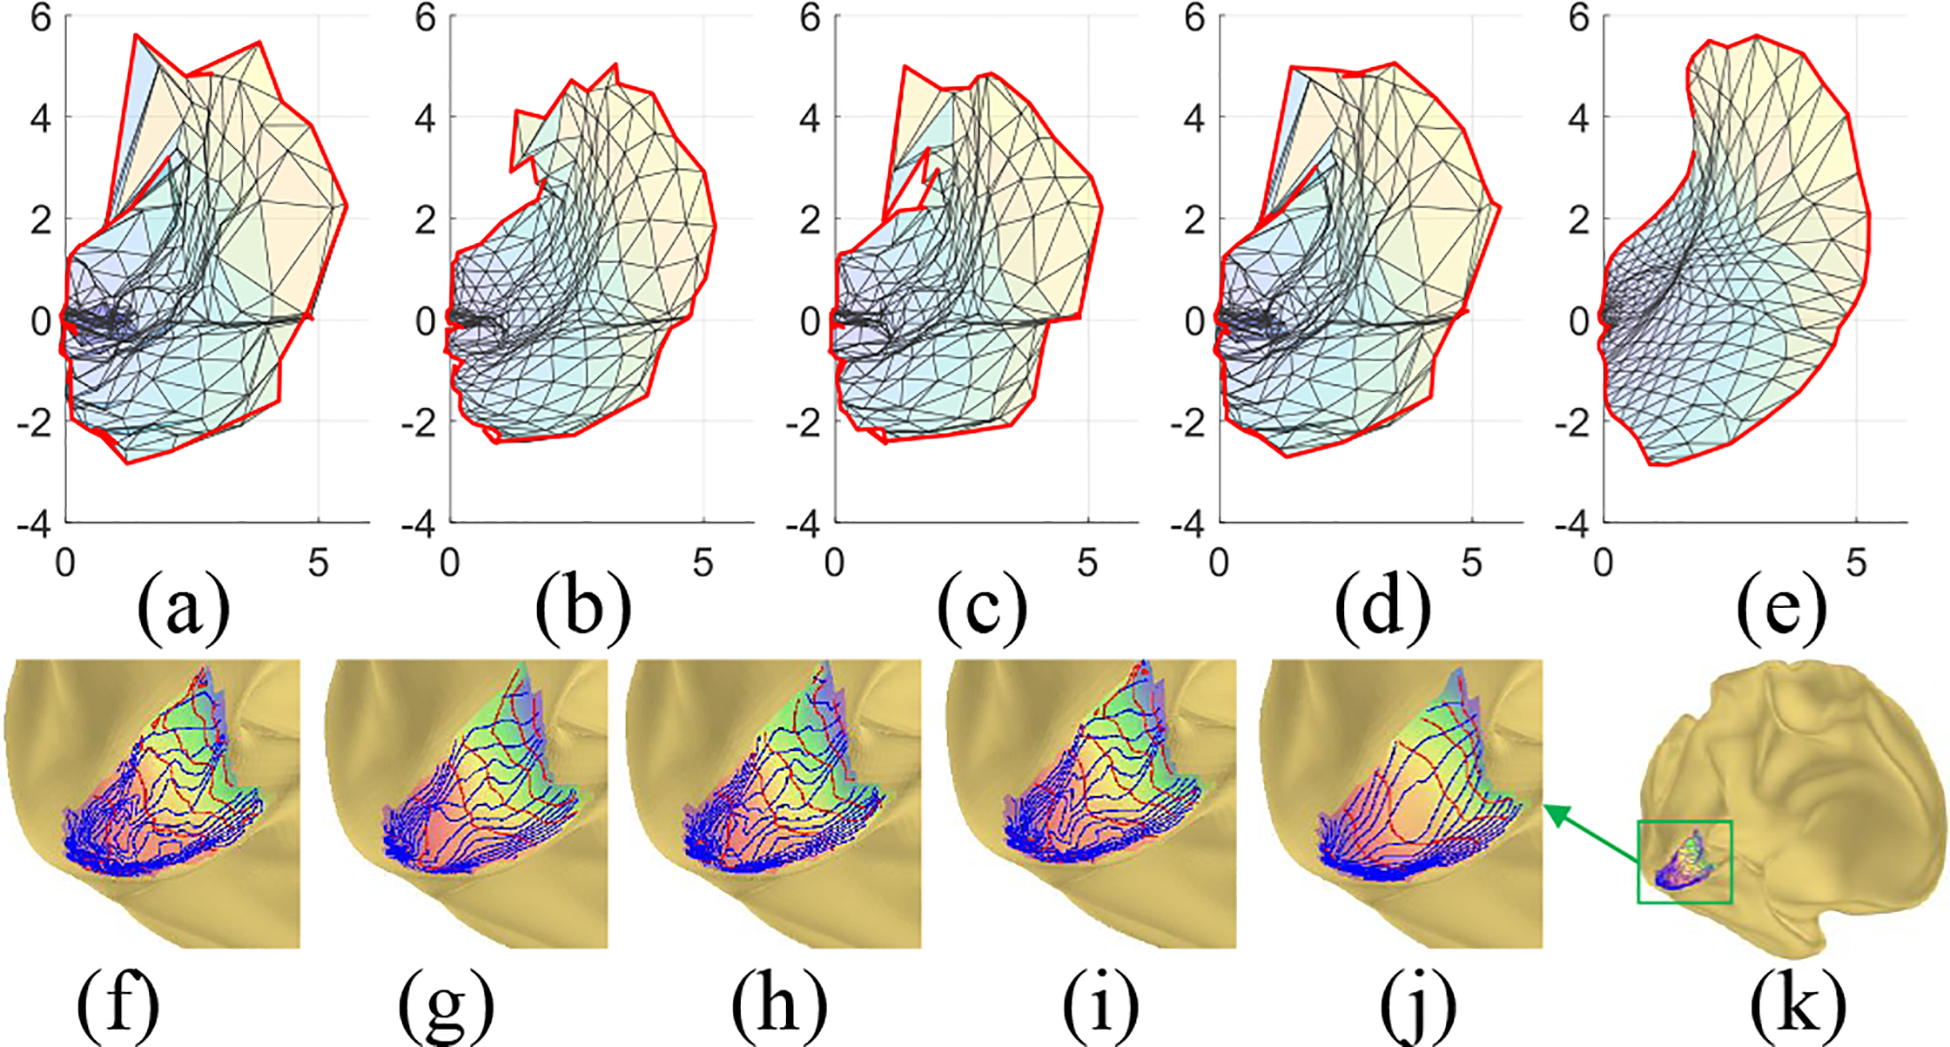
For a more persuasive and intuitive comparison, Fig. 6 shows the retinotopic mapping of the left hemisphere of the a subject, and the smoothed results of different methods. The original mapping is not diffeomorphic. Although all smoothing methods improved the smoothness, only our method can generate diffeomorphic result, especially near the fovea.
Fig. 6.

A subject’s left retinotopic mapping: (a) raw retinotopic mapping; (b)-(e) smoothing results of average, median, Laplacian, and proposed smoothing methods; (f) the raw mapping on cortical surface; (g)-(j) smoothing results on inflated surface of each method, in the same order of (b)-(e); (k) The left inflated cortex.
5. CONCLUSION AND FUTURE WORK
We adopted Beltrami coefficient to quantify diffeomorphism of retinotopic mapping and formed a mathematical model to generate diffeomorphic maps. The proposed smoother guarantees diffeomorphism and minimizes angle distortion. In future, we will (1) apply the method to the data from all subjects of the HCP cohort, and provide reliable angle distortion measures; (2) use the Beltrami coefficient to improve coregistrations of noisy retinotopic maps.
6. REFERENCES
- [1].Dougherty Robert F., Koch Volker M., Brewer Alyssa A., Fischer Bernd, Modersitzki Jan., and Wandell Brian A., “Visual field representations and locations of visual areas v1/2/3 in human visual cortex,” Journal of Vision, vol. 3, no. 10, pp. 586–598, October 2003. [DOI] [PubMed] [Google Scholar]
- [2].Dumoulin Serge O. and Wandell Brian A., “Population receptive field estimates in human visual cortex,” NeuroImage, vol. 39, no. 2, pp. 647–660, January 2008. [DOI] [PMC free article] [PubMed] [Google Scholar]
- [3].Alvarez Ivan, Benjamin de Haas Chris A. Clark, Rees Geraint, and Schwarzkopf D. Samuel, “Comparing different stimulus configurations for population receptive field mapping in human fMRI,” Frontiers in Human Neuroscience, vol. 9, February 2015. [DOI] [PMC free article] [PubMed] [Google Scholar]
- [4].Peirce Jonathan W, “Generating stimuli for neuroscience using PsychoPy,” Frontiers in Neuroinformatics, vol. 2, pp. 10, January 2008. [DOI] [PMC free article] [PubMed] [Google Scholar]
- [5].Sereno MI, Pitzalis S, and Martinez A, “Mapping of Contralateral Space in Retinotopic Coordinates by a Parietal Cortical Area in Humans,” Science, vol. 294, no. 5545, pp. 1350–1354, November 2001. [DOI] [PubMed] [Google Scholar]
- [6].Horton Jonathan C., “The Representation of the Visual Field in Human Striate Cortex,” Archives of Ophthalmology, vol. 109, no. 6, pp. 816, June 1991. [DOI] [PubMed] [Google Scholar]
- [7].Warnking J, Dojat M, Guérin-Dugué A, Delon-Martin C, Olympieff S, Richard N, Chéhikian A, and Segebarth C, “fMRI Retinotopic Mapping—Step by Step,” NeuroImage, vol. 17, no. 4, pp. 1665–1683, December 2002. [DOI] [PubMed] [Google Scholar]
- [8].Swindale Nicholas V., Shoham Doron, Grinvald Amiram, Bonhoeffer Tobias, and Hübener Mark, “Visual cortex maps are optimized for uniform coverage,” Nature Neuroscience, vol. 3, no. 8, pp. 822–826, August 2000. [DOI] [PubMed] [Google Scholar]
- [9].Glasser Matthew F., Sotiropoulos Stamatios N., Wilson J. Anthony, Coalson Timothy S., Fischl Bruce, Andersson Jesper L., Xu Junqian, Jbabdi Saad, Webster Matthew, Polimeni Jonathan R., Van Essen David C., and Jenkinson Mark, “The minimal preprocessing pipelines for the Human Connectome Project,” NeuroImage, vol. 80, pp. 105–124, October 2013. [DOI] [PMC free article] [PubMed] [Google Scholar]
- [10].Sereno M, Dale A, Reppas J, Kwong K, Belliveau J, Brady T, Rosen B, and Tootell R, “Borders of multiple visual areas in humans revealed by functional magnetic resonance imaging,” Science, vol. 268, no. 5212, pp. 889–893, May 1995. [DOI] [PubMed] [Google Scholar]
- [11].Benson Noah Cand Winawer Jonathan, “Bayesian analysis of retinotopic maps,” eLife, vol. 7, December 2018. [DOI] [PMC free article] [PubMed] [Google Scholar]
- [12].Schwartz Eric L., “Computational anatomy and functional architecture of striate cortex: A spatial mapping approach to perceptual coding,” Vision Research, vol. 20, no. 8, pp. 645–669, January 1980. [DOI] [PubMed] [Google Scholar]
- [13].Adams Daniel L and Horton Jonathan C, “A precise retinotopic map of primate striate cortex generated from the representation of angioscotomas.,” The Journal of neuroscience: the official journal of the Society for Neuroscience, vol. 23, no. 9, pp. 3771–89, May 2003. [DOI] [PMC free article] [PubMed] [Google Scholar]
- [14].Benson Noah C. and Others, “The Human Connectome Project 7 Tesla retinotopy dataset: Description and population receptive field analysis,” Journal of Vision, vol. 18, no. 13, pp. 1–22, December 2018. [DOI] [PMC free article] [PubMed] [Google Scholar]
- [15].Wandell BA, Winawer J, and Kay KN, “Computational Modeling of Responses in Human Visual Cortex,” in Brain Mapping, pp. 651–659. Elsevier, February 2015. [Google Scholar]
- [16].Schira Mark M., Tyler Christopher W., Spehar Branka, and Breakspear Michael, “Modeling Magnification and Anisotropy in the Primate Foveal Confluence,” PLoS Computational Biology, vol. 6, no. 1, pp. e1000651, January 2010. [DOI] [PMC free article] [PubMed] [Google Scholar]
- [17].Gardiner Frederick P. and Lakic Nikola, Quasiconformal Teichmuller theory, American Mathematical Society, 2000. [Google Scholar]
- [18].Ta Duyan, Shi Jie, Barton Brian, Brewer Alyssa, Lu Zhong-Lin, and Wang Yalin, “Characterizing human retinotopic mapping with conformal geometry: a preliminary study,” in Medical Imaging 2014: Image Processing, Ourselin Sebastienand Styner Martin A., Eds., March 2014, vol. 9034, p. 90342A. [Google Scholar]
- [19].Dimas Martínez Luiz Velho, and Carvalho Paulo C., “Computing geodesics on triangular meshes,” Computers and Graphics (Pergamon), vol. 29, no. 5, pp. 667–675, October 2005. [Google Scholar]
- [20].Lui Lok Ming, Lam Ka Chun, Wong Tsz Wai, and Gu Xianfeng, “Texture map and video compression using Beltrami representation,” SIAM Journal on Imaging Sciences, vol. 6, no. 4, pp. 1880–1902, January 2013. [Google Scholar]
- [21].Lam Ka Chunand Lui Lok Ming, “Landmark and intensity-based registration with large deformations via quasi-conformal maps,” SIAM Journal on Imaging Sciences, vol. 7, no. 4, pp. 2364–2392, January 2014. [Google Scholar]
- [22].Eilers Paul H.C., “A perfect smoother,” Analytical Chemistry, vol. 75, no. 14, pp. 3631–3636, July 2003. [DOI] [PubMed] [Google Scholar]
- [23].Benson Noah Kay, C., Jamison Keith, Arcaro Mike, Vu An, Coalson Tim, Van Essen David, Yacoub Essa, Ugurbil Kamil, Winawer Jonathan, and Kay Kendrick, “The HCP 7T Retinotopy Dataset,” 2018. [DOI] [PMC free article] [PubMed] [Google Scholar]


