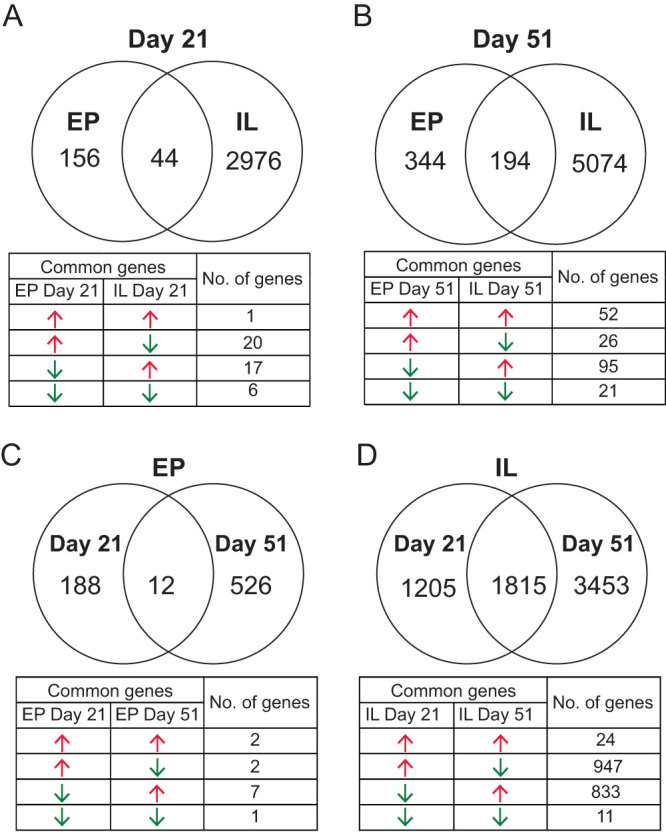
FIG 3.

Venn diagram analyses and the overlapped genes distribution table of the differentially expressed genes (DEGs; fold change value of ≥2 and P value of ≤0.05) that were identified from the ileal RNA-seq data in male piglets fed milk formula (MF) compared with human milk (HM) fed from day 2 until day 21 of age. (A) Ileal tissues (IL) at day 21 versus ileal epithelium (EP) at day 21 of age. (B) IL versus EP at day 51 of age. (C) IL at day 21 versus at day 51 of age. (D) EP at day 21 versus at day 51 of age. Red arrows indicate increased gene expression, whereas green arrows indicate decreased gene expression in the MF group relative to the HM group.
