

Abstract
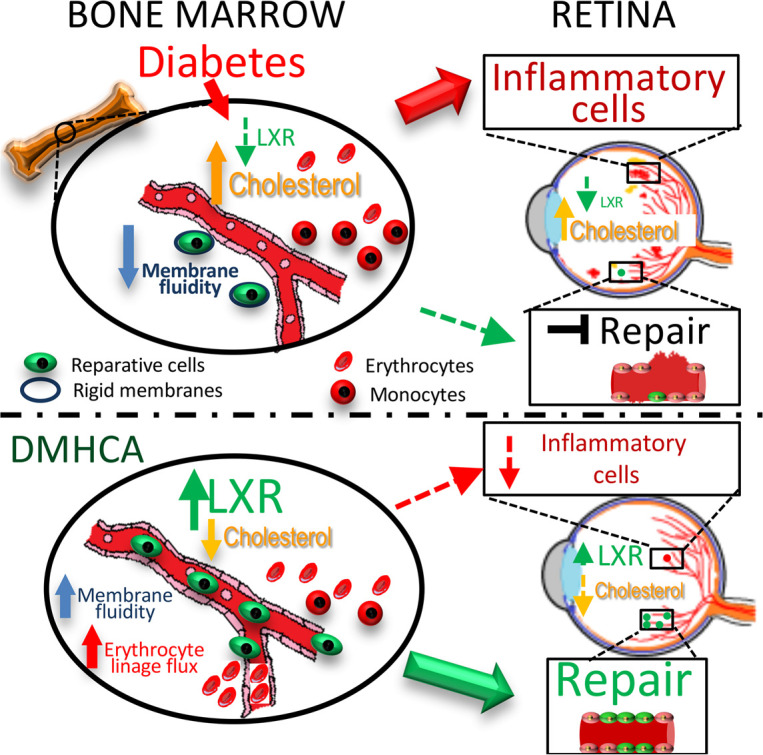
In diabetic dyslipidemia, cholesterol accumulates in the plasma membrane, decreasing fluidity and thereby suppressing the ability of cells to transduce ligand-activated signaling pathways. Liver X receptors (LXRs) make up the main cellular mechanism by which intracellular cholesterol is regulated and play important roles in inflammation and disease pathogenesis. N, N-dimethyl-3β-hydroxy-cholenamide (DMHCA), a selective LXR agonist, specifically activates the cholesterol efflux arm of the LXR pathway without stimulating triglyceride synthesis. In this study, we use a multisystem approach to understand the effects and molecular mechanisms of DMHCA treatment in type 2 diabetic (db/db) mice and human circulating angiogenic cells (CACs), which are hematopoietic progenitor cells with vascular reparative capacity. We found that DMHCA is sufficient to correct retinal and BM dysfunction in diabetes, thereby restoring retinal structure, function, and cholesterol homeostasis; rejuvenating membrane fluidity in CACs; hampering systemic inflammation; and correcting BM pathology. Using single-cell RNA sequencing on lineage–sca1+c-Kit+ (LSK) hematopoietic stem cells (HSCs) from untreated and DMHCA-treated diabetic mice, we provide potentially novel insights into hematopoiesis and reveal DMHCA’s mechanism of action in correcting diabetic HSCs by reducing myeloidosis and increasing CACs and erythrocyte progenitors. Taken together, these findings demonstrate the beneficial effects of DMHCA treatment on diabetes-induced retinal and BM pathology.
Keywords: Ophthalmology, Stem cells
Keywords: Bone marrow, Diabetes
Selective LXR activation, using oral DMHCA, is sufficient to correct retinal and bone marrow dysfunction in type 2 diabetes by suppressing myeloidosis and dyslipidemia.
Introduction
The landmark ACCORD Eye study demonstrated that, in individuals with type 2 diabetes (T2D) and dyslipidemia, tight glycemic control supplemented with fenofibrate/statin combination significantly reduced the progression of diabetic retinopathy (DR) compared with intensive glycemia treatment alone (1). Subgroup analysis of the dyslipidemia cohort revealed that elevated LDL-cholesterol was the only individual lipid measurement that was significantly associated with worse DR progression. These data establish diabetic dyslipidemia, and hypercholesterolemia specifically, as risk factors for DR and support the notion that therapies targeting lipid metabolism are clinically efficacious in T2D.
Serum cholesterol, which reflects the cholesterol exchange between tissues, is the clinical measurement used to estimate an individual’s total cholesterol level. However, the overwhelming majority of cholesterol is distributed in the cell membranes of peripheral tissues, where it accounts for 30%–50% of the plasma membrane molar ratio (2). Statins, the first line treatment for hypercholesterolemia, predominantly target cholesterol biosynthesis and thereby decrease circulating LDL, as well as peripheral cholesterol biosynthesis (3). However, statins have a lesser effect on the efflux of intracellular cholesterol in peripheral tissues such as the retina (4, 5). In diabetic dyslipidemia, cholesterol accumulation leads to reduced membrane fluidity, inflammation, and disease pathogenesis (6, 7). Increases in membrane cholesterol promote stabilization of membrane microdomains, such as lipid rafts, which allow, for example, cytokine receptor clustering, leading to increased intracellular second messenger signaling and amplification of inflammatory cytokine signaling (8, 9). In addition, cholesterol can affect membrane fluidity that is of particular importance for BM-derived cell trafficking and mobility (10).
Liver X receptors (LXR) are the main cellular mechanism by which intracellular cholesterol is regulated. These nuclear receptors transcriptionally regulate genes involved in lipid metabolism to homeostatically balance the endogenous biosynthesis, dietary uptake, metabolism, and elimination of lipids (11). LXR activation is induced by elevated intracellular cholesterol and stimulates cholesterol removal through reverse cholesterol transport (12, 13). In addition, LXR activation maintains the composition and physical properties of the cell membrane through the coupled regulation of phospholipid and cholesterol metabolism (14). Activation of LXR is signaled through direct binding of endogenous lipid ligands, such as oxysterols and other cholesterol derivatives, as well as intermediate precursors in the cholesterol biosynthesis pathway (11, 12). Synthetic chemical agonists of LXR have been developed for therapeutic intervention, and while they have proven efficacious in diabetic animal models (15–19), their undesirable adverse effect profile, including hypertriglyceridemia and hepatic steatosis, has hampered clinical development (20, 21).
N, N-dimethyl-3β-hydroxy-cholenamide (DMHCA) is a synthetic oxysterol that induces gene-specific modulation of LXR (22–24). Mechanistically, DMHCA activates LXR through direct agonism, as well as the inhibition of desmosterol reduction, the final step in the predominant cholesterol biosynthesis pathway, leading to the accumulation of the potent LXR agonist desmosterol (25, 26). During endogenous LXR activation, compensatory fatty acid biosynthesis is stimulated through the transcriptional induction of SREBP1c, leading to elevated triglyceride levels (26). Intriguingly, DMHCA selectively activates the cholesterol efflux arm of the LXR pathway, through the induction of ATP-binding cassette transporter (ABCA1), with minimal effect on SREBP1c compared with other LXR agonists, such as T0901317 and GW3965 (25–29). Thus, DMHCA has lower risk for the undesirable adverse effects that plagued previous LXR modulators, while retaining the ability to lower circulating LDL and restore peripheral cholesterol homeostasis (22, 28).
LXR signaling plays an important role in inflammation and disease (30). In the retina, LXR depletion causes retinal/optic nerve degeneration (31), formation of acellular capillaries (18), and retinal pigment epithelial changes (32), suggesting that LXR is required for normal retinal maintenance and that its absence results in pathologies spanning the entire retina. Interestingly, in the diabetic retina, LXR expression is downregulated, and activation of LXR using a chemical agonist is sufficient to reduce gliosis and the formation of acellular capillaries (18, 19). LXR activation also displays potent antiinflammatory effects, which are mediated by inhibition of NF-κB signaling and, in part, by altering the composition of the plasma membrane (33). By selectively regulating the cholesterol content of specific membrane microdomains, LXR inhibits signaling through TLRs 2, 4, and 9 (33). In diabetes, gut barrier dysfunction is an early event that increases circulating bacterial antigens, leading to enhanced activation of TLRs on endothelium and promoting chronic systemic inflammation (34). Thus, LXR agonists, such as DMHCA, have the potential added benefit of hampering widespread inflammation in diabetes.
Additional features of diabetes are vascular insufficiency and deficient wound healing. Circulating CD34+ vascular reparative cells, also known as circulating angiogenic cells (CACs), play an important role in promoting vascular integrity and maintenance (35). These cells require a complex network of intercellular signaling to home to areas of injury and provide trophic support that promotes vascular repair. In diabetes, these cells are defective, are low in number, and their levels inversely correlate with the presence of microvascular complications, such as DR (36, 37). Cell replacement treatments using nondiabetic-derived vascular reparative cells have proven efficacious in DR mouse models (38), but drug treatments are needed that target and rejuvenate this population of circulating cells. In diabetic mice, LXR activation has been shown to restore the equivalent population of vascular reparative cells by enhancing their migration and suppressing oxidative stress and inflammatory gene expression (18). Moreover, in LXR–double-KO mice fed a high-fat diet, circulating vascular reparative cells are dysfunctional, decreased in number, and show an increased cellular cholesterol content (39). Interestingly, these mice also demonstrated alterations in hematopoietic stem and progenitor cells (HS/PCs), suggesting that LXR’s effects may extend to the hematopoietic stem cell (HSC) compartment (40). Together, these studies suggest that LXR modulators like DMHCA can positively impact multiple tissues and cell types in diabetes.
In this study, we use a multisystem approach to understand the effects and molecular mechanisms of DMHCA treatment in T2D db/db mice and human vascular reparative cells. Using lipidomics, single-cell membrane fluidity assays, flow cytometry, and single-cell RNA sequencing (scRNA-seq), we characterize the effects of diabetes and DMHCA treatment on the retina, circulating immune cells, and BM compartment.
Results
Systemic DMHCA treatment restores cholesterol homeostasis in the diabetic retina.
Dysregulation of the delicate balance between cholesterol biosynthesis, uptake, and removal leads to accumulation of cholesterol in the diabetic retina. To test whether selective LXR agonism, using systemic DMHCA treatment (Figure 1A), is sufficient to reduce the levels of cholesterol in the retina, T2D db/db mice were treated with oral DMHCA for 6 months after the onset of diabetes. Liquid chromatography–mass spectrometry (LC-MS) was performed on lipid extracts from whole retina to quantify sterol levels before (nonesterified cholesterol and sterol metabolites) and after alkaline hydrolysis (esterified and nonesterified cholesterol).
Figure 1. DMHCA restores cholesterol homeostasis in diabetic retina.

(A) Schematic representation of DMHCA structure and function. (B) Compounds selected by 1-way ANOVA with P value threshold of 0.05 are shown in the heatmap of LC-MS quantified free retinal sterols from 9-month-old mice. (C–F) Quantification of desmosterol (C), total oxysterols (D), total cholesterol (E), and nonesterified cholesterol (F). Data are LC-MS peaks normalized to internal standards, log transformed and Pareto scaled, presented as mean ± SEM. (G) qPCR of retinal ABCA1 mRNA expression. *P < 0.05; **P < 0.03; ***P < 0.01. Analyzed using 1-way parametric ANOVA with Tukey’s test for multiple comparisons.
The retinal sterol profiles of db/m heterozygous controls, db/db diabetic mice, and db/db diabetic mice treated with DMHCA are represented by the heatmap in Figure 1B. DMHCA significantly increased endogenous LXR ligands, desmosterol, and total oxysterols in the diabetic retina, consistent with the drug’s mechanism of action (Figure 1, C and D). The total cholesterol content of the diabetic retina was over 2 magnitudes higher than db/m control, consistent with diabetic dyslipidemia (Figure 1E). DMHCA treatment reduced total retinal cholesterol by more than ten times in the diabetic animals, bringing it back to baseline levels (Figure 1E). Compared with db/m controls, DMHCA also significantly reduced nonesterified cholesterol (Figure 1F).
In addition to inhibition of cholesterol synthesis, DMHCA increased cholesterol removal through activation of LXR-induced reverse cholesterol transport and modified cholesterol metabolism to favor the synthesis of more soluble oxysterols. Indeed, DMHCA treatment increased free oxysterols by > 50% (Figure 1D). In addition to DMHCA and desmosterol, many other oxysterol species serve as endogenous LXR agonists (41). Consistent with LXR agonism, DMHCA treatment increased the LXR-controlled transcriptional expression of the cholesterol efflux pump ABCA1 by over 100% in the diabetic retina (Figure 1G). Together, these data demonstrate the dramatic shift in the cholesterol metabolism in the diabetic retina and provide support that systemic DMHCA treatment can restore cholesterol homeostasis in the retina.
DMHCA rescues diabetes-induced membrane rigidity in circulating vascular reparative cells in mice and humans.
In diabetes, buildup of cholesterol impedes the fluidity of the plasma membrane, causing a pathologic increase in the rigidity of the cell (41–44). To test whether the observed improvements in cholesterol metabolism with DMHCA treatment could rescue this diabetic phenotype, we used an ex vivo imaging approach to quantify the effects of DMHCA on membrane fluidity of stem/progenitor cells from diabetic individuals and mice. For human studies, peripheral CD34+ cells, a vascular reparative population, were collected from 19 individuals with T2D and from 19 nondiabetic control subjects (Supplemental Table 1; supplemental material available online with this article; https://doi.org/10.1172/jci.insight.137230DS1). We chose to focus on CD34+ cells because membrane fluidity is especially important in this population, which require membrane flexibility to egress from the BM and a complex network of lipid rafts to transduce activation signals. Compared with the control cells (n = 136), the membrane fluidity of diabetic CD34+ cells (n = 89) — as assessed by fluorescence recovery after photobleaching (FRAP) — was significantly reduced (Figure 2, A and B). This is consistent with the well-described dysfunction of CD34+ in diabetes, leading to a reduced ability to correct chronic vascular injury such as occurs in DR. Remarkably, ex vivo treatment of diabetic CD34+ cells with DMHCA for 16–18 hours restored the fluidity of the membranes to baseline nondiabetic levels (Figure 2B). These data demonstrate that DMHCA restores the structure, and presumably function, of dysfunctional CD34+ vascular reparative cells.
Figure 2. DMHCA rescues membrane fluidity in circulating vascular reparative cells in humans and mice.

(A and B) CD34+ cells were enriched from peripheral blood samples from nondiabetic (n = 19) and type 2 diabetic (n = 19) patients. Cells from diabetic patients were split, and half received ex vivo treatment with DMHCA. Representative single-cell images of membrane staining from nondiabetic, diabetic (untreated), and DMHCA-treated diabetic CD34+ cells (A). The blue color represents perylene sequesters in the membrane. Translation diffusion values from patient-derived CD34+ circulating vascular reparative cells. Each point on the graph represents an individual cell’s translation diffusion measurement. Control, nondiabetic cells (n = 136); diabetes, untreated diabetic cells (n = 89); D DMHCA, DMHCA-treated diabetic cells (n = 42) (B). (C and D) CACs were isolated from BM of nondiabetic (db/m; n = 11) and diabetic (db/db; n = 29) mice. Similar to the human studies, half of the diabetics CACs received ex vivo treatment with DMHCA. Representative single-cell images of membrane staining from nondiabetic, diabetic (untreated), and DMHCA-treated diabetic CACs (C). Translation diffusion values from CACs. Control, nondiabetic cells (n = 11); diabetes, untreated diabetic cells (n = 12); D DMHCA, DMHCA-treated diabetic cells (n = 17) (D). Data are presented as mean ± SEM. *P < 0.05; **P < 0.03; ***P < 0.01. Analyzed using Kruskal-Wallis test with multiple comparison correction via Dunn’s test.
A similar approach was used to assess the ex vivo ability of DMHCA to correct the membrane fluidity of CACs in diabetic mice. CACs were defined as CD45+CD11b–CD133+FLK1+ peripheral circulating cells (Supplemental Figure 1). Compared with control cells (n = 11), CACs from db/db mice (n = 12) showed increased membrane rigidity, similar to what was observed in diabetic human–derived CD34+ cells (Figure 2, C and D). After 16-18 hours of ex vivo DMHCA treatment, the membrane fluidity of diabetic CACs (n = 17) was rescued to above-baseline nondiabetic levels (Figure 2D). These data complement those observed in the human studies and demonstrate the potent ability of DMHCA to acutely correct membrane rigidity.
DMHCA slows the progression of DR in db/db mice.
Given the remarkable ability of DMHCA to restore cholesterol homeostasis in the diabetic retina and to rescue the membrane fluidity of circulating vascular reparative cells in diabetes, we next sought to explore the functional impact of these beneficial effects on the progression of DR. Similar to humans, diabetic db/db mice develop progressive retinal pathology that shares many key features with DR, including increased infiltration of proinflammatory leukocytes, formation of acellular capillaries, and reduced visual response (45, 46). To assess the antiinflammatory effects of DMHCA on the diabetic retina, flow cytometry was used to quantify the relative percentages of infiltrating monocytes/macrophages. To isolate macrophages and monocytes, CD45+CD11b+ cells were gated on the macrophage marker F4/80 (Supplemental Figure 2). Macrophages were further gated on CD206 to isolate M1-like CD206– macrophages and M2-like CD206+ macrophages, while monocytes were gated on CCR2 to isolate classical CCR2– monocytes from nonclassical CCR2+ monocytes (Supplemental Figure 2). Compared with control, diabetes induced a relative increase in classical monocytes and proinflammatory M1-like macrophages and a decrease in nonclassical monocytes and reparative M2-like macrophages (Figure 3, A and B). Systemic DMHCA treatment rescued nearly all of these defects in the proinflammatory state of the diabetic retina. DMHCA reduced the relative proportion of classical monocytes to below baseline, restored the proportion of nonclassical monocytes to baseline, and increased the proportion of reparative M2-like macrophages (Figure 3, A and B).
Figure 3. DMHCA slows the development of diabetic retinopathy in db/db mice.

(A) The presence of inflammatory and antiinflammatory cells in the retina were determined by flow cytometry. Monocytes were defined by CD45+CD11b+Ly6G–F4/80– cells, classical monocytes were determined as CCR2+ cells, and nonclassical monocytes as CCR2–. (B) The macrophages were defined as CD45+CD11b+Ly6G–F4/80+ cells, and then the CD206– cells were gated to quantify M1 macrophages and the CD206+ to quantify M2 macrophages. (C) Immunofluorescence staining of retinal cross-sections for CD45+ cells. GCL, ganglion cell layer; IPL, inner plexiform layer; INL, inner nuclear layer; OPL, outer plexiform layer; ONL, outer nuclear layer; PL, photoreceptor layer. (D) qPCR on retinal CCL-2 mRNA expression. (E) Trypsin digested retinal flat mounts for acellular capillary quantification. (F) Retinal visual response assessed by electroretinography. Scotopic a- and b-waves were quantified at an intensity of 0 db flash (3 cd/m2/s). Data are the mean ± SEM. **P < 0.03 ***P < 0.01. Analyzed using 1-way parametric ANOVA with Tukey’s test for multiple comparisons.
Consistent with these data, the absolute number of leukocytes in retinal cross-sections stained with CD45 were increased in untreated diabetes compared with control, and DMHCA treatment significantly reduced the number of infiltrating CD45+ leukocytes (Figure 3C). Furthermore, the transcript level of CCL-2, a hypoxia-induced monocyte chemoattractant, was significantly increased in the untreated diabetic retina compared with control, and DMHCA restored the CCL-2 transcript level to baseline (Figure 3D).
A hallmark feature of DR is microvascular dropout, which promotes retinal ischemia in diabetes. Compared with control, the number of acellular capillaries in the untreated diabetic retina was significantly increased (Figure 3E). DMHCA protected the diabetic retina from microvascular dropout, reducing the number of acellular capillaries to baseline levels (Figure 3E). These data further support the structural benefits allowed by DMHCA treatment on the diabetic retina. To assess whether these structural improvements have functional significance in DR, electroretinography was used to quantify the visual response of the retina. Compared with control, the untreated diabetic retina showed significant decreases in scotopic a- and b-waves, consistent with diabetes-induced visual dysfunction (Figure 3F). DMHCA treatment restored visual function in the diabetic animals and increased scotopic b-waves closer to baseline levels (Figure 3F). Together, these data demonstrate the beneficial effects of DMHCA treatment on the inflammatory state, vascular integrity, and visual function of the diabetic retina.
DMHCA reduces the proinflammatory state of the BM and increases the egression of vascular reparative cells into the peripheral circulation.
In diabetes, low-level chronic inflammation alters the homeostatic balance of nearly all tissues, including the BM microenvironment (47). Myeloidosis, defined as an increase in the proportion of myeloid-derived leukocytes, is a common feature in diabetic BM and promotes the systemic inflammatory phenotype (48). Based on the observed antiinflammatory effects of DMHCA on the diabetic retina, we asked whether the benefits afforded by systemic DMHCA treatment extended to the level of the BM microenvironment and the systemic circulation. Compared with control, cytometry bead array and ELISA analyses of BM supernatants from untreated diabetic mice displayed significant increases in the protein levels of secreted proinflammatory molecules, including TNF-α, IL-3, and CCL-2. Remarkably, DMHCA treatment restored the levels of BM-derived TNF-α and IL-3 to baseline and significantly reduced CCL-2 production by > 50% (Figure 4, A–C). These data are consistent with DMHCA’s ability to hamper the proinflammatory microenvironment of the diabetic BM.
Figure 4. DMHCA reduces the inflammation in BM and increases the migration of vascular reparative cells into the systemic circulation.

(A–C) TNF-α (A) and CCL-2 (C) were quantified by Cytometry beads array, and IL-3 was quantified by ELISA (B). (D and E) Monocytes from BM (D) and peripheral blood (E) were quantified by flow cytometry and defined as CD45+CD11b+Ly6G–LY6C+ cells. (F and G) Flow cytometry analysis of levels of circulating angiogenic cells (CAC) were determined as CD45+CV11b–CD133+FLK1+ cells of BM (F) and peripheral blood (G). Data are the mean ± SEM. *P < 0.05; ***P < 0.01 analyzed using 1-way parametric ANOVA with Tukey’s test for multiple comparisons.
Next, flow cytometry was used to profile specific populations of leukocytes in the BM and peripheral circulation (Supplemental Figure 3). Compared with control, diabetes induced a significant increase in the number of circulating monocytes but surprisingly had no effect on the total monocyte population of the BM (Figure 4D). DMHCA treatment significantly reduced the number of circulating monocytes in diabetic mice (Figure 4E). We next focused on vascular reparative cells in the BM and circulation. As previously reported, diabetes induced a significant decrease in the total proportion of CACs in the BM and peripheral circulation (Figure 4, F and G). Compared with untreated diabetic mice, DMHCA significantly increased the number of CACs in the BM and peripheral circulation (Figure 4, F and G). These findings complement the previous data showing enhanced membrane fluidity in DMHCA-treated CACs and suggest that the improvements in membrane fluidity may account for the observed increase in CAC egression into the peripheral circulation. Taken together, these data demonstrate that systemic DMHCA treatment has the additional benefit of preventing diabetes-induced myeloidosis and enhancing the egression of vascular reparative cells into the peripheral circulation.
DMHCA acts at the level of HS/PC to correct diabetic myeloidosis.
To better understand the mechanism by which DMHCA normalizes the composition of circulating leukocytes, we next focused on the HSC compartment. During hematopoiesis, differentiation signals instruct HSCs to favor specific lineages, and a homeostatic balance of these signals is necessary to maintain equilibrium of circulating cells. In certain pathologic states, this balance becomes uneven, leading to the accumulation of a particular lineage, such as in diabetic myeloidosis. To explore the HSC compartment, we gated on lineage–SCA1+c-KIT+ (LSK) BM cells (Supplemental Figure 4). CD34+FLT3+ multipotent progenitors (MPPs) accounted for the largest majority of LSK cells, followed by CD34+FLT3– short-term HSCs (ST-HSCs) and finally CD34–FLT3– long-term HSCs (LT-HSCs). Compared with controls, untreated diabetic LSK cells displayed decreased ST-HSCs and LT-HSCs and increased MPPs (Figure 5, A–D). In the treated diabetic cohort, DMHCA significantly reduced the proportion of MPPs back to baseline and increased LT-HSCs (Figure 5, A, B, and D). These data support the notion that DMHCA is sufficient to restore the HSC compartment in diabetes toward a nondiabetic state.
Figure 5. DMHCA corrects hematopoietic stem and progenitor dysfunction in db/db mice.

(A–H) BM HSC (A–D) and HPC (E–H) was assessed by flow cytometry. HSCs were defined as Lin–Sca1+c-Kit+ (LSK) BM cells (A). LT-HSCs were defined as CD34–FLT3– (B), ST-HSCs as CD34+FLT3– (C), and MPPs as CD34+FLT3+ (D). HPCs were defined as LSK BM cells (E). CMPs were defined as CD32/CD16–CD34+ (F), GMPs as CD32/CD16+CD34+ (G), and MEPs as CD32/CD16–CD34– (H). CFU assays for ex vivo differentiation of cultured HPCs (I and J). Granulocyte, macrophage (GM) CFUs (I) and granulocyte, erythroid, macrophage, megakaryocyte (GEMM) CFUs (J). Data are presented as mean ± SEM. **P < 0.03; ***P < 0.01. Analyzed using 1-way parametric ANOVA with Tukey’s test for multiple comparisons.
Lineage-committed progenitor populations (LSK) were examined next to determine the effect of DMHCA on hematopoietic lineage flux (Figure 5E). CD32/CD16–CD34+ common myeloid progenitors (CMPs) accounted for the largest percentage of cells, followed by CD32/CD16+CD34+ granulocyte myeloid progenitors (GMPs) and finally CD32/CD16–CD34– megakaryocyte-erythrocyte progenitors (MEPs). Untreated diabetic mice showed an increase in CMPs and GMPs and a decrease in MEPs, consistent with diabetic myeloidosis (Figure 5, F–H). Again, DMHCA treatment corrected many of the defects observed in the lineage-committed progenitor populations in diabetes. DMHCA significantly reduced the number of GMPs, suggesting a decrease in the production of neutrophils and monocytes (Figure 5G). This is consistent with our previous observations demonstrating reduced circulating monocytes with DMHCA treatment and suggests that the mechanism relates, at least partially, to the ability of DMHCA to correct diabetic myeloidosis. In addition, DMHCA treatment significantly increased the proportion of MEPs to baseline levels, suggesting an increase in the production of erythrocytes and megakaryocytes (Figure 5H).
Finally, we assessed the differentiation ability of BM-derived stem and progenitor cells using an ex vivo culture assay. BM from control, diabetic, and DMHCA-treated mice was enriched for progenitor markers and grown in culture for 12 days, after which the number of CFUs was counted. In BM from untreated diabetic mice, there were significantly more granulocyte, erythroid, macrophage, megakaryocyte CFUs (GEMM-CFUs) and granulocyte, macrophage CFUs (GM-CFUs) compared with control, again consistent with diabetic myeloidosis (Figure 5I). In diabetic mice treated with DMHCA, the number of GM-CFUs was reduced to baseline levels, while no effect was observed on GEMM-CFUs (Figure 5J). Together, these data suggest that DMHCA acts at the level of HS/PCs to fundamentally shift diabetic hematopoiesis toward a more normal nondiabetic state. Remarkably, this effect is sufficient to suppress diabetic myeloidosis.
Single-cell analysis of diabetic HSCs in DMHCA-treated mice.
To gain mechanistic insight into DMHCA’s ability to influence diabetic HSCs and progenitors, scRNA-seq was performed on LSK sorted BM cells. Briefly, LSK cells were pooled from 3 age-matched mice for each cohort (untreated db/db and DMHCA treated db/db). Raw-count matrices from the 2 groups were preprocessed separately to remove low-quality cells and then merged for further processing using size-factor normalization, cell cycle regression, and empirical Bayes modeling for batch correction. A total of 5103 cells was recovered from the untreated diabetic group and 5152 cells from the DMHCA-treated diabetic group, for a total of 10,255 HSCs. Unsupervised clustering revealed 13 distinct clusters (Figure 6A). The largest population of cells, accounting for 27% of the total combined sample, was multipotent stem cells (Figure 6E). These cells were identified by high expression of the stem cell markers CTLA2A, HLF, and CD34 and the absence of lineage-specific gene expression (Figure 6B). Gene expression patterns of all major lineages were represented in the single-cell analysis, albeit at varying levels. These include DC progenitors (CD74, H2-AA, and H2-EB1 high), erythrocyte progenitors (HBB-BT high), lymphoid progenitors (DNTT high), monocyte progenitors (IRF8 and LY86 high), megakaryocyte/basophil progenitors (VWF and GATA2 high), neutrophil progenitors (MPO and CTSG high), and pre-B and T cell progenitors (EBF1/CD19 high and TRBC1 high, respectively) (Figure 6, B and C).
Figure 6. Single-cell RNA-seq analysis of untreated and DMHCA treated diabetic HSCs.

(A) UMAP representation of scRNA-seq from LSK sorted HSCs reveals 13 distinct clusters. (B) Violin plots of lineage-specific gene expression across all 13 clusters. (C) Spatial representation of lineage-specific gene expression. (D) UMAP cluster representations of untreated (db/db) and DMHCA treated (db/db DMHCA) diabetic HSCs. (E) Cluster proportions of all 13 cell populations in untreated and DMHCA-treated samples.
While the cluster distributions appear similar between the 2 groups (Figure 6D), differences are noted in the proportions of individual clusters (Figure 6E). In the DMHCA treatment group, multipotent stem cells decreased by 8.8% (Figure 6E). This is consistent with our previous finding that DMHCA reduces the pathologic increase of MPPs in diabetic BM. Additionally, DMHCA increased the relative proportion of erythrocyte progenitors by 39% (Figure 6E). This is consistent with our previous observation of increased MEPs in DMHCA-treated BM. Interestingly, a potentially novel population of stem cells was identified, which we refer to as AP1-high stem cells. This relatively small population, accounting for roughly 3% of the total sample, was identified as expressing high levels of the activator protein 1 (AP1) complex — including FOS, FOSB, JUN, JUNB, and JUND — and largely lacked expression of lineage-specific genes (Figure 6B). In the DMHCA treatment group, this AP1-high stem cell population was increased by 54% (Figure 6E). Moreover, DMHCA treatment unexpectedly increased the relative proportion of both pre-B and naive B cells (Figure 6E). Last, of note is the lack of change observed in the neutrophil and monocyte progenitor populations (Figure 6E). This suggests that DMHCA’s ability to influence these cells and correct diabetic myeloidosis may occur at a later stage in hematopoiesis.
DMHCA treatment increases expression of immediate early-response genes.
To probe the transcriptional pathways responsible for DMHCA’s effect on diabetic HSCs, we performed differential gene expression (DGE) analysis on the total DMHCA-treated group compared with the untreated control. Using an FDR cutoff of 0.01 and accounting for technical covariates, we identified 1048 differentially expressed genes (Figure 7A). The majority of DGEs were increased with DMHCA and included, among others, genes associated with immediate early response (FOS, FOSB, FOSL2, JUN, JUNB, JUND, ATF4, EGR1, EGR3, MYC, IER3, MCL1), LXR activation (APOE, FASN, PTGES3, HNRNPAB, SLC3A2, ETF1, RANBP1, PRDX2), and lineage specification (HBB-BT, CD19) (Figure 7B). Pathway enrichment analysis identified the 3 most highly upregulated pathways as EIF2 signaling, elF4/p70S6K signaling, and mTOR signaling (Figure 7C). Notably, the NRF2 oxidative stress response, hypoxia signaling, and oxidative phosphorylation were also upregulated (Figure 7C). To confirm that DMHCA induced LXR activation in HSCs, we performed a transcription factor activity analysis using the pySCENIC package, which calculates motif enrichments from the regulatory regions of all expressed genes to infer the activity level of known transcription factors. Using this approach, we found that LXRβ activity was increased in the DMHCA-treated cohort, while LXRα activity was below the level of detection for both (Figure 7D). These findings are consistent with DMHCA’s ability to activate LXR.
Figure 7. DMHCA treatment increases expression of immediate early response genes.

(A) Differentially expressed genes in DMHCA treated diabetic HSCs. (B) Heatmap of the top 100 log-transformed genes from the DGE analysis. (C) Top 10 pathways from IPA pathway enrichment analysis. (D) Transcription factor activity analysis of LXRβ in untreated and DMHCA-treated db/db mice.
DMHCA treatment enhances flux down the erythrocyte progenitor lineage.
Similar to most differentiation processes, hematopoiesis proceeds across a spectrum of gene expression changes rather than in discrete discernible steps. Thus, single-cell profiles of HSCs represent individual snapshots in time, where each cell falls somewhere along the differentiation spectrum. Pseudotime trajectory analysis relies on the identification of specific gene expression patterns within the data set to map the trajectory of cells along specific lineages. Using this technique, we identified 2 main differentiation pathways — one leading to megakaryocytes, erythrocytes, and DCs and another to peripheral circulating leukocytes (Figure 8A). Partition-based graph abstraction (PAGA) analysis uses a similar approach to physically map cells along a spectrum of gene expression changes and provides enhanced resolution. PAGA analysis of the combined data set revealed a similarly distinct split between megakaryocytes/basophils and erythrocytes and peripheral leukocytes, including lymphoid, monocyte, neutrophil, pre-B, and pre-T progenitors (Figure 8B). Differentiation along the peripheral leukocyte division mostly precedes through a transition state characterized by low-level expression of several lineage-specific genes, which we refer to as a neutrophil/monocyte/lymphoid metastate (Figure 8C). This metastate then trifurcates into neutrophil, lymphoid, and pre–T cell progenitors (Figure 8C). Finally, monocyte progenitors derive from the neutrophil progenitor population, while pre-B cells derive from lymphoid progenitors (Figure 8C).
Figure 8. Trajectory analysis of HSC differentiation reveals increased erythrocyte progenitor flux with DMHCA treatment.

(A) Pseudotime trajectory analysis identifies early partitioning of 2 distinct HSC differentiation pathways. (B) Diffusion embedding of PAGA analysis. (C) Ball-and-stick representation of PAGA analysis. Circle size represents number of cells, and line thickness represents connectivity between 2 groups of cells. (D) Gene expression changes of lineage-specific genes along pseudotime differentiation of 7 lineages. (E) Diffusion embedding of PAGA analysis separated by sample. (F) Compositional analysis showing density graphs of erythrocyte progenitors in untreated and DMHCA-treated diabetic HSCs. (G) Violin plots comparing HBB-BT gene expression across samples. (H) Spatial representation of HBB-BT gene expression across samples.
Interestingly, our analysis suggests that differentiation along the dendritic lineage appears more closely related to the megakaryocyte/basophil and erythrocyte family and may actually represent a distinct division arising directly from the HSC compartment (Figure 8C). In addition, we further analyzed the potentially novel AP1-high stem cell population to better understand to which lineages these cells contribute. PAGA analysis revealed that AP1-high stem cells are derived directly from HSCs and predominantly give rise to erythrocyte progenitors and, to a lesser degree, megakaryocyte/basophil and DC progenitors (Figure 8C). Consistent with our current view of differentiation, maturation along the aforementioned lineages occurs through a gradual increase in lineage-specific genes (Figure 8D).
Last, we separated the PAGA analysis into the 2 discrete sample groups and found that DMHCA enhanced flux down the erythrocyte progenitor lineage (Figure 8E). Compositional analysis comparing cellular densities between conditions confirmed the increase in erythrocyte progenitor density in DMHCA-treated BM (Figure 8F). Impressively, DMHCA not only expanded the proportion of erythrocyte progenitors, but also increased the expression of the hemoglobin β adult t chain (HBB-BT) (Figure 8, G and H). Together, these data suggest that, at the earliest stage of hematopoiesis, DMHCA treatment enhances the overall production and robustness of erythrocyte progenitors.
DMHCA enhances signaling in the AP1-high stem cell and erythrocyte progenitor populations.
We next focused on the AP1-high stem cell and erythrocyte progenitor populations to better understand how DMHCA influences these clusters. Compositional analysis confirmed an increase in the density of the AP1-high stem cell population with DMHCA treatment (Figure 9A). Based upon our trajectory analysis, which identified the AP1-high stem cell population as precursors to erythrocyte progenitors, the increase in AP1-high stem cells is consistent with the observed enhancement in erythrocyte flux. We next performed a DGE analysis comparing the AP1-high stem cell populations in untreated and DMHCA-treated mice. Owing to the relatively small number of cells in this population (261 cells total), only 9 genes were found to be differentially expressed and included, among others, the AP1 genes FOS and FOSB and the Krüppel-like family of transcription factors (KLFs) KLF6 and KLF2 (Figure 9B). Pathway enrichment analysis focusing on intracellular and secondary messenger signaling identified the ERK and MAPK pathways as the most enriched, followed by glucocorticoid and JAK/STAT signaling (Figure 9C).
Figure 9. DMHCA induces subpopulation gene expression changes and enhances AP1 signaling.

(A) Compositional analysis showing density graphs of AP1-high stem cells in untreated and DMHCA-treated diabetic HSCs. (B) Heatmap of differentially expressed genes in AP1-high stem cells from untreated and DMHCA treated HSCs. (C) Significantly enriched secondary/intracellular signaling pathways in DMHCA-treated AP1-high stem cells from IPA pathway enrichment analysis. (D) Heatmap of differentially expressed genes in erythrocyte progenitors from untreated and DMHCA-treated HSCs. (E) Significantly enriched secondary/intracellular signaling pathways in DMHCA-treated erythrocyte progenitors from IPA pathway enrichment analysis. (F) Violin plots comparing expression of AP1 complex genes across samples and clusters. (G) Spatial representation of AP1 complex gene expression across samples.
Next, we performed a DGE analysis comparing the erythrocyte progenitor populations in untreated and DMHCA-treated mice. Across 517 cells, 48 differentially expressed genes were identified (Figure 9D). Of note, these included genes involved in the immediate early response (FOS, FOSB, MYC, and IER2), hemoglobin synthesis (HBB-BT), and ribosome synthesis (RPS29, RPS19, RPS28, RPL37, and RPL14) (Figure 9D). Using these 48 differentially expressed genes, we performed pathway enrichment focusing on intracellular and secondary messenger signaling. Similar to the AP1-high stem cell population, glucocorticoid, ERK5, and JAK/STAT pathways were significantly enriched (Figure 9E). However, unlike the AP1-high population, the largest enrichment in erythrocyte progenitors was related to translation initiation (EIF2 and EIF4/p70S6K signaling) (Figure 9E).
Last, we examined the distribution of AP1 genes across the 13 clusters of the untreated and DMHCA-treated diabetic mice. FOS, which encodes the c-Fos protein, is predominantly expressed in the AP1-high stem cell and naive B cell populations (Figure 9, F and G). DMHCA increased FOS expression in nearly all clusters, including most strongly the AP1-high stem cell and naive B cell populations (Figure 9, F and G). FOSB expression is highly specific to the AP1-high stem cell and naive B cell populations, and DMHCA increased FOSB in these 2 clusters (Figure 9, F and G). JUNB is expressed to varying degrees in all clusters but is predominantly found in the AP1-high stem cell and naive B cell populations (Figure 9, F and G). DMHCA treatment increased JUNB expression in all clusters, especially the AP1-high stem cell and naive B cell populations (Figure 9, F and G). Last, JUN (c-Jun) and JUND are highly expressed in all clusters, and DMHCA caused a pan-increase in their transcriptional expression (Figure 9, F and G).
Discussion
Given the selective nature of DMHCA’s mechanism of LXR agonism, which promotes cholesterol efflux and hampers systemic inflammation with less induction of hypertriglyceridemia compared with earlier agents, we chose DMHCA for our studies. In aged diabetic db/db mice, DMHCA treatment restores retinal cholesterol homeostasis, slows the development of DR, hampers chronic systemic inflammation, and corrects BM dysfunction. In circulating vascular reparative cells from diabetic patients and db/db mice, DMHCA rejuvenates membrane fluidity and promotes BM egression.
Normally, the retina maintains cholesterol homeostasis by an intricate balance between cholesterol production via local biosynthesis (49–53) and uptake of lipoprotein particles from the circulation, which is opposed by cholesterol efflux via the reverse cholesterol transport pathway or through metabolism of cholesterol to more soluble oxysterols by cytochrome P450s 27A1 and 46A1 (53–57). We have previously reported a reduction in LXR levels in the diabetic retina and in retinal endothelial and retinal pigment epithelial cells isolated from diabetic donor tissue (19). Moreover, we have demonstrated that genetic LXR downregulation produces retinal phenotypes similar to DR in the absence of diabetes. Reduction in LXR expression in diabetes leads to a decrease in reverse cholesterol transport. Moreover, diabetes-induced decrease in the production of natural LXR agonists, oxysterols, further exacerbates retinal cholesterol removal in diabetes. The present study using highly sensitive quantitative LC-MS to measure free and total sterols in the diabetic retina confirmed the effect of diabetes on retinal cholesterol removal pathways and provides insights into the dysfunctional cholesterol homeostasis observed in diabetes. Indeed, we have demonstrated that the total level of cholesterol was significantly increased in the diabetic retina. An increase in cholesterol biosynthesis markers in the retina shows loss of cholesterol homeostasis, with increased cholesterol biosynthesis in spite of already increased cholesterol levels. Remarkably, systemic treatment with DMHCA showed improvement in many aspects of retinal cholesterol metabolism disrupted by diabetes. DMHCA is a synthetic LXR agonist that also inhibits Dhcr24, the enzyme that catalyzes the last step of cholesterol biosynthesis. Indeed, DMHCA treatment led to accumulation of lanosterol and desmosterol and a decrease in cholesterol in the retina due to inhibition of the last step of cholesterol biosynthesis.
In addition to inhibition of cholesterol biosynthesis, we observed that DMHCA reversed diabetes-induced downregulation of LXR-mediated reverse cholesterol transport. DMHCA promotes LXR activation by acting as a direct synthetic agonist, as well as increasing the levels of another potent LXR agonist, desmosterol. DMHCA or desmosterol agonism initiates LXR binding to and promoter activity of the cholesterol efflux pump ABCA1, further contributing to the reduction of retinal cholesterol levels through an increase in cholesterol efflux. Moreover, DMHCA treatment increased free oxysterols showing that DMHCA promotes retinal cholesterol removal by yet another mechanism — through shifting cholesterol metabolism to favor more soluble oxysterols that rapidly diffuse to the systemic circulation and are converted to bile acids by the liver (57). Overall, our data demonstrate that DMHCA treatment can restore cholesterol homeostasis in the retina through both inhibition of cholesterol biosynthesis and activation of cholesterol efflux by RCT and oxysterol pathways.
To test whether the lipidomic benefits afforded by LXR agonism are sufficient to provide structural and functional benefit in diabetes, we assessed retinal function and membrane fluidity in circulating vascular reparative cells derived from diabetic subjects and mice. We found that DMHCA treatment corrected several retinopathy endpoints in db/db mice, including reduced vascular dropout and enhanced visual function. Remarkably, in diabetic human–derived CD34+ cells, acute ex vivo treatment with DMHCA was sufficient to restore membrane fluidity correcting diabetes-induced dysfunction of circulating vascular reparative cells. Interestingly, DMHCA treatment also reduced leukocyte trafficking to the diabetic retina, providing compelling evidence of DMHCA’s antiinflammatory effects in diabetes.
To test whether DMHCA’s antiinflammatory effects extend to the level of the peripheral circulation and BM, we assessed these compartments for inflammatory markers and quantified the proportions of specific cell populations. DMHCA treatment significantly reduced the expression of several important proinflammatory proteins in the BM, including TNF-α, IL-3, and CCL-2. Moreover, DMHCA treatment significantly reduced circulating monocytes and increased the proportion of vascular reparative cells in the BM and circulation (58, 59). Vascular reparative cells are particularly sensitive to alterations in membrane fluidity, as they require flexibility to egress into the circulation and complex intercellular signaling networks to home to areas of injury. These findings on the increased production and egression of CACs complement our membrane fluidity results and suggest that the improvements in membrane fluidity have functional benefits.
Given the beneficial effects of LXR agonism on correcting the homeostatic balance of BM-derived cells, we next explored the HSC and progenitor compartments to test whether DMHCA treatment directly influences hematopoiesis. In LSK cells, DMHCA treatment was sufficient to correct the diabetes-induced increase in MPPs and decrease in LT-HSCs. Moreover, DMHCA reduced GMP hyperplasia and increased the production of megakaryocyte/erythrocyte progenitors. Last, DMHCA treatment was sufficient to lower ex vivo granulocyte/macrophage CFUs to baseline levels. Taken together, these findings suggest that DMHCA’s benefits extend to the HSC compartment and that LXR agonism corrects diabetic myeloidosis.
To better understand the transcriptional mechanisms responsible for the beneficial effects of LXR agonism on hematopoiesis in the setting of T2D, we performed scRNA-seq on untreated and DMHCA-treated LSK cells. One striking finding in our analysis is that even the most primitive hematopoietic cells appear preprogrammed to enter specific lineages. This is supported by the 13 cell populations identified by unsupervised clustering, which account for nearly all of the main lineages derived from the BM. Another exciting finding from our scRNA-seq analysis is that DC differentiation appears to be more nuanced than previously suggested. A recent single-cell report using c-kit+ murine BM found that dendritic and monocyte lineages split late in differentiation (60). Our trajectory analysis, which uses a more primitive population of cells and thus provides a higher resolution of early fate decisions, suggests that the dendritic lineage is more closely related to the megakaryocyte/basophil and erythrocyte family and may actually represent a distinct division arising directly from the HSC compartment. Interestingly, in another recent scRNA-seq report on murine LSK sorted HSCs, the authors did not mention the DC lineage (61). However, inspection of their publicly available data set for expression of early DC markers (CD74, H2-AA, H2-EB1) — as defined by Tusi et al. (60) — demonstrated close association of these genes with the HSC population (Supplemental Figure 5), supporting our results. This finding on the DC lineage may have important implications, as it suggests that the development of an entire arm of the immune system may be fundamentally different from all other immune cells, which in our analysis, derive from a shared hematopoietic branch. Last, our analysis identifies a potentially novel stem cell population, which we refer to as AP1-high stem cells. This relatively small population of cells express disproportionately high levels of AP1 complex genes and largely lack lineage specification. Trajectory analysis suggests that AP1-high stem cells predominantly give rise to erythrocyte progenitors and, to a lesser degree, megakaryocyte/basophil and DC progenitors. Thus, this cluster may represent a novel HSC population that is an intermediate to the aforementioned lineages.
The main findings from our DMHCA-treated sample were a decrease in the multipotent stem cell population and an increase in the AP1-high stem cell and erythrocyte progenitor populations. Both of these findings are supported in our BM HSC studies, which found that DMHCA suppressed diabetes-induced hyperplasia of MPPs and increased production of erythrocyte/megakaryocyte progenitors. Based upon our trajectory analysis, which identified the AP1-high stem cell population as precursors to erythrocyte progenitors, the increase in AP1-high stem cells is consistent with the observed enhancement in erythrocyte progenitor flux. DGE analysis demonstrated that DMHCA increased the expression of several LXR target genes (60), confirming that DMHCA directly modulates these primitive cells. Moreover, we observed a striking increase in immediate early response genes. These gene targets, such as FOS, EGR1, and MYC, are pleiotropic factors involved in many cell processes, including differentiation. They are termed immediate genes because they are rapidly induced in response to inter- and intracellular signaling (61). Many of these genes have well-characterized roles in hematopoiesis. For example, FOS expression is known to limit HSC hyperplasia (62), whereas FOS depletion results in a > 90% reduction of clonogenic B cell precursors (63). Both of these observation are consistent with our results herein. Given our previous findings on improved membrane fluidity with DMHCA treatment, the increase in immediate early gene expression in HSCs is not surprising, as the enhanced formation of membrane microdomains amplifies the transduction of intercellular signaling. The most highly enriched pathways in DMHCA-treated HSCs were related to ribosome synthesis/translation initiation (EIF2 and EIF4/p70S6K signaling) and mTOR signaling. Moreover, pathway enrichment analysis indicated upregulation of the hypoxia and Nrf2 pathways. At normal steady-state, the BM microenvironment is hypoxic, and cellular stress stimulates increase BM partial pressure of oxygen (pO2) (64). Nrf2 is the master regulator of several cellular antioxidant pathways. As Nrf2 expression is decreased in diabetic BM cells (65), DMHCA-induced upregulation of Nrf2 may function as a prosurvival response. Together, these findings suggest that DMHCA treatment normalizes the BM microenvironment.
Last, we found key genes and intracellular pathways that were differentially regulated in the treated versus untreated AP1-high stem cell and erythrocyte progenitor populations. DMHCA-treated AP1-high stem cells showed increased AP1 complex genes, as well as increased expression of KLF2 and -6, two genes required for normal erythrocyte development (66, 67). Of note is the increase in MYC expression, which has recently been shown to induce proliferation of erythroid progenitor cells (68). DGE analysis also showed significantly increased hemoglobin gene expression, suggesting that DMHCA not only increases erythrocyte progenitor flux, but also stimulates the generation of more robust erythrocyte progenitors. Taken together, these data demonstrate that DMHCA enhances HSC signaling and improves erythrocyte differentiation in diabetes.
An important characteristic of DMHCA that is worth noting is its chemical structure. DMHCA is a synthetic oxysterol with a shortened sidechain and amide moiety, giving it amphipathic properties. Like other oxysterols, DMHCA may incorporate into the exofacial leaflet of bilayers and thereby directly modify membrane dynamics and the functions of integral and membrane-associated proteins (69). This possibility, while not directly measured in this study, may contribute to the observed beneficial and pleotropic effects of long-term DMHCA treatment on T2D db/db mice. One limitation of our study is that we did not include LXRα/β-deficient mice treated with DMHCA, which would have further addressed what portion of the effect we observed was due to LXR agonism and what could have been the result of the biophysical effects of DMHCA on membrane bilayers. However, such studies were performed by Patel et al., where STZ-injected Lxrα/β−/− mice on a Western diet were treated with DMHCA and showed no beneficial effect on the kidneys of these mice, whereas DMHCA corrected diabetic nephropathy in WT STZ-injected mice (70).
Using a multisystem approach, this study demonstrates the broad and pleiotropic effects of LXR activation. While the chemical properties of DMHCA and its potential ability to incorporate into the membrane could account for some of the observed pleotropic effects, our results provide support for the future development of potential therapeutics that capture the benefits of LXR agonism. However, the simultaneous inhibition of SREBP1c will be required, likely heralding the future development of combination therapies to optimize cholesterol homeostasis in diabetic individuals.
Methods
A detailed description of electroretinogram (ERG), qPCR, immunofluorescence staining, cytokines quantification, and BM analysis is included in Supplemental Methods.
Human study.
Study subjects were recruited as healthy controls (n = 19) or patients with diabetes (n = 19) with either no retinopathy or with different stages of DR. Subjects were enrolled according to the criteria presented in Supplemental Table 1.The degree of DR was assessed using color fundus imaging and fluorescence angiography. Peripheral blood was obtained for plasma collection and CD34+ cell isolation.
Human CD34+ cell preparation.
A total of 120 mL of peripheral blood was diluted with PBS (1:1). Then, every 25 mL–diluted blood sample was gently overlaid on 12.5 mL Ficoll-Paque Plus (catalog 17–1440-02, GE Healthcare) in 50-mL tubes. After centrifugation at 800 g for 30 minutes, the buffy coat was transferred into a new 50-mL tube and washed 3 times with PBS supplemented with 2% FBS and 1 mM EDTA. Peripheral blood mononuclear cells were then enriched for CD34+ cells by the human CD34+ selection Kit (catalog 18056, Stemcell Technologies) using EasySep magnets.
Membrane fluidity.
CAC isolated from control or diabetic mice and CD34+ cells were left untreated or treated with DMHCA at 10 μM overnight (16–18 hours) in StemSpan SFEM + CC 110 media at 37°C.
Perylene stock solution (1 mM) was prepared in dimethyl sulfoxide DMSO (MilliporeSigma), aliquoted, and stored in a –80°C freezer. CACs were stained with 10 μM perylene for 10 minutes, centrifuged (0.8 or 1 × 10³ g, 10 minutes, 20°C, Thermo Fisher Scientific AccuSpin Micro 17R) to removed access dye, and kept at 37°C until use. A 0.8-μL aliquot was pipetted on a microscope slide (Thermo Fisher Scientific plain microscope slides, precleaned, 25 × 75 mm × 1 mm thick) and a cover-glass was placed on top (Corning, 22 × 22 mm of 1-mm thickness). The assembly was turned upside down and positioned on the flat stage of the FRAP instrument (vide infra).
FRAP measurements.
FRAP was performed as previously described (71, 72). Samples were placed on a motorized stage of a confocal scanning microscope (Nikon C2+), and images using 40× objective and 405 excitation laser. NIS-Elements Acquisition imaging software (v 4.30) was used for FRAP experiments, with settings of pixel dwell 1.9, size 512, normal, DAPI checked, HV between 90 and 145 (typically ~125), offset of 10, and laser power 0.71. The 40× objective was used to locate cells, and region of interest (ROI) was either a 3 μm or 2 μm diameter for human or mouse samples, respectively; one was used as the stimulating spot and the other as a standard, placed in a dark, nonfluorescent spot. A continuous scanning time measurement was performed to ensure the cell did not move, indicated by a constant fluorescence intensity value over time. There was 1 minute of data acquisition (for 61 loops) at 1-second intervals, bleaching for 1 second (4 loops) with no delay in intervals, and acquisition for another 5 minutes (301 loops) at 1-second intervals. Data were fit using IGOR Pro software (WaveMetrics Inc.).
Experiment design for murine studies.
Male B6.BKS(D)-Leprdb/J (stock no. 000697) homozygous Leprdb/db were diabetic, and heterozygous Leprdb/m were used as controls (denoted as db/db and db/m, respectively). All mice were obtained from The Jackson Laboratory and housed in the institutional animal care facilities at the University of Alabama at Birmingham (IACUC 20917) with strict 12-hour/12-hour light/dark cycle. Animals were considered as diabetic and used in the DMHCA treatment if the serum glucose level was above 250 mg/dL on 2 consecutive measurements. Animals have been randomly assigned to experimental groups. The animals received DMHCA (Avanti Polar Lipids) in their chow (8 mg/kg body weight/day or base diet). The animals were fed the test diets for 6 months after diabetic onset. The db/m and db/db mice were each divided in 2 subgroups, with half the mice in each group receiving control chow and the other half receiving DMHCA containing chow.
Lipid extraction.
Mouse retinas were subjected to monophasic lipid extraction in methanol/chloroform/water (2:1:0.74, v:v:v) as previously described (73).
Analysis of free and total sterol content.
Sterols and oxysterols were analyzed by high-resolution/accurate mass LC-MS using a Shimadzu Prominence HPLC equipped with an in-line solvent degassing unit, autosampler, column oven, and 2 LC-20AD pumps, coupled to a Thermo Fisher Scientific LTQ-Orbitrap Velos mass spectrometer. Lipid extracts were used directly for analysis of free sterols and oxysterols or were subjected to alkaline hydrolysis of sterol esters for analysis of total cellular sterols as previously described (74). Gradient conditions, peak finding, and quantitation of sterols and oxysterols were performed as previously described (75). Sterol and oxysterol identifications were performed by comparison of retention time, exact mass, and MS/MS profiles to authentic standards purchased from Steraloids.
Acellular capillaries.
Eyes were fixed in 2% formalin, and trypsin digest was performed for analysis of acellular capillaries as previously published (76).
CFU.
Analysis of CFUs was performed as previously published (77).
Flow cytometry analysis.
A total of 2 × 10⁶ cells isolated from BM and 100 μL of peripheral blood was incubated with Ammonium Chloride solution (Stemcell Technologies, catalog 07850) for 14 minutes on ice to lyse RBCs. The cells were washed twice with PBS 2% FBS and incubated with a cocktail of primary antibodies for 30 minutes at 4°C in the dark; for the panel of antibodies for myeloid analysis, refer to Supplemental Table 2. To quantify precursor cells in the BM, 1 × 10⁶ cells were incubate with a cocktail of antibodies containing c‑Kit (CD117), viability dye 510, FcyRII/III, Sca-1, lineage cocktail, CD34, FLT3 (CD135), and CD127; for the panel of antibodies for precursor analysis, refer to Supplemental Table 3. After washing, the cells were acquired on BD FACSCelesta. Retina cells were isolated by incubating the entire retina with the digesting buffer (RPMI 5% FBS, 10 μg/mL collagenase D, and 300 U/mL DNase) for 1 hour at 37°C. The suspension of cells was filtrated in a 40-μm cell strainer and incubated with a cocktail of antibodies containing anti-F4/80, viability dye 510, Ly6G, CD45, CD11b, CCR2, CD133, CD206, Ly6C, and Flk-1; for the list of antibodies, refer to Supplemental Table 4. All the flow cytometry analyses were performed using FlowJo software (Tree Star Inc.).
10X Genomics single cells.
For scRNA-seq, BM single-cell suspensions were generated from 9-month-old untreated and DMHCA-treated db/db mice. Briefly, BM cells were aspirated from femur samples and filtered through 40 μm mesh. Single-cell suspensions were column enriched for Sca-1+, FACS sorted using lineage– and c-Kit1+ markers, and assayed for viability using trypan blue. Viable cells were then run through the 10X genomics platform for droplet-based single-cell barcoding and cDNA generation. Illumina HiSeq was used for cDNA sequencing. The 10X Genomics Software Cell Ranger (version 3.1.0) was used for quality control of sequencing reads, FASTQ file generation, and demultiplexing. The STAR software was used for read alignment using the mouse mm10 reference genome.
scRNA-seq data analysis.
For scRNA-seq data analysis, multiple software platforms were used, including Scanpy, Monocle, and Seurat (78). For transcript quality control, Scanpy was used to plot histograms of total counts per cell and genes per cell, which were then used to identify cutoffs that eliminated doublets and damaged cells. Additionally, a mitochondrial gene percentage cutoff of 20% was used to further eliminate damaged cells. After quality control, 5103 cells were recovered from the untreated diabetic group and 5152 cells from the DMHCA-treated group, for a total of 10,255 cells. The 2 treatment groups were then concatenated to form a single data file, and a minimum cutoff of 10 cells per gene was used to eliminate lowly represented genes. Normalization was performed using Scran, which employs a pooling-based size factor estimation method to normalize single-cell transcript data across heterogenous cell populations (79). Scanpy was then used to perform complete cell cycle regression using the cell cycle genes identified by Tirosh et al. (80). ComBat was used for batch correction with cell cycle scores included as covariates (81). Scanpy was then used to select 4500 highly variable genes, and the uniform manifold approximation and projection (UMAP) plot was generated using a resolution of 0.8. Subclustering was then performed to arrive at the final UMAP representation of 13 clusters. Scanpy was used to identify marker genes for each cluster. The assignment of cluster identities was guided by the expression of lineage-specific marker genes identified in previous scRNA-seq data sets on murine HSCs (82). In the case of undefined cell populations, clusters were identified based on their unique expression patterns and the presence/absence of lineage-specific markers. Compositional analysis was done using Scanpy.
To identify differentially expressed genes across total samples or specific cluster subpopulations, model-based analysis of single-cell transcriptomics (MAST) was used and the analysis included the technical covariate number of genes expressed per cell (83). An FDR cutoff of 0.01 was used in the total sample DGE, while a cutoff of 0.05 was used in the subpopulation analyses. Pathway enrichment analysis was performed using Ingenuity Pathways Analysis (IPA; QIAGEN), with all canonical pathways used in the total sample DGE and secondary messenger/intracellular signaling pathways in the subpopulation analyses.
Transcription factor activity was analyzed with the pySCENIC package using the preprocessed raw count matrices (84). Pseudotime trajectory analysis was performed using Monocle with the naive B cell population removed and max components set to 3. PAGA analysis was performed using the preprocessed data file with the threshold set to 0.07. Seurat was used to graph the violin plots.
Statistics.
All data sets were assessed for normality against a Gaussian Distribution via the Shapiro-Wilks test. Data composed of more than 2 individual groups that were determined to be normally distributed were subjected to a 1-way parametric ANOVA with Tukey’s test for multiple comparisons. Data composed of more than 2 individual groups that were determined to be nonnormally distributed were subjected to a Kruskal-Wallis test with multiple comparison correction via Dunn’s test. A value of P < 0.05 was considered to be statistically significant for all tests. All values are expressed as mean ± SEM. Statistical tests were performed using statistics software (GraphPad Software).
Study approval. All human studies were approved by the IRBs at the University of Alabama (IRB-300000068). All mice were housed in the institutional animal care facilities at the University of Alabama at Birmingham (IACUC 20917).
Author contributions
CPV designed and performed experiments, analyzed and interpreted results, and wrote the manuscript. SDF analyzed scRNA-seq data, interpreted the data, and wrote the paper. MH performed membrane fluidity assays, analyzed and interpreted the data, and wrote the paper. ALL performed and analyzed flow cytometry experiments, interpreted the data, wrote the paper, and performed aspects of the scRNA-seq study. BAB, MSS, YAA, JLF, and SLC performed the animal experiments. DKC aligned sequencing reads and generated feature-barcode matrices. RSW reviewed the analysis of scRNA-seq data, discussed the results, and interpreted the data. GJB analyzed data, discussed the results, and interpreted the data for the membrane fluidity study. JVB designed experiments, discussed and interpreted results, and revised the paper. MBG designed experiments, interpreted the data, discussed the results, wrote the manuscript, and is the guarantor of this work; as such, MBG had full access to all the data in the study and takes responsibility for the integrity of the data and the accuracy of the data analysis. SSH performed membrane fluidity sample preparation, data analysis, and interpretation. MD performed the animal experiments. TL performed the lipid analysis and data interpretation.
Supplementary Material
Acknowledgments
This study was supported by an Unrestricted Grant from Research to Prevent Blindness and NIH grants R01EY025383, R01EY012601, R01EY028858, R01EY028037, to MBG; R01EY030766, R01EY016077 to JVB; 5T32GM008361-27 to SDF; F32EY028426 to SSH; T32HL134640-01 to MD; and T32HL105349 to JLF.
The authors are grateful for Luecken and Theis (78) whose tutorial on the current best practices in scRNA-seq analyses formed the foundation of the analysis herein.
Version 1. 07/09/2020
Electronic publication
Footnotes
Conflict of interest: The authors have declared that no conflict of interest exists.
Copyright: © 2020, American Society for Clinical Investigation.
Reference information: JCI Insight. 2020;5(13):e137230.https://doi.org/10.1172/jci.insight.137230.
Contributor Information
Seth D. Fortmann, Email: sfortma2@uab.edu.
Masroor Hossain, Email: hossain8@chemistry.msu.edu.
Sandra S. Hammer, Email: shammer@msu.edu.
Bright Asare-Bediako, Email: basareb@uab.edu.
Yvonne Adu-Agyeiwaah, Email: yvonnad@uab.edu.
Mariana Dupont, Email: Marianaddupont@gmail.com.
Sergio Li Calzi, Email: scalzi@uabmc.edu.
Todd Lydic, Email: lydictod@msu.edu.
Robert S. Welner, Email: rwelner@uab.edu.
Julia V. Busik, Email: busik@msu.edu.
References
- 1.ACCORD Study Group. et al. Effects of medical therapies on retinopathy progression in type 2 diabetes. N Engl J Med. 2010;363(3):233–244. doi: 10.1056/NEJMoa1001288. [DOI] [PMC free article] [PubMed] [Google Scholar]
- 2.Sandhoff R, Brügger B, Jeckel D, Lehmann WD, Wieland FT. Determination of cholesterol at the low picomole level by nano-electrospray ionization tandem mass spectrometry. J Lipid Res. 1999;40(1):126–132. [PubMed] [Google Scholar]
- 3.Stancu C, Sima A. Statins: mechanism of action and effects. J Cell Mol Med. 2001;5(4):378–387. doi: 10.1111/j.1582-4934.2001.tb00172.x. [DOI] [PMC free article] [PubMed] [Google Scholar]
- 4.Niesor EJ, et al. Statin-induced decrease in ATP-binding cassette transporter A1 expression via microRNA33 induction may counteract cholesterol efflux to high-density lipoprotein. Cardiovasc Drugs Ther. 2015;29(1):7–14. doi: 10.1007/s10557-015-6570-0. [DOI] [PubMed] [Google Scholar]
- 5.Zheng W, Mast N, Saadane A, Pikuleva IA. Pathways of cholesterol homeostasis in mouse retina responsive to dietary and pharmacologic treatments. J Lipid Res. 2015;56(1):81–97. doi: 10.1194/jlr.M053439. [DOI] [PMC free article] [PubMed] [Google Scholar]
- 6.Bryszewska M, Watała C, Torzecka W. Changes in fluidity and composition of erythrocyte membranes and in composition of plasma lipids in type I diabetes. Br J Haematol. 1986;62(1):111–116. doi: 10.1111/j.1365-2141.1986.tb02906.x. [DOI] [PubMed] [Google Scholar]
- 7.Kruit JK, et al. Islet cholesterol accumulation due to loss of ABCA1 leads to impaired exocytosis of insulin granules. Diabetes. 2011;60(12):3186–3196. doi: 10.2337/db11-0081. [DOI] [PMC free article] [PubMed] [Google Scholar]
- 8.Simons K, Ehehalt R. Cholesterol, lipid rafts, and disease. J Clin Invest. 2002;110(5):597–603. doi: 10.1172/JCI16390. [DOI] [PMC free article] [PubMed] [Google Scholar]
- 9.Chen W, Jump DB, Esselman WJ, Busik JV. Inhibition of cytokine signaling in human retinal endothelial cells through modification of caveolae/lipid rafts by docosahexaenoic acid. Invest Ophthalmol Vis Sci. 2007;48(1):18–26. doi: 10.1167/iovs.06-0619. [DOI] [PMC free article] [PubMed] [Google Scholar]
- 10.Sohn J, Lin H, Fritch MR, Tuan RS. Influence of cholesterol/caveolin-1/caveolae homeostasis on membrane properties and substrate adhesion characteristics of adult human mesenchymal stem cells. Stem Cell Res Ther. 2018;9(1):86. doi: 10.1186/s13287-018-0830-4. [DOI] [PMC free article] [PubMed] [Google Scholar]
- 11.Wang B, Tontonoz P. Liver X receptors in lipid signalling and membrane homeostasis. Nat Rev Endocrinol. 2018;14(8):452–463. doi: 10.1038/s41574-018-0037-x. [DOI] [PMC free article] [PubMed] [Google Scholar]
- 12.Janowski BA, Willy PJ, Devi TR, Falck JR, Mangelsdorf DJ. An oxysterol signalling pathway mediated by the nuclear receptor LXR alpha. Nature. 1996;383(6602):728–731. doi: 10.1038/383728a0. [DOI] [PubMed] [Google Scholar]
- 13.Ishibashi M, et al. Knock-down of the oxysterol receptor LXRα impairs cholesterol efflux in human primary macrophages: lack of compensation by LXRα activation. Biochem Pharmacol. 2013;86(1):122–129. doi: 10.1016/j.bcp.2012.12.024. [DOI] [PubMed] [Google Scholar]
- 14.Rong X, et al. LXRs regulate ER stress and inflammation through dynamic modulation of membrane phospholipid composition. Cell Metab. 2013;18(5):685–697. doi: 10.1016/j.cmet.2013.10.002. [DOI] [PMC free article] [PubMed] [Google Scholar]
- 15.Cermenati G, et al. Diabetes-induced myelin abnormalities are associated with an altered lipid pattern: protective effects of LXR activation. J Lipid Res. 2012;53(2):300–310. doi: 10.1194/jlr.M021188. [DOI] [PMC free article] [PubMed] [Google Scholar]
- 16.Cermenati G, et al. Activation of the liver X receptor increases neuroactive steroid levels and protects from diabetes-induced peripheral neuropathy. J Neurosci. 2010;30(36):11896–11901. doi: 10.1523/JNEUROSCI.1898-10.2010. [DOI] [PMC free article] [PubMed] [Google Scholar]
- 17.Joseph SB, et al. Synthetic LXR ligand inhibits the development of atherosclerosis in mice. Proc Natl Acad Sci USA. 2002;99(11):7604–7609. doi: 10.1073/pnas.112059299. [DOI] [PMC free article] [PubMed] [Google Scholar]
- 18.Hazra S, et al. Liver X receptor modulates diabetic retinopathy outcome in a mouse model of streptozotocin-induced diabetes. Diabetes. 2012;61(12):3270–3279. doi: 10.2337/db11-1596. [DOI] [PMC free article] [PubMed] [Google Scholar]
- 19.Hammer SS, et al. The Mechanism of Diabetic Retinopathy Pathogenesis Unifying Key Lipid Regulators, Sirtuin 1 and Liver X Receptor. EBioMedicine. 2017;22:181–190. doi: 10.1016/j.ebiom.2017.07.008. [DOI] [PMC free article] [PubMed] [Google Scholar]
- 20.Chisholm JW, Hong J, Mills SA, Lawn RM. The LXR ligand T0901317 induces severe lipogenesis in the db/db diabetic mouse. J Lipid Res. 2003;44(11):2039–2048. doi: 10.1194/jlr.M300135-JLR200. [DOI] [PubMed] [Google Scholar]
- 21.Kirchgessner TG, et al. Beneficial and Adverse Effects of an LXR Agonist on Human Lipid and Lipoprotein Metabolism and Circulating Neutrophils. Cell Metab. 2016;24(2):223–233. doi: 10.1016/j.cmet.2016.07.016. [DOI] [PubMed] [Google Scholar]
- 22.Quinet EM, Savio DA, Halpern AR, Chen L, Miller CP, Nambi P. Gene-selective modulation by a synthetic oxysterol ligand of the liver X receptor. J Lipid Res. 2004;45(10):1929–1942. doi: 10.1194/jlr.M400257-JLR200. [DOI] [PubMed] [Google Scholar]
- 23.Lund EG, et al. Different roles of liver X receptor alpha and beta in lipid metabolism: effects of an alpha-selective and a dual agonist in mice deficient in each subtype. Biochem Pharmacol. 2006;71(4):453–463. doi: 10.1016/j.bcp.2005.11.004. [DOI] [PubMed] [Google Scholar]
- 24.Miao B, et al. Raising HDL cholesterol without inducing hepatic steatosis and hypertriglyceridemia by a selective LXR modulator. J Lipid Res. 2004;45(8):1410–1417. doi: 10.1194/jlr.M300450-JLR200. [DOI] [PubMed] [Google Scholar]
- 25.Kratzer A, et al. Synthetic LXR agonist attenuates plaque formation in apoE-/- mice without inducing liver steatosis and hypertriglyceridemia. J Lipid Res. 2009;50(2):312–326. doi: 10.1194/jlr.M800376-JLR200. [DOI] [PMC free article] [PubMed] [Google Scholar]
- 26.El-Darzi N, Astafev A, Mast N, Saadane A, Lam M, Pikuleva IA. N,N-Dimethyl-3β-hydroxycholenamide Reduces Retinal Cholesterol via Partial Inhibition of Retinal Cholesterol Biosynthesis Rather Than its Liver X Receptor Transcriptional Activity. Front Pharmacol. 2018;9:827. doi: 10.3389/fphar.2018.00827. [DOI] [PMC free article] [PubMed] [Google Scholar]
- 27.Fessler MB. The challenges and promise of targeting the Liver X Receptors for treatment of inflammatory disease. Pharmacol Ther. 2018;181:1–12. doi: 10.1016/j.pharmthera.2017.07.010. [DOI] [PMC free article] [PubMed] [Google Scholar]
- 28.Pfeifer T, et al. Synthetic LXR agonist suppresses endogenous cholesterol biosynthesis and efficiently lowers plasma cholesterol. Curr Pharm Biotechnol. 2011;12(2):285–292. doi: 10.2174/138920111794295774. [DOI] [PMC free article] [PubMed] [Google Scholar] [Research Misconduct Found]
- 29.Repa JJ, et al. Regulation of mouse sterol regulatory element-binding protein-1c gene (SREBP-1c) by oxysterol receptors, LXRalpha and LXRbeta. Genes Dev. 2000;14(22):2819–2830. doi: 10.1101/gad.844900. [DOI] [PMC free article] [PubMed] [Google Scholar]
- 30.Schulman IG. Liver X receptors link lipid metabolism and inflammation. FEBS Lett. 2017;591(19):2978–2991. doi: 10.1002/1873-3468.12702. [DOI] [PMC free article] [PubMed] [Google Scholar]
- 31.Song XY, et al. Retinal and optic nerve degeneration in liver X receptor β knockout mice. Proc Natl Acad Sci USA. 2019;116(33):16507–16512. doi: 10.1073/pnas.1904719116. [DOI] [PMC free article] [PubMed] [Google Scholar]
- 32.Choudhary M, et al. LXRs regulate features of age-related macular degeneration and may be a potential therapeutic target. JCI Insight. 2020;5(1):131928. doi: 10.1172/jci.insight.131928. [DOI] [PMC free article] [PubMed] [Google Scholar]
- 33.Ito A, et al. LXRs link metabolism to inflammation through Abca1-dependent regulation of membrane composition and TLR signaling. Elife. 2015;4:e08009. doi: 10.7554/eLife.08009. [DOI] [PMC free article] [PubMed] [Google Scholar]
- 34.Duan Y, et al. Bone Marrow-Derived Cells Restore Functional Integrity of the Gut Epithelial and Vascular Barriers in a Model of Diabetes and ACE2 Deficiency. Circ Res. 2019;125(11):969–988. doi: 10.1161/CIRCRESAHA.119.315743. [DOI] [PMC free article] [PubMed] [Google Scholar]
- 35.Dimmeler S, Zeiher AM. Vascular repair by circulating endothelial progenitor cells: the missing link in atherosclerosis? J Mol Med. 2004;82(10):671–677. doi: 10.1007/s00109-004-0580-x. [DOI] [PubMed] [Google Scholar]
- 36.Fadini GP, et al. Low CD34+ cell count and metabolic syndrome synergistically increase the risk of adverse outcomes. Atherosclerosis. 2009;207(1):213–219. doi: 10.1016/j.atherosclerosis.2009.03.040. [DOI] [PubMed] [Google Scholar]
- 37.Jarajapu YP, et al. Vasoreparative dysfunction of CD34+ cells in diabetic individuals involves hypoxic desensitization and impaired autocrine/paracrine mechanisms. PLoS One. 2014;9(4):e93965. doi: 10.1371/journal.pone.0093965. [DOI] [PMC free article] [PubMed] [Google Scholar]
- 38.Li Calzi S, et al. Progenitor cell combination normalizes retinal vascular development in the oxygen-induced retinopathy (OIR) model. JCI Insight. 2019;4(21):129224. doi: 10.1172/jci.insight.129224. [DOI] [PMC free article] [PubMed] [Google Scholar]
- 39.Rasheed A, Tsai R, Cummins CL. Loss of the Liver X Receptors Disrupts the Balance of Hematopoietic Populations, With Detrimental Effects on Endothelial Progenitor Cells. J Am Heart Assoc. 2018;7(10):e007787. doi: 10.1161/JAHA.117.007787. [DOI] [PMC free article] [PubMed] [Google Scholar]
- 40.Laffitte BA, et al. Autoregulation of the human liver X receptor alpha promoter. Mol Cell Biol. 2001;21(22):7558–7568. doi: 10.1128/MCB.21.22.7558-7568.2001. [DOI] [PMC free article] [PubMed] [Google Scholar]
- 41.Schultz JR, et al. Role of LXRs in control of lipogenesis. Genes Dev. 2000;14(22):2831–2838. doi: 10.1101/gad.850400. [DOI] [PMC free article] [PubMed] [Google Scholar]
- 42.Blanchard GJ, Busik JV. Interplay between Endothelial Cell Cytoskeletal Rigidity and Plasma Membrane Fluidity. Biophys J. 2017;112(5):831–833. doi: 10.1016/j.bpj.2017.01.013. [DOI] [PMC free article] [PubMed] [Google Scholar]
- 43.Chakravarthy H, et al. Role of Acid Sphingomyelinase in Shifting the Balance Between Proinflammatory and Reparative Bone Marrow Cells in Diabetic Retinopathy. Stem Cells. 2016;34(4):972–983. doi: 10.1002/stem.2259. [DOI] [PMC free article] [PubMed] [Google Scholar]
- 44.Ayee MAA, et al. Molecular-Scale Biophysical Modulation of an Endothelial Membrane by Oxidized Phospholipids. Biophys J. 2017;112(2):325–338. doi: 10.1016/j.bpj.2016.12.002. [DOI] [PMC free article] [PubMed] [Google Scholar]
- 45.Bogdanov P, et al. The db/db mouse: a useful model for the study of diabetic retinal neurodegeneration. PLoS One. 2014;9(5):e97302. doi: 10.1371/journal.pone.0097302. [DOI] [PMC free article] [PubMed] [Google Scholar]
- 46.Cheung AK, et al. Aldose reductase deficiency prevents diabetes-induced blood-retinal barrier breakdown, apoptosis, and glial reactivation in the retina of db/db mice. Diabetes. 2005;54(11):3119–3125. doi: 10.2337/diabetes.54.11.3119. [DOI] [PubMed] [Google Scholar]
- 47.Ferraro F, et al. Diabetes impairs hematopoietic stem cell mobilization by altering niche function. Sci Transl Med. 2011;3(104):104ra101. doi: 10.1126/scitranslmed.3002191. [DOI] [PMC free article] [PubMed] [Google Scholar]
- 48.Hazra S, et al. Long-term type 1 diabetes influences haematopoietic stem cells by reducing vascular repair potential and increasing inflammatory monocyte generation in a murine model. Diabetologia. 2013;56(3):644–653. doi: 10.1007/s00125-012-2781-0. [DOI] [PMC free article] [PubMed] [Google Scholar]
- 49.Fliesler SJ, Florman R, Rapp LM, Pittler SJ, Keller RK. In vivo biosynthesis of cholesterol in the rat retina. FEBS Lett. 1993;335(2):234–238. doi: 10.1016/0014-5793(93)80736-E. [DOI] [PubMed] [Google Scholar]
- 50.Fliesler SJ, Florman R, Keller RK. Isoprenoid lipid metabolism in the retina: dynamics of squalene and cholesterol incorporation and turnover in frog rod outer segment membranes. Exp Eye Res. 1995;60(1):57–69. doi: 10.1016/S0014-4835(05)80084-3. [DOI] [PubMed] [Google Scholar]
- 51.Lin JB, et al. Cholesterol in mouse retina originates primarily from in situ de novo biosynthesis. J Lipid Res. 2016;57(2):258–264. doi: 10.1194/jlr.M064469. [DOI] [PMC free article] [PubMed] [Google Scholar]
- 52.Fliesler SJ, Bretillon L. The ins and outs of cholesterol in the vertebrate retina. J Lipid Res. 2010;51(12):3399–3413. doi: 10.1194/jlr.R010538. [DOI] [PMC free article] [PubMed] [Google Scholar]
- 53.Zheng W, et al. Spatial distribution of the pathways of cholesterol homeostasis in human retina. PLoS One. 2012;7(5):e37926. doi: 10.1371/journal.pone.0037926. [DOI] [PMC free article] [PubMed] [Google Scholar]
- 54.Pikuleva IA, Curcio CA. Cholesterol in the retina: the best is yet to come. Prog Retin Eye Res. 2014;41:64–89. doi: 10.1016/j.preteyeres.2014.03.002. [DOI] [PMC free article] [PubMed] [Google Scholar]
- 55.Pikuleva IA. Cholesterol-metabolizing cytochromes P450: implications for cholesterol lowering. Expert Opin Drug Metab Toxicol. 2008;4(11):1403–1414. doi: 10.1517/17425255.4.11.1403. [DOI] [PMC free article] [PubMed] [Google Scholar]
- 56.Omarova S, et al. Abnormal vascularization in mouse retina with dysregulated retinal cholesterol homeostasis. J Clin Invest. 2012;122(8):3012–3023. doi: 10.1172/JCI63816. [DOI] [PMC free article] [PubMed] [Google Scholar]
- 57.Meaney S, Bodin K, Diczfalusy U, Björkhem I. On the rate of translocation in vitro and kinetics in vivo of the major oxysterols in human circulation: critical importance of the position of the oxygen function. J Lipid Res. 2002;43(12):2130–2135. doi: 10.1194/jlr.M200293-JLR200. [DOI] [PubMed] [Google Scholar]
- 58.Zafar N, et al. Circulating angiogenic stem cells in type 2 diabetes are associated with glycemic control and endothelial dysfunction. PLoS One. 2018;13(10):e0205851. doi: 10.1371/journal.pone.0205851. [DOI] [PMC free article] [PubMed] [Google Scholar]
- 59.Petrelli A, et al. Improved function of circulating angiogenic cells is evident in type 1 diabetic islet-transplanted patients. Am J Transplant. 2010;10(12):2690–2700. doi: 10.1111/j.1600-6143.2010.03309.x. [DOI] [PubMed] [Google Scholar]
- 60.Tusi BK, et al. Population snapshots predict early haematopoietic and erythroid hierarchies. Nature. 2018;555(7694):54–60. doi: 10.1038/nature25741. [DOI] [PMC free article] [PubMed] [Google Scholar]
- 61.Dahlin JS, et al. A single-cell hematopoietic landscape resolves 8 lineage trajectories and defects in Kit mutant mice. Blood. 2018;131(21):e1–e11. doi: 10.1182/blood-2017-12-821413. [DOI] [PMC free article] [PubMed] [Google Scholar]
- 62.Okada S, Fukuda T, Inada K, Tokuhisa T. Prolonged expression of c-fos suppresses cell cycle entry of dormant hematopoietic stem cells. Blood. 1999;93(3):816–825. [PubMed] [Google Scholar]
- 63.Okada S, Wang ZQ, Grigoriadis AE, Wagner EF, von Rüden T. Mice lacking c-fos have normal hematopoietic stem cells but exhibit altered B-cell differentiation due to an impaired bone marrow environment. Mol Cell Biol. 1994;14(1):382–390. doi: 10.1128/MCB.14.1.382. [DOI] [PMC free article] [PubMed] [Google Scholar]
- 64.Spencer JA, et al. Direct measurement of local oxygen concentration in the bone marrow of live animals. Nature. 2014;508(7495):269–273. doi: 10.1038/nature13034. [DOI] [PMC free article] [PubMed] [Google Scholar]
- 65.Rabbani PS, et al. Dysregulation of Nrf2/Keap1 Redox Pathway in Diabetes Affects Multipotency of Stromal Cells. Diabetes. 2019;68(1):141–155. doi: 10.2337/db18-0232. [DOI] [PMC free article] [PubMed] [Google Scholar]
- 66.Basu P, et al. KLF2 is essential for primitive erythropoiesis and regulates the human and murine embryonic beta-like globin genes in vivo. Blood. 2005;106(7):2566–2571. doi: 10.1182/blood-2005-02-0674. [DOI] [PMC free article] [PubMed] [Google Scholar]
- 67.Matsumoto N, et al. Developmental regulation of yolk sac hematopoiesis by Kruppel-like factor 6. Blood. 2006;107(4):1357–1365. doi: 10.1182/blood-2005-05-1916. [DOI] [PMC free article] [PubMed] [Google Scholar]
- 68.Mayers S, Moço PD, Maqbool T, Silva PN, Kilkenny DM, Audet J. Establishment of an erythroid progenitor cell line capable of enucleation achieved with an inducible c-Myc vector. BMC Biotechnol. 2019;19(1):21. doi: 10.1186/s12896-019-0515-9. [DOI] [PMC free article] [PubMed] [Google Scholar]
- 69.Covey DF. ent-Steroids: novel tools for studies of signaling pathways. Steroids. 2009;74(7):577–585. doi: 10.1016/j.steroids.2008.11.019. [DOI] [PMC free article] [PubMed] [Google Scholar]
- 70.Patel M, et al. Liver X receptors preserve renal glomerular integrity under normoglycaemia and in diabetes in mice. Diabetologia. 2014;57(2):435–446. doi: 10.1007/s00125-013-3095-6. [DOI] [PubMed] [Google Scholar]
- 71.Axelrod D, Koppel DE, Schlessinger J, Elson E, Webb WW. Mobility measurement by analysis of fluorescence photobleaching recovery kinetics. Biophys J. 1976;16(9):1055–1069. doi: 10.1016/S0006-3495(76)85755-4. [DOI] [PMC free article] [PubMed] [Google Scholar]
- 72. Ishikawa-Ankerhold H, Ankerhold R, Drummen G. Fluorescence Recovery After Photobleaching (FRAP). In: Encyclopedia of Life Sciences. Hoboken, NJ;John Wiley & Sons, Ltd:2014. [Google Scholar]
- 73.Lydic TA, Busik JV, Reid GE. A monophasic extraction strategy for the simultaneous lipidome analysis of polar and nonpolar retina lipids. J Lipid Res. 2014;55(8):1797–1809. doi: 10.1194/jlr.D050302. [DOI] [PMC free article] [PubMed] [Google Scholar]
- 74.McDonald JG, Thompson BM, McCrum EC, Russell DW. Extraction and analysis of sterols in biological matrices by high performance liquid chromatography electrospray ionization mass spectrometry. Meth Enzymol. 2007;432:145–170. doi: 10.1016/S0076-6879(07)32006-5. [DOI] [PubMed] [Google Scholar]
- 75.Machacek M, et al. Elevated O-GlcNAcylation enhances pro-inflammatory Th17 function by altering the intracellular lipid microenvironment. J Biol Chem. 2019;294(22):8973–8990. doi: 10.1074/jbc.RA119.008373. [DOI] [PMC free article] [PubMed] [Google Scholar]
- 76.Bhatwadekar A, et al. A new advanced glycation inhibitor, LR-90, prevents experimental diabetic retinopathy in rats. Br J Ophthalmol. 2008;92(4):545–547. doi: 10.1136/bjo.2007.127910. [DOI] [PubMed] [Google Scholar]
- 77.Duan Y, et al. Loss of Angiotensin-Converting Enzyme 2 Exacerbates Diabetic Retinopathy by Promoting Bone Marrow Dysfunction. Stem Cells. 2018;36(9):1430–1440. doi: 10.1002/stem.2848. [DOI] [PMC free article] [PubMed] [Google Scholar]
- 78.Luecken MD, Theis FJ. Current best practices in single-cell RNA-seq analysis: a tutorial. Mol Syst Biol. 2019;15(6):e8746. doi: 10.15252/msb.20188746. [DOI] [PMC free article] [PubMed] [Google Scholar]
- 79.Lun AT, Bach K, Marioni JC. Pooling across cells to normalize single-cell RNA sequencing data with many zero counts. Genome Biol. 2016;17:75. doi: 10.1186/s13059-016-0947-7. [DOI] [PMC free article] [PubMed] [Google Scholar]
- 80.Tirosh I, et al. Dissecting the multicellular ecosystem of metastatic melanoma by single-cell RNA-seq. Science. 2016;352(6282):189–196. doi: 10.1126/science.aad0501. [DOI] [PMC free article] [PubMed] [Google Scholar]
- 81.Johnson WE, Li C, Rabinovic A. Adjusting batch effects in microarray expression data using empirical Bayes methods. Biostatistics. 2007;8(1):118–127. doi: 10.1093/biostatistics/kxj037. [DOI] [PubMed] [Google Scholar]
- 82.Han X, et al. Mapping the Mouse Cell Atlas by Microwell-Seq. Cell. 2018;172(5):1091–1107.e17. doi: 10.1016/j.cell.2018.02.001. [DOI] [PubMed] [Google Scholar]
- 83.Finak G, et al. MAST: a flexible statistical framework for assessing transcriptional changes and characterizing heterogeneity in single-cell RNA sequencing data. Genome Biol. 2015;16:278. doi: 10.1186/s13059-015-0844-5. [DOI] [PMC free article] [PubMed] [Google Scholar]
- 84.Aibar S, et al. SCENIC: single-cell regulatory network inference and clustering. Nat Methods. 2017;14(11):1083–1086. doi: 10.1038/nmeth.4463. [DOI] [PMC free article] [PubMed] [Google Scholar]
Associated Data
This section collects any data citations, data availability statements, or supplementary materials included in this article.