Abstract
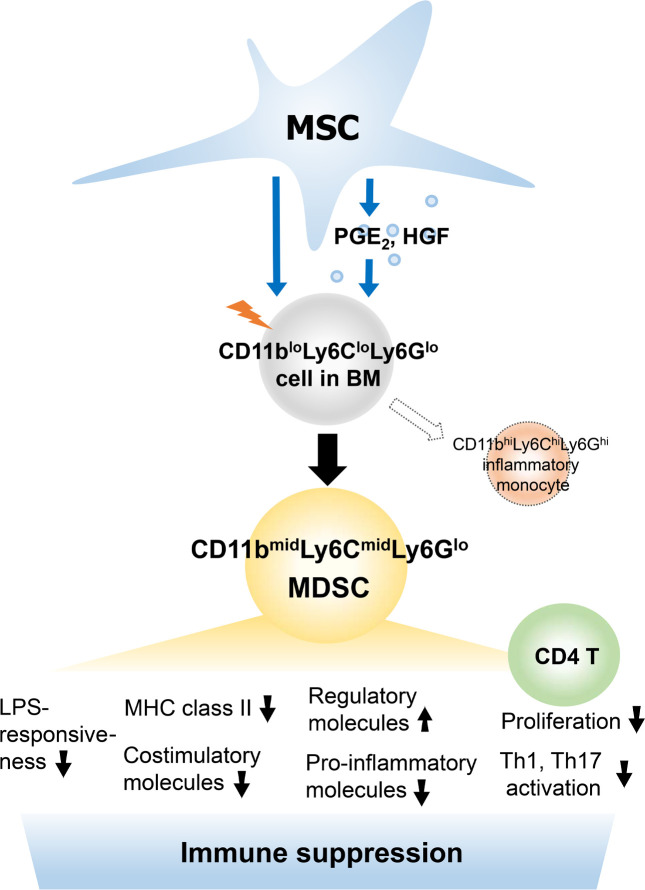
Mesenchymal stem/stromal cells (MSCs) regulate immunity through myeloid-derived suppressor cells (MDSCs), which are a heterogeneous population of immature myeloid cells with phenotypic and functional diversity. Herein, we identified a distinct subset of MDSCs induced by MSCs in the BM under inflammatory conditions. MSCs directed the differentiation of Ly6Glo BM cells from CD11bhiLy6Chi cells to CD11bmidLy6Cmid cells both in cell contact–independent and –dependent manners upon GM-CSF stimulation in vitro and in mice with experimental autoimmune uveoretinitis (EAU). RNA-Seq indicated that MSC-induced CD11bmidLy6CmidLy6Glo cells had a distinct transcriptome profile from CD11bhiLy6ChiLy6Glo cells. Phenotypic, molecular, and functional analyses showed that CD11bmidLy6CmidLy6Glo cells differed from CD11bhiLy6ChiLy6Glo cells by low expression of MHC class II and costimulatory molecules and proinflammatory cytokines, high production of immunoregulatory molecules, lack of change in response to LPS, and inhibition of T cell proliferation and activation. Consequently, adoptive transfer of MSC-induced CD11bmidLy6CmidLy6Glo cells significantly attenuated the development of EAU in mice. Further mechanistic study revealed that suppression of prostaglandin E2 (PGE2) and HGF secretion in MSCs by siRNA transfection partially reversed the effects of MSCs on MDSC differentiation. Altogether, data demonstrate that MSCs drive the differentiation of BM cells toward CD11bmidLy6CmidLy6Glo MDSCs, in part through HGF and COX-2/PGE2, leading to resolution of ocular autoimmune inflammation.
Keywords: Autoimmunity, Immunology
Keywords: Adult stem cells, Autoimmune diseases, Stem cell transplantation
The cross-talk between mesenchymal stromal and myeloid cells can be therapeutically exploited for the development of therapy to regulate immune response and promote inflammation resolution.
Introduction
Mesenchymal stem/stromal cells (MSCs) maintain tissue homeostasis in sickness through the regulation of immunity. In addition to their direct effects on immune effector cells, MSCs modulate the immune system through induction of regulatory immune cells. In particular, myeloid-derived suppressor cells (MDSCs) have recently emerged as one of immunoregulatory cells mediating the homeostatic action of MSCs (1).
MDSCs are a heterogeneous population of myeloid cells with potent immunosuppressive activity that are generated from myeloid precursors under a variety of pathologic conditions (2). Although MDSCs were first described in cancer, ample evidence indicates that MDSCs are one of the major negative regulators of immune responses in many immune-mediated disorders involving autoimmune diseases, graft-versus-host disease, and allotransplant rejection (2). For example, it has been shown that the activity of MDSCs was impaired in mice and humans with systemic lupus erythematosus, inflammatory bowel disease, collagen-induced arthritis, and type 1 diabetes mellitus (3–6). In addition, adoptive transfer of MDSCs has been reported to inhibit the progression of autoimmune arthritis and uveoretinitis (5, 7, 8), delay the onset of diabetes (9, 10), and prolong the survival of corneal and skin allotransplants (11, 12). These findings support the notion that MDSCs play a role in maintaining immune homeostasis.
In recent years, several studies have investigated the effects of MSCs on MDSCs and demonstrated that MSCs skewed the differentiation of human monocyte-derived dendritic cells toward a MDSC-like phenotype (13), elicited the expansion of MDSCs from human peripheral blood leukocytes in vitro (14), and mobilized MDSCs to inflammatory sites in mice with experimental autoimmune uveoretinitis (EAU) (15, 16). In these studies, MSC-induced myeloid cells were loosely defined as MDSCs based on the minimal phenotypic and functional characteristics recommended for MDSC nomenclature (17): expression of both CD11b and Gr-1 (Ly6C or Ly6G) markers and activity to inhibit T cells. Given a wide range of phenotypic, molecular, and functional heterogeneity of MDSCs, however, it is important to phenotypically and functionally delineate the MDSC subset according to the type of inducing stimuli and in the context of disease.
Herein, we demonstrate that BM-derived MSCs direct the differentiation of BM cells from CD11bhiLy6ChiLy6Glo cells to CD11bmidLy6CmidLy6Glo cells both in cell contact–independent and –dependent manners upon inflammatory stimulation in vitro and in mice with EAU. The MSC-induced CD11bmidLy6CmidLy6Glo cells were immunosuppressive and distinct from proinflammatory CD11bhiLy6ChiLy6Glo monocytes, as evaluated by whole transcriptome analysis using RNA-Seq, surface marker expression, arginase and inducible nitric oxide synthase (iNOS) expression, production of proinflammatory and antiinflammatory cytokines, response to LPS, and T cell–suppressive activity. Consequently, adoptive transfer of the MSC-induced CD11bmidLy6CmidLy6Glo cells significantly attenuated the development of EAU in mice. Further assays of MSCs with RNA-Seq revealed that HGF and COX-2/prostaglandin E2 (PGE2) were partly responsible for the effects of MSCs on MDSC differentiation.
Results
MSCs direct myeloid cell differentiation from proinflammatory to antiinflammatory phenotype and from CD11bhiLy6ChiLy6Glo to CD11bmidLy6CmidLy6Glo cells.
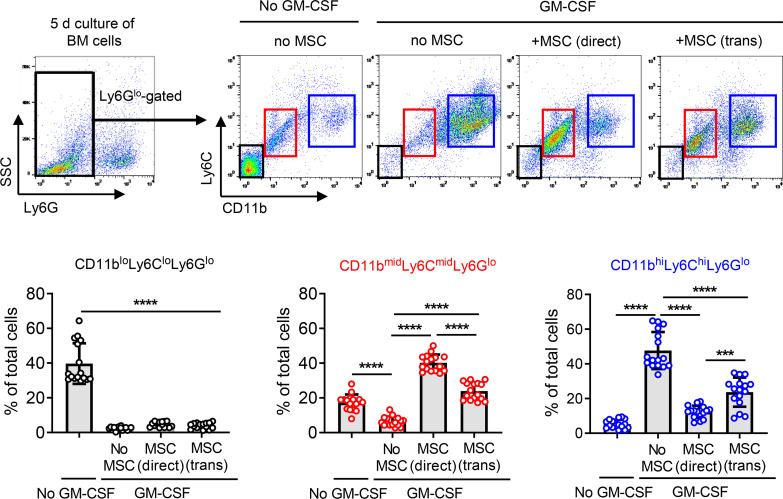
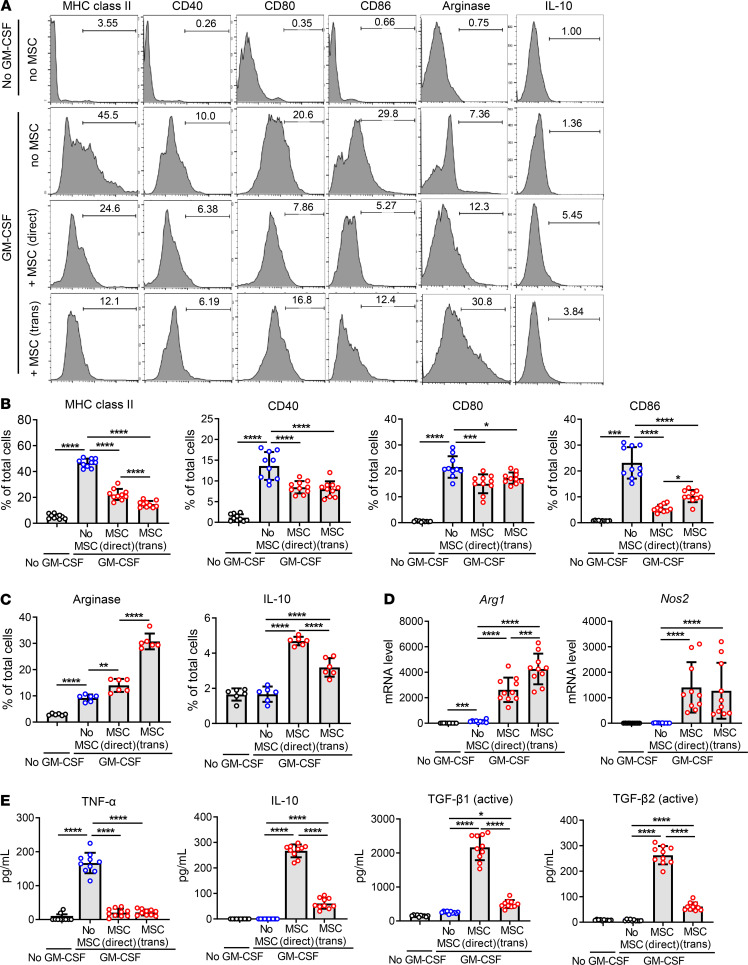
In order to investigate the effects of MSCs on myeloid cell differentiation under inflammatory condition, we isolated BM cells from C57BL/6 mice and cultured them with human BM-derived MSCs in either direct or Transwell coculture system (BM cell/MSC = 5:1) in the presence of GM-CSF (40 ng/mL) for 5 days. GM-CSF was used to trigger emergency myelopoiesis upon exposure to inflammatory stimuli (18). After 5 days, BM cells were gated on Ly6G, and the Ly6Glo cell population was evaluated for expression of CD11b and Ly6C by flow cytometry (Figure 1). The majority of Ly6Glo cells were differentiated into CD11bhiLy6ChiLy6Glo cells upon GM-CSF stimulation, while most of Ly6Glo cells that were not stimulated with GM-CSF were CD11bloLy6CloLy6Glo cells (Figure 1). Evidently, both direct and Transwell cocultures with MSCs induced a distinct subset of CD11bmidLy6CmidLy6Glo cells in BM cells (Figure 1). An additional flow cytometric analysis showed that BM cells differentiated to the phenotype highly expressing MHC class II and costimulatory molecules (CD40, CD80, and CD86) after GM-CSF treatment and that MSC coculture both in direct and Transwell systems significantly reduced the expression of MHC class II and costimulatory surface markers on BM cells (Figure 2, A and B), while increasing the intracellular expression of arginase and IL-10 (Figure 2, A, C, and D). Moreover, the secretion of TNF-α was elevated in GM-CSF–stimulated BM cells, as measured by ELISA, and MSC coculture markedly suppressed TNF-α production in BM cells (Figure 2E). By contrast, the secretion of immunoregulatory cytokines IL-10, active TGF-β1, and active TGF-β2 was significantly enhanced in BM cells by MSCs (Figure 2E). Furthermore, real-time reverse transcription–PCR (RT-PCR) revealed that transcript levels of Arg1 encoding arginase and Nos2 encoding iNOS, both of which are prominent enzymes expressed in MDSCs (2, 17), were dramatically increased in BM cells after MSC coculture both in direct and Transwell coculture systems (Figure 2D).
Figure 1. MSCs direct differentiation of BM cells into CD11bmidLy6CmidLy6Glo cells under inflammatory stimulation.
BM cells extracted from C57BL/6 mice were cocultured with MSCs in direct coculture or Transwell system under GM-CSF stimulation (40 ng/mL) for 5 days and assayed. After gating BM cells on Ly6G, Ly6Glo cells were assessed for CD11b and Ly6C expression by flow cytometry. Representative cytograms and the percentages of CD11bloLy6CloLy6Glo cells, CD11bmidLy6CmidLy6Glo cells, and CD11bhiLy6ChiLy6Glo cells of total BM cells are presented. Data (mean ± SD) are from 4 independent sets of experiments (n = 4 in each group per set). A dot depicts data from 1 biological sample. ***P < 0.001, ****P < 0.0001 by 1-way ANOVA and Tukey’s multiple-comparison test.
Figure 2. MSCs drive differentiation of BM cells into antiinflammatory phenotypes under inflammatory stimulation.
(A–C) BM cells cocultured with MSCs in direct coculture or Transwell system were stimulated by GM-CSF (40 ng/mL) for 5 days and assayed. Representative flow cytometry histograms (A) and quantitative results for the surface expression of MHC class II, CD40, CD80, and CD86 in BM cells (B) and for the intracellular expression of arginase and IL-10 (C). (D) Real-time RT-PCR assay for Arg1 encoding arginase and Nos2 encoding inducible nitric oxide synthase. Shown are data scaled to BM cells not treated with GM-CSF or cocultured with MSCs. (E) ELISA for TNF-α, IL-10, active TGF-β1, and active TGF-β2 in the cell-free coculture supernatant. Data (mean ± SD) are from 3 independent sets of experiments (n = 2–4 in each group per set. Each biological sample was assayed in 3 technical replicates for RT-PCR and ELISA). A dot depicts data from 1 biological sample. *P < 0.05, **P < 0.01, ***P < 0.001, ****P < 0.0001 by 1-way ANOVA and Tukey’s multiple-comparison test.
MSC-induced myeloid cells are not responsive to LPS.
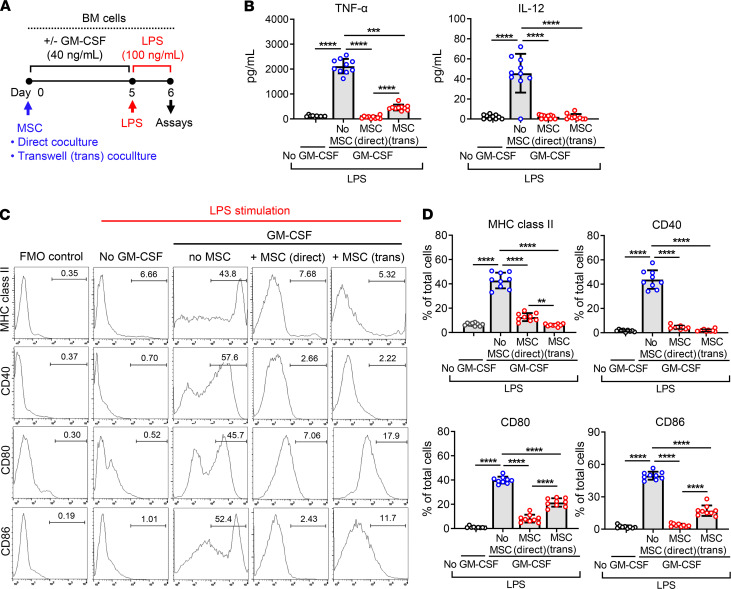
We next evaluated whether MSCs might affect the inflammatory activity of differentiating BM cells. After 5-day culture of BM cells in the presence of GM-CSF with or without MSCs, BM cells were challenged with LPS (100 ng/mL) for 18 hours and examined for the production of inflammatory cytokines and the expression of surface markers (Figure 3A). Following LPS stimulation, the secretion of TNF-α and IL-12 was highly enhanced in GM-CSF–differentiated BM cells without MSC coculture but not increased in cells not treated with GM-CSF or in GM-CSF-treated cells with MSC coculture (Figure 3B). Similar observations were made with the levels of surface markers on BM cells. LPS markedly induced the expression of MHC class II, CD40, CD80, and CD86 in GM-CSF–stimulated BM cells, but the expression of these markers was significantly lower in GM-CSF–stimulated, MSC-cocultured cells and in cells not treated with GM-CSF, compared with GM-CSF–stimulated cells (Figure 3, C and D). However, CD206 expression, a well-known M2 macrophage marker, was not increased in BM cells by MSC coculture (Supplemental Figure 1; supplemental material available online with this article; https://doi.org/10.1172/jci.insight.136059DS1), suggesting that the MSC-induced BM cells are different from alternatively activated M2 macrophages. Both direct and Transwell cocultures with MSCs were effective at repressing the proinflammatory activation of BM cells in response to LPS (Figure 3).
Figure 3. LPS responsiveness of MSC-differentiated BM cells.
(A) Experimental scheme of LPS stimulation assay. After 5-day coculture with MSCs in direct or Transwell coculture system under GM-CSF incubation (40 ng/mL), BM cells were challenged with LPS (100 ng/mL) for 18 hours and assayed by ELISA and flow cytometry. (B) ELISA for secreted levels of TNF-α and IL-12 in the cell-free culture supernatant. (C and D) Representative flow cytometry histograms and quantitative results for MHC class II, CD40, CD80, and CD86 expression in BM cells. The fluorescence minus one control (FMO control) was used for each marker. Data (mean ± SD) are from 3 independent sets of experiments (n = 3–4 in each group per set. Each biological sample was assayed in 3 technical replicates for ELISA). A dot depicts data from 1 biological sample. **P < 0.01, ***P < 0.001, ****P < 0.0001 by 1-way ANOVA and Tukey’s multiple-comparison test.
MSCs increase CD11bmidLy6CmidLy6Glo cells and decrease CD11bhiLy6ChiLy6Glo cells in BM of EAU mice.
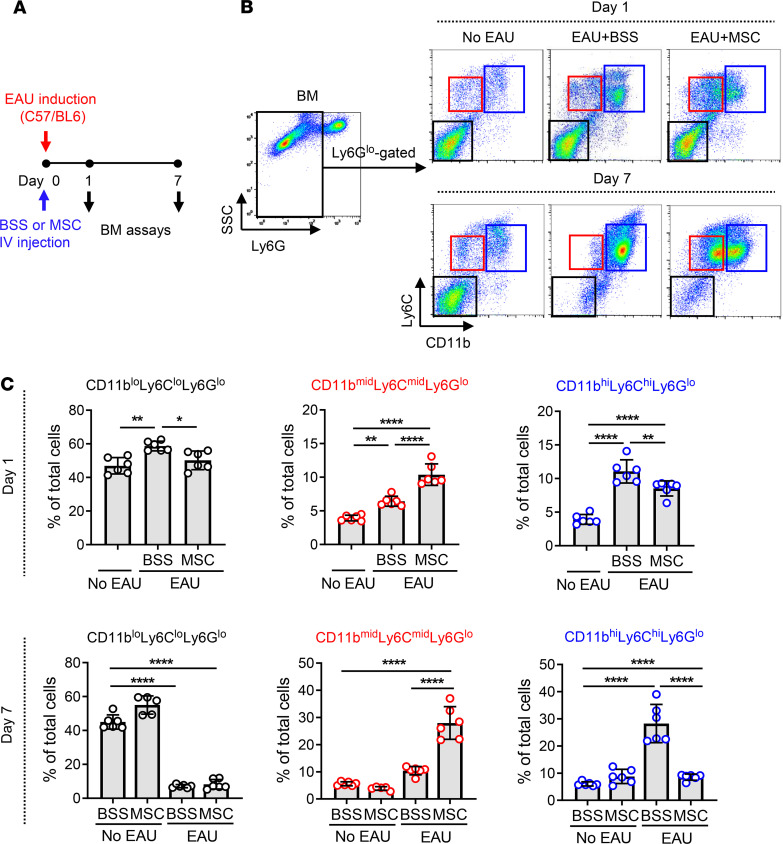
To verify the effects of MSCs on myeloid cell differentiation in vivo, we used a mouse model of EAU wherein we previously observed the immunomodulatory effects of MSCs (15). Immediately after EAU induction, either MSCs (human BM-derived) or vehicle (Hanks balanced salt solution [BSS]) were injected into C57/BL6 mice via tail vein, and at days 1 and 7, BM cells were collected and assayed for Ly6G, Ly6C, and CD11b by flow cytometry (Figure 4A). In the steady state, the majority of Ly6Glo cells in BM were CD11bloLy6CloLy6Glo cells. With time after EAU induction, CD11bloLy6CloLy6Glo cells disappeared and CD11bhiLy6ChiLy6Glo cells predominantly appeared, an indication that inflammatory stimuli drove the differentiation of CD11bloLy6CloLy6Glo cells to CD11bhiLy6ChiLy6Glo cells in the BM (Figure 4, B and C). Remarkably, i.v. administration of MSCs induced the subset of CD11bmidLy6CmidLy6Glo cells and reduced CD11bhiLy6ChiLy6Glo cells in the BM of EAU mice (Figure 4, B and C). i.v. MSCs did not affect BM cells in naive mice without EAU (Figure 4C).
Figure 4. MSCs induce CD11bmidLy6CmidLy6Glo cells in BM of EAU mice.
(A) Right after EAU immunization, either MSCs or vehicle (Hanks balanced salt solution [BSS]) were injected into the tail veins of mice (day 0). At days 1 and 7, the cells were extracted from the BM and evaluated by flow cytometry. (B and C) Representative and quantitative flow cytometry results for CD11bloLy6CloLy6Glo, CD11bmidLy6CmidLy6Glo, and CD11bhiLy6ChiLy6Glo cells in the BM. A dot indicates data from 1 individual animal (mean ± SD). *P < 0.05, **P < 0.01, ****P < 0.0001 by 1-way ANOVA and Tukey’s multiple-comparison test.
Together, the results demonstrate that CD11bloLy6CloLy6Glo cells in the steady-state BM undergo differentiation to CD11bhiLy6ChiLy6Glo cells under inflammatory condition and MSCs drive the differentiation of BM cells toward CD11bmidLy6CmidLy6Glo cells.
MSC-induced CD11bmidLy6CmidLy6Glo cells are antiinflammatory and distinct from the proinflammatory CD11bhiLy6ChiLy6Glo cells.
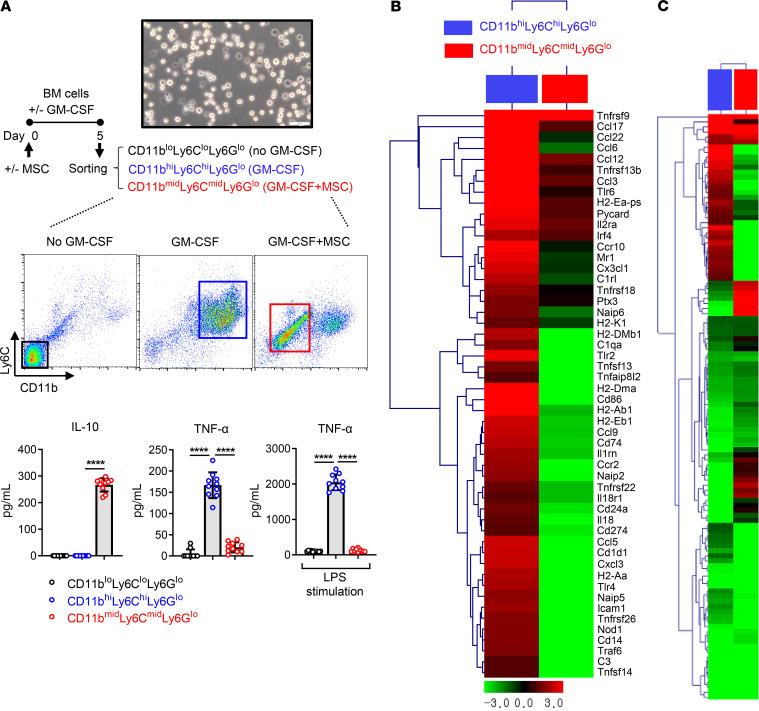
Next, we examined the inflammatory activation status in each cell population: CD11bloLy6CloLy6Glo, CD11bhiLy6ChiLy6Glo, and CD11bmidLy6CmidLy6Glo myeloid cells. After BM cells were cultured with or without MSCs and in the presence or absence of GM-CSF for 5 days, CD11bloLy6CloLy6Glo cells, CD11bhiLy6ChiLy6Glo cells, and CD11bmidLy6CmidLy6Glo cells were sorted, respectively (Figure 5A). The sorted cells were evaluated for the levels of inflammation-related cytokines. ELISA showed that the antiinflammatory cytokine IL-10 was highly produced from CD11bmidLy6CmidLy6Glo cells but not from CD11bhiLy6ChiLy6Glo cells or CD11bloLy6CloLy6Glo cells (Figure 5A). Conversely, the proinflammatory cytokine TNF-α was increased in CD11bhiLy6ChiLy6Glo cells but not in CD11bmidLy6CmidLy6Glo cells or CD11bloLy6CloLy6Glo cells (Figure 5A). The difference was more dramatic after LPS stimulation. TNF-α secretion was enhanced in CD11bhiLy6ChiLy6Glo cells by 19-fold after LPS treatment compared with before LPS treatment, whereas LPS did not stimulate TNF-α production in CD11bmidLy6CmidLy6Glo cells or CD11bloLy6CloLy6Glo cells (Figure 5A).
Figure 5. Inflammatory activation status of MSC-induced CD11bmidLy6CmidLy6Glo cells in comparison with CD11bhiLy6ChiLy6Glo cells or CD11bloLy6CloLy6Glo cells.
(A) CD11bloLy6CloLy6Glo cells were sorted from BM cells that had been cultured for 5 days without MSCs in the absence of GM-CSF. CD11bhiLy6ChiLy6Glo cells were isolated from BM cells cultured for 5 days under GM-CSF incubation (40 ng/mL) but without MSC coculture. CD11bmidLy6CmidLy6Glo cells were sorted from GM-CSF–stimulated, MSC-cocultured BM cells. The secreted levels of IL-10 and TNF-α were measured in the cell-free supernatant of each cell culture before and after LPS stimulation (100 ng/mL) for 18 hours. Scale bar: 50 μm. Data (mean ± SD) are from 3 independent sets of experiments (n = 3–4 in each group per set. Each biological sample was assayed in 3 technical replicates). A dot depicts data from 1 biological sample. ****P < 0.0001 by 1-way ANOVA and Tukey’s multiple-comparison test. (B and C) Heatmaps of RNA-Seq on CD11bhiLy6ChiLy6Glo cells, CD11bmidLy6CmidLy6Glo cells, and CD11bloLy6CloLy6Glo cells. The first column (blue box) depicts changes in the gene expression levels in CD11bhiLy6ChiLy6Glo cells relative to CD11bloLy6CloLy6Glo cells. The second column (red box) depicts the gene expression changes in CD11bmidLy6CmidLy6Glo cells relative to CD11bloLy6CloLy6Glo cells. The genes related to inflammation and immune response are shown in B, and the genes related to cell differentiation and immune response are shown in C. The whole data are deposited in ArrayExpress (accession E-MTAB-8975).
Furthermore, we analyzed and compared the transcriptomes of the 3 cell populations by RNA-Seq (ArrayExpress accession E-MTAB-8975). Results demonstrated that the genes related to inflammation and immune response were upregulated in CD11bhiLy6ChiLy6Glo cells and downregulated in CD11bmidLy6CmidLy6Glo cells (Figure 5B). Further analysis for cell differentiation– and immune response–related genes (Figure 5C) and cell differentiation–related genes (Supplemental Figure 2) revealed that CD11bhiLy6ChiLy6Glo cells and CD11bmidLy6CmidLy6Glo cells displayed distinct gene expression patterns.
Collectively, the data suggest that MSCs induce a subset of the antiinflammatory CD11bmidLy6CmidLy6Glo cells in the BM during inflammation that is different from CD11bloLy6CloLy6Glo cells in the steady-state BM and the proinflammatory CD11bhiLy6ChiLy6Glo monocytes differentiated by inflammatory stimuli.
MSC-induced CD11bmidLy6CmidLy6Glo cells inhibit T cell proliferation and Th1 cell differentiation.
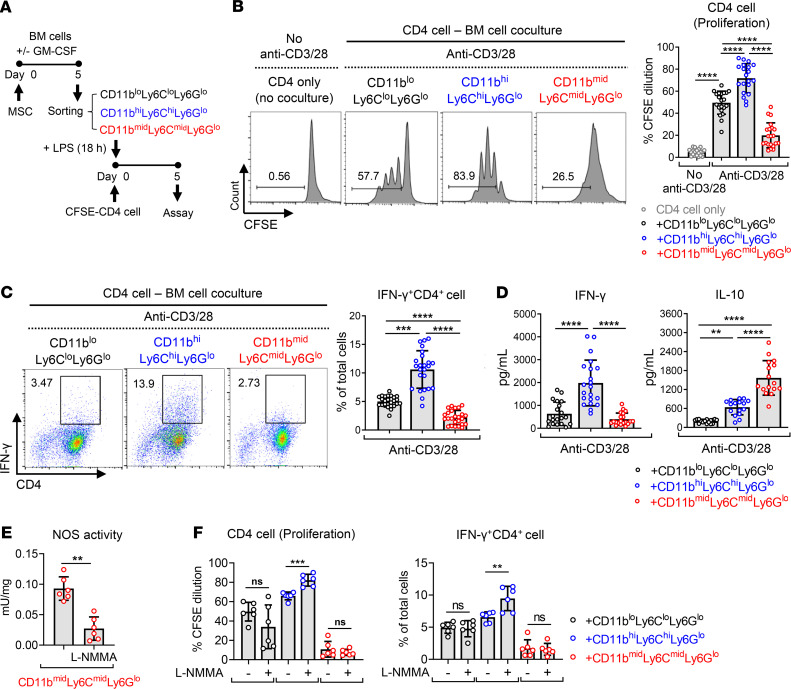
The above findings led us to hypothesize that CD11bmidLy6CmidLy6Glo cells induced by MSCs during inflammatory myelopoiesis are MDSCs. Inhibition of T cells is the functional characteristic used to identify MDSCs (17), and therefore, we went on to investigate the effects of MSC-induced CD11bmidLy6CmidLy6Glo cells on CD4 T cell proliferation and activation. CD11bloLy6CloLy6Glo cells, CD11bhiLy6ChiLy6Glo cells, and CD11bmidLy6CmidLy6Glo cells were sorted from BM cells as aforementioned (Figure 5A) and stimulated with LPS for 18 hours. Then, each cell population was cocultured in direct system for 5 days with CFSE-labeled CD4 T cells that were activated by anti-CD3/CD28 antibodies (Figure 6A). Flow cytometric analysis for CFSE dilution demonstrated that CD4+ cell proliferation was substantially enhanced by CD11bhiLy6ChiLy6Glo cells but markedly inhibited by CD11bmidLy6CmidLy6Glo cells (Figure 6B). Similarly, CD11bmidLy6CmidLy6Glo cells significantly decreased the frequency of IFN-γ+CD4+ cells and the amount of IFN-γ production in anti-CD3/CD28-activated CD4+ cells, while CD11bhiLy6ChiLy6Glo cells promoted IFN-γ+CD4+ cell differentiation and IFN-γ production in CD4+ cells (Figure 6, C and D). Meanwhile, the frequency of CD4+Foxp3+ cells and IL-10 secretion was increased in CD4+ cells cocultured with CD11bhiLy6ChiLy6Glo cells, compared with CD4+ cells cocultured with CD11bloLy6CloLy6Glo cells (Supplemental Figure 3 and Figure 6D). The level of secreted IL-10 was much higher in cocultures of CD4+ cells and CD11bmidLy6CmidLy6Glo cells than in cocultures of CD4+ cells and CD11bhiLy6ChiLy6Glo cells (Figure 6D), whereas the frequency of CD4+Foxp3+ cells was lowered in CD4+ cells by coculture with CD11bmidLy6CmidLy6Glo cells (Supplemental Figure 3). These findings suggest that the elevated secretion of IL-10 in cocultures of CD4+ cells and CD11bmidLy6CmidLy6Glo cells was not due to an increase in Foxp3 Tregs.
Figure 6. MSC-induced CD11bmidLy6CmidLy6Glo cells inhibit T cell proliferation and Th1 differentiation in a nitric oxide–independent manner.
(A) Experimental scheme. CD11bloLy6CloLy6Glo cells, CD11bmidLy6CmidLy6Glo cells, and CD11bhiLy6ChiLy6Glo cells were sorted as in Figure 5A and stimulated with LPS (100 ng/mL) for 18 hours. CD4+ cells were sorted from the spleens of C57BL/6 mice. The sorted CD11bloLy6CloLy6Glo cells, CD11bmidLy6CmidLy6Glo cells, or CD11bhiLy6ChiLy6Glo cells were cocultured in a direct coculture system with CFSE-prelabeled CD4+ cells on anti-CD3– and anti-CD28 antibody–coated plates for 5 days. (B and C) CFSE dilution assay for CD4+ cell proliferation (B) and flow cytometric analysis for IFN-γ+CD4+ cells (C). (D) ELISA for IFN-γ and IL-10 production in the cell-free supernatant of BM cell–CD4+ cell coculture. (E and F) N:(G)-monomethyl-L-arginine (L-NMMA, 5 mM) was added to BM cell–CD4+ cell coculture for the inhibition of nitric oxide synthase (NOS) activity (E), and CD4 cell proliferation and IFN-γ+CD4+ cell differentiation were examined by CFSE assay and flow cytometry (F). Data (mean ± SD) represent 3–8 independent sets of experiments (n = 2–4 in each group per set. Each biological sample was assayed in 3 technical replicates for ELISA). A dot depicts data from 1 biological sample. **P < 0.01, ***P < 0.001, ****P < 0.0001, ns, not significant. One-way ANOVA and Tukey’s multiple-comparison test were used in B, C, D, and F and Mann-Whitney test was used in E.
Nitric oxide derived from iNOS is one of the immunosuppressive mechanisms that monocytic MDSCs use (2, 17). In addition, it has been reported that myeloid cell–derived iNOS suppresses M1 macrophage polarization (19). As we observed an approximately 1500-fold increase in iNOS transcript in BM cells after MSC coculture (Figure 2D), we next tested whether an increased iNOS activity in CD11bmidLy6CmidLy6Glo cells might mediate the inhibitory effects on CD4 T cell proliferation and Th1 cell differentiation. However, the nonspecific inhibition of nitric oxide synthase (NOS) with N:(G)-monomethyl-L-arginine (L-NMMA, used at 5 mM) (20) did not abrogate the activity of CD11bmidLy6CmidLy6Glo cells to suppress CD4+ cell proliferation and IFN-γ+CD4+ cell differentiation, although the addition of L-NMMA significantly augmented the capacity of CD11bhiLy6ChiLy6Glo cells to stimulate CD4+ cell proliferation and Th1 cell differentiation (Figure 6, E and F). These findings suggest that the conventional MDSCs with an iNOS-mediated suppressive activity are present among the CD11bhiLy6ChiLy6Glo monocyte population but CD11bmidLy6CmidLy6Glo cells induced by MSCs are different from these conventional monocytic MDSCs.
MSC-induced CD11bmidLy6CmidLy6Glo cells suppress immune response in EAU mice.
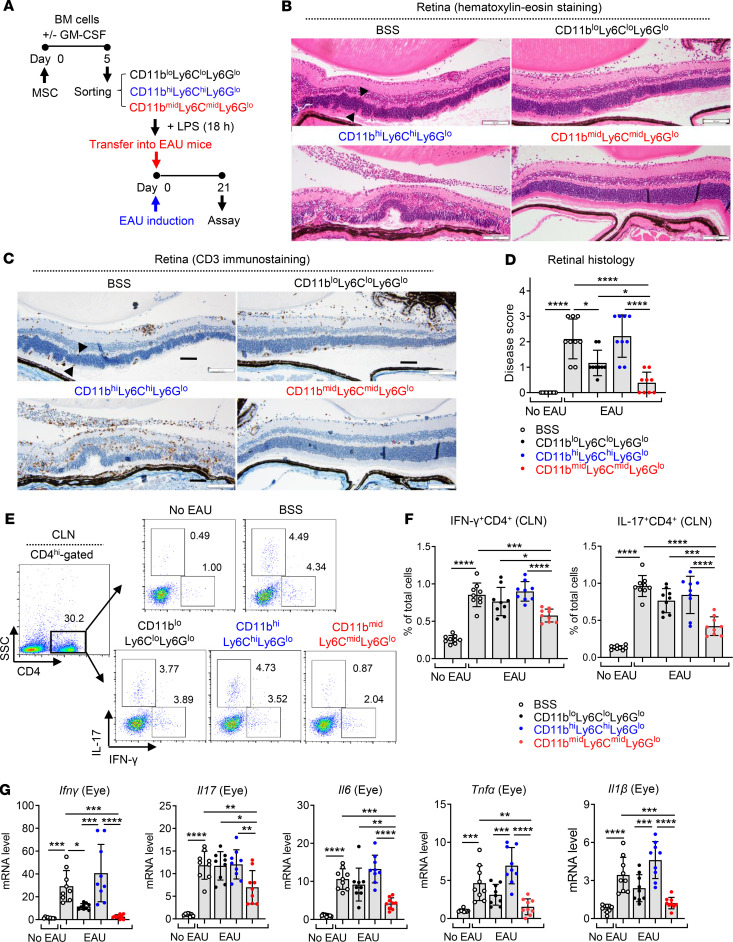
To further confirm the immunosuppressive activity of MSC-induced CD11bmidLy6CmidLy6Glo cells in vivo, we induced EAU in mice and injected one of the following into the mice i.v.: BSS (vehicle control) or CD11bloLy6CloLy6Glo cells, CD11bhiLy6ChiLy6Glo cells, and CD11bmidLy6CmidLy6Glo cells that were sorted from BM cells and stimulated with LPS (Figure 7A). Adoptive transfer of CD11bmidLy6CmidLy6Glo cells protected the mice against the EAU-induced retinal destruction and suppressed CD3 T cell infiltration into the retina, while CD11bhiLy6ChiLy6Glo cells did not (Figure 7, B–D). In addition, the frequencies of IFN-γ+CD4+ cells and IL-17+CD4+ cells were significantly lower in draining cervical lymph nodes (CLNs) in mice treated with CD11bmidLy6CmidLy6Glo cells, compared with mice treated with BSS or CD11bhiLy6ChiLy6Glo cells (Figure 7, E and F). Similar findings were observed with mRNA levels of the proinflammatory cytokines Ifnγ, Il17, Il6, Tnfα, and Il1β in the eye (Figure 7G). No difference, however, was found in the frequency of CD4+Foxp3+ cells in CLNs (Supplemental Figure 4).
Figure 7. MSC-induced CD11bmidLy6CmidLy6Glo cells protect against EAU development in mice.
(A) The CD11bloLy6CloLy6Glo, CD11bmidLy6CmidLy6Glo, and CD11bhiLy6ChiLy6Glo cells were sorted as in Figure 5A and stimulated with LPS for 18 hours. Each cell population or the vehicle (Hanks balanced salt solution [BSS]) was injected i.v. into mice immediately after EAU induction (day 0). Twenty-one days later (day 21), the mice were sacrificed and assayed. (B–D) Representative microphotographs of H&E staining, CD3 immunostaining of the retinal cross-sections, and disease score assigned by histological findings. The retinal structure, especially outer nuclear layer, including photoreceptor nuclei (arrowheads), was disorganized and infiltrated with inflammatory cells and CD3+ cells in the CD11bhiLy6ChiLy6Glo cell–treated EAU mice. In contrast, the retinal structure was preserved and few inflammatory cells were observed in mice treated with CD11bmidLy6CmidLy6Glo cells. Scale bar: 100 μm. (E and F) Representative flow cytometry cytograms and quantitative results for IFN-γ+CD4+ cells and IL-17+CD4+ cells in draining cervical lymph nodes (CLN). The numbers presented in cytograms (E) represent the percentage of IFN-γ+ or IL-17+ population of CD4+ cells, and the data shown in quantitative graphs (F) are the percentage of IFN-γ+CD4+ cells or IL-17+CD4+ cells of total CLN cells. (G) Real-time RT-PCR analysis for the proinflammatory cytokines in the eye. Shown are the values of mRNA levels relative to those in normal eyes without EAU. A dot indicates data from 1 individual animal (mean ± SD). Each biological sample was assayed in 3 technical replicates for RT-PCR. *P < 0.05, **P < 0.01, ***P < 0.001, ****P < 0.0001 by 1-way ANOVA and Tukey’s multiple-comparison test.
Taken together, both in vitro and in vivo functional assays revealed that the MSC-induced CD11bmidLy6CmidLy6Glo cells repressed T cell–mediated immune responses.
HGF and COX-2/PGE2 partly mediate the effects of MSCs on BM cell differentiation.
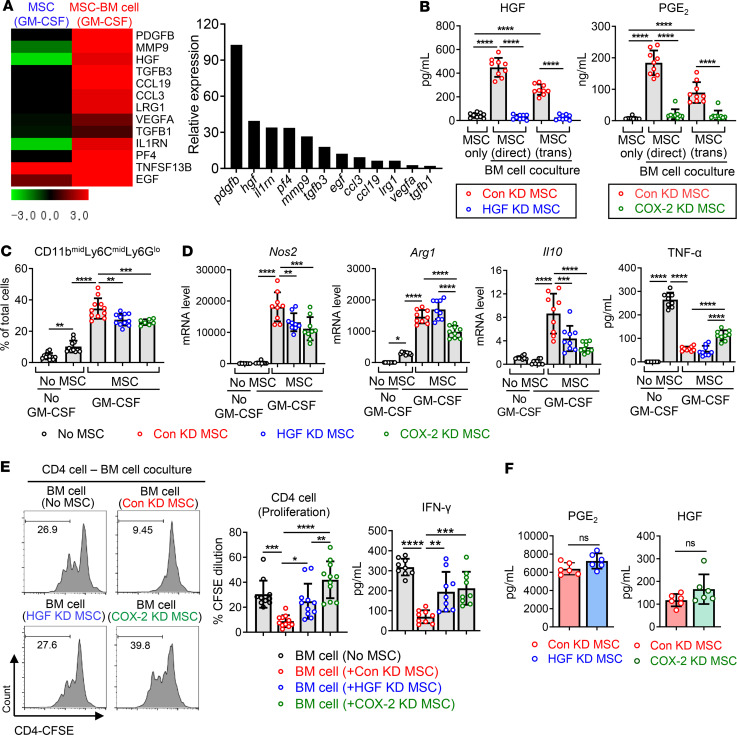
We next investigated the mechanisms by which MSCs induce the differentiation of immunosuppressive CD11bmidLy6CmidLy6Glo cells during BM cell differentiation under inflammatory conditions. Since the effects of MSCs on BM cell differentiation were not blocked by Transwell separation between MSCs and BM cells (Figures 1–3), we made an assumption that paracrine factors might be involved in MSC action. Hence, we performed RNA-Seq on MSCs in order to identify secreted protein-encoding genes that were upregulated in MSCs upon coculture with differentiating BM cells (ArrayExpress accession E-MTAB-8976). As a result, a total of 13 genes encoding secreted proteins were found to be increased by more than 2-fold in MSCs cocultured with BM cells compared with MSCs cultured alone (Figure 8A). Among them, Hgf, the second most highly upregulated gene, has been previously shown to affect monocyte differentiation (14, 21, 22). In addition, it has been reported that PGE2-COX-2–positive feedback in monocytic precursors is implicated in the conversion to MDSCs (23–25). Moreover, PGE2 is a well-known mediator of MSCs in immunomodulation (26–28). Based on this information, we selected HGF and PGE2 for further investigation. Indeed, the secretion of HGF and PGE2 proteins was markedly elevated in MSCs upon BM cell coculture (Figure 8B). To ascertain the role of HGF and PGE2 in the MSC effects, we repressed the secretion of HGF and PGE2 in MSCs by HGF and COX-2 siRNA transfection, respectively, and cocultured with BM cells under GM-CSF stimulation (Figure 8B). MSCs with HGF or COX-2 knockdown were less effective at the induction of CD11bmidLy6CmidLy6Glo cells; upregulation of Nos2, Arg1, and Il10; and suppression of TNF production in BM cells than MSCs with control siRNA transfection (Figure 8, C and D). Furthermore, BM cells cocultured with HGF or COX-2 siRNA–transfected MSCs did not inhibit CD4 T cell proliferation and IFN-γ production, whereas BM cells cocultured with control siRNA–transfected MSCs significantly suppressed CD4 T cells and IFN-γ secretion (Figure 8E).
Figure 8. The knockdown of HGF and COX-2 partially reverses the effects of MSCs on BM cell differentiation.
(A) Heatmaps of RNA-Seq on MSCs cultured alone without GM-CSF, MSCs cultured under GM-CSF stimulation, and MSCs cocultured with BM cells under GM-CSF. Presented are the gene expression levels in MSCs cultured with GM-CSF (the first column) and in MSCs cocultured with BM cells + GM-CSF (the second column), relative to those in MSCs cultured without GM-CSF. The genes that encode secreted proteins and were upregulated by >2-fold in MSCs cocultured with BM cells under GM-CSF in comparison with MSCs cultured alone under GM-CSF are listed. The whole data are deposited in ArrayExpress (accession E-MTAB-8976). (B) MSCs were transfected with control siRNA (Con KD MSC), HGF siRNA (HGF KD MSC), or COX-2 siRNA (COX-2 KD MSC) and cocultured with BM cells in either direct or Transwell coculture system (trans) in the presence or absence of GM-CSF. The cell-free culture supernatants were evaluated for the secretion of HGF and PGE2 using ELISA in order to confirm the knockdown of each gene. (C) The flow cytometry results for CD11bmidLy6CmidLy6Glo cells out of BM cells after 5 days of coculture with MSCs. (D) Real-time RT-PCR for mRNA levels of inducible nitric oxide synthase (Nos2), arginase (Arg1), and Il10 in BM cells. ELISA for TNF-α in the cell-free supernatants of BM cell–MSC coculture. (E) BM cells were cocultured with Con KD MSC, HGF KD MSC, or COX-2 KD MSC for 5 days under GM-CSF stimulation. Then, BM cells were separated and cocultured with CFSE-labeled CD4+ cells on anti-CD3 and anti-CD28 antibody–coated plates. After 5 days, CD4+ cell proliferation was evaluated by CFSE dilution assay and IFN-γ secreted level was measured by ELISA. (F) ELISA for PGE2 and HGF in cultures of HGF KD MSC and COX-2 KD MSC, respectively. Three independent sets of experiments in total were performed. Each set contained 2–4 biological samples in each group, and 1 dot depicts data from 1 biological sample. Each biological sample was assayed in 3 technical replicates for RT-PCR and ELISA (mean ± SD). *P < 0.05, **P < 0.01, ***P < 0.001, ****P < 0.0001, ns, not significant. One-way ANOVA and Tukey’s multiple-comparison test were used in B–E and Mann-Whitney test was used in F.
Several reports demonstrated a positive feedback loop between COX-2/PGE2 and HGF expression in macrophages (29) and cancer cells (30, 31). In our system, however, the knockdown of HGF in MSCs did not change the level of PGE2 secreted from MSCs, and COX-2 knockdown in MSCs had no effect on HGF secretion in MSCs (Figure 8F). Thus, the results indicate that the expression of HGF and COX-2/PGE2 in MSCs is independent of each other.
Discussion
Our results demonstrate that CD11bloLy6CloLy6Glo cells in steady-state BM differentiate into predominantly proinflammatory CD11bhiLy6ChiLy6Glo cells during inflammatory myelopoiesis. BM MSCs direct the differentiation program of CD11bloLy6CloLy6Glo cells to generate the subset of CD11bmidLy6CmidLy6Glo immunosuppressive cells. The CD11bmidLy6CmidLy6Glo cells are distinct from CD11bloLy6CloLy6Glo cells or CD11bhiLy6ChiLy6Glo monocytes in terms of a comprehensive transcriptome profile, MHC class II and costimulatory molecule expression, inflammatory and regulatory cytokine production, iNOS and arginase expression, LPS responsiveness, and inhibitory activities on T cells. Based on surface marker expression and T cell–suppressive activity, CD11bmidLy6CmidLy6Glo cells induced by MSCs in the BM during inflammation can be defined as MDSCs.
Various surface markers, such as CD11b, F4/80, Gr-1, Ly6C, and Ly6G, have long been used to delineate highly heterogeneous populations of myeloid cells in mice. Among them, the murine Ly6 system, including Ly6G and Ly6C, is shown to be more useful than F4/80 or Gr-1 for identification of myeloid subsets in mice (32, 33), and Ly6C and Ly6G are widely used to differentiate between PMN-MDSCs (granulocytic) and M-MDSCs (monocytic) (17). Therefore, we capitalized upon CD11b, Ly6C, and Ly6G markers to identify the MDSC subset induced by MSCs in this study.
In line with our observation, previous studies reported the expansion of MDSCs or MDSC-like cells by MSCs. Chen et al. showed that MSC-conditioned media tuned the differentiation of human monocyte-differentiated DCs toward MDSC phenotypes through growth-regulated oncogene chemokines (13). In a similar setting, Yen et al. showed that MSCs increased the number of CD14-CD11b+CD33+ MDSCs in human peripheral blood leukocytes through the secretion of HGF (14). In addition, MSC-derived exosomes were reported to induce expansion of MDSCs in BM cells obtained from multiple myeloma mice (34). Our study is different from these studies in that we used more direct approach, both in vitro and in vivo, to explore the effects of BM-derived MSCs on the differentiation of myeloid progenitors in the BM, the primary site for MDSC expansion, during inflammation-induced hematopoiesis. We furthermore identified the distinct subset of MDSCs expressing intermediate levels of CD11b and Ly6C as the immunosuppressive cells induced by MSCs in the BM.
Although a previous study described the presence of CD11bmid or Ly6Cmid monocytes/macrophages (35), little is known about the function of CD11bmidLy6Cmid myeloid cells. By comparison, there are several studies on CD11blo or Ly6Clo monocytes/macrophages. Schif-Zuck et al. reported that CD11bhi peritoneal macrophages converted to the CD11blo phenotype upon efferocytosis of apoptotic leukocytes during the resolution of murine peritonitis (36). The CD11blo peritoneal macrophages exhibited proresolving properties and lost phagocytic function (36). Conversely, a study by Ghosn et al. showed that small peritoneal macrophages expressing low levels of CD11b and Ly6C but high levels of MHC class II were derived from circulating Ly6ChiMHC class IIlo monocytes and highly phagocytic (37). Another study by de Witte et al. demonstrated that Ly6Clo monocytes appeared in the lung and liver after phagocytosis of umbilical cord–derived MSCs by Ly6Chi monocytes and displayed an immunoregulatory phenotype (38). In our study, the phagocytosis of MSCs by BM monocytes does not wholly explain the mechanism of immunosuppressive CD11bmidLy6CmidLy6Glo cell induction because Transwell coculture with MSCs as well as direct coculture effectively induced CD11bmidLy6CmidLy6Glo cells. Moreover, the question remains as to whether MSCs directly elicit the differentiation of CD11bloLy6CloLy6Glo cells to CD11bmidLy6CmidLy6Glo cells or whether MSCs switch the already differentiated CD11bhiLy6ChiLy6Glo cells to CD11bmidLy6CmidLy6Glo cells. It is also possible that MSCs simply halt or delay the differentiation process from CD11bloLy6CloLy6Glo cells to CD11bhiLy6ChiLy6Glo cells, resulting in the emergence of the CD11bmidLy6CmidLy6Glo population in the process. The latter possibility, however, is less likely because CD11bmidLy6CmidLy6Glo cells were actively immunosuppressive and clearly distinguishable from CD11bloLy6CloLy6Glo cells and CD11bhiLy6ChiLy6Glo cells. Still, considering that myeloid cell differentiation is in a continuum involving multiple intermediate cell types, further studies would be necessary to define the CD11bmidLy6CmidLy6Glo cells as a distinct MDSC subset induced by MSCs.
After i.v. administration, MSCs are immediately trapped in the lung, and only a small fraction of MSCs escape trapping in the lung (39). Our group previously demonstrated that about 1.8% of MSCs were present in CLNs 1 day after i.v. infusion (15) and no MSCs were found in the BM (40). Nevertheless, i.v. MSCs caused a significant change in BM myeloid cell subsets in EAU mice by inducing CD11bmidLy6CmidLy6Glo MDSCs in the present study. These results support the notion that MSCs exert their immunomodulatory effects through a paracrine mechanism. Indeed, our in vitro experiments showed that Transwell coculture of MSCs with BM cells was effective in the induction of MDSCs, and these effects were mediated in part by secretion of HGF and PGE2 from MSCs. Given a plethora of therapeutic factors and extracellular vesicles that MSCs produce upon injury, other paracrine factors than HGF and PGE2 might as well be involved in the MSC action. In addition, it is possible that MSCs modulate myeloid cell differentiation in a direct cell-to-cell contact system through a different mechanism from the one in a Transwell system. It is also plausible that MDSCs induced by MSCs in a direct cell-to-cell contact setting might be different from MDSCs induced by MSCs in a Transwell system. Indeed, our results showed that MSCs in Transwell coculture induced a higher level of arginase in BM cells than MSCs in direct coculture, while MSCs in direct coculture stimulated higher production of IL-10 and active TGF-β in BM cells than MSCs in Transwell coculture (Figure 2). However, given that MSCs rarely migrate to the BM after i.v. administration, the usual route used in clinic, the therapeutic effects of MSCs observed in vivo are largely explained by therapeutic factors that MSCs secrete.
In conclusion, we identified and characterized CD11bmidLy6CmidLy6Glo MDSCs induced by MSCs in the BM during inflammatory myelopoiesis. Our results elucidate one of the mechanisms of crosstalk between BM stromal and myeloid cells to regulate excessive immune response and maintain tissue homeostasis.
Methods
Cell isolation and sorting.
BM cells were isolated by flushing the BM of the femurs and tibias of 7-week-old B6 mice (C57BL/6NCrljOri, H-2b, Orient Bio). The collected cell suspension was filtered through a 70-μM cell strainer (catalog 352350, Corning Inc.) and centrifuged at 300 g for 10 minutes. After RBC lysis in the buffer (catalog 00-4300-54, eBioscience), BM cells were cultured in RPMI 1640 media (catalog LM011-01, Welgene) with 2% (vol/vol) heat-inactivated FBS (catalog 10099-141, Gibco) and 1% penicillin-streptomycin (PS) (catalog 17-602E, Lonza) at 37°C in 5% CO2. For differentiation induction, GM-CSF (40 ng/mL, GenScript) was added to the culture for 5 days.
Human BM-derived MSCs were obtained from the Center for the Preparation and Distribution of Adult Stem Cells (http://medicine.tamhsc.edu/irm/msc-distribution.html). MSCs were cultured in complete culture media (CCM) composed of α-minimal essential medium (Gibco), 16.5% FBS (Gibco), and 1% PS (Lonza). MSCs were cocultured with BM cells at a ratio of 1:5 (MSCs/BM cell) in either direct or Transwell coculture system. Before Transwell coculture, MSCs were seeded in Transwell inserts (0.4 μM, Millicell Cell Culture Inserts, Merck Millipore) and incubated in CCM for 24 hours. Then, MSCs in Transwell inserts were cocultured with BM cells in the BM cell culture media.
For isolation of CD11bloLy6CloLy6Glo cells, CD11bmidLy6CmidLy6Glo cells, and CD11bhiLy6ChiLy6Glo cells, BM cells were stained with anti-CD11b (catalog 17-0112-82, clone M1/70, eBioscience), anti-Ly6C (catalog 45-5932-82, clone HK1.4, eBioscience), and anti-Ly6G antibodies (catalog 11-9668-82, clone 1A8-Ly6g, eBioscience) and sorted using a flow cytometer (BD FACSAria III cell sorter, BD Biosciences).
CD4+ cells were isolated from the spleens of C57BL/6 mice. The single-cell suspension was prepared by grinding the excised tissue between the frosted ends of 2 slides, and the cells were filtered through 70-μM cell strainer (catalog 352350, Corning Inc.). CD4+ cells were then sorted using CD4 MACS beads (catalog 130-045, Miltenyi Biotec) in accordance with the manufacturer’s protocols (purity >95%).
Flow cytometry.
The cells were stained with fluorescence-conjugated antibodies (all from eBioscience) against CD11b (catalog 17-0112-82, clone M1/70), Ly6C (catalog 45-5932-82, clone HK1.4), Ly6G (catalog 11-9668-82, clone 1A8-Ly6g), MHC class II (H-2b) (catalog 17-5321-81, clone M5/114.15.2), CD40 (catalog 12-0401-82, clone 1C10), CD80 (catalog 12-0401-82, clone 16-10A1), CD86 (catalog 17-0862-28, clone GL1), CD206 (catalog 12-2061-82, clone MR6F3), CD4 (catalog 1C10, clone 16-10A1), arginase (catalog 17-3697-82, clone A1exF5), IL-10 (catalog 17-7101-82, clone JES5-16E3), IFN-γ (catalog 17-7311-82, clone XMG1.2), IL-17 (catalog 17-7177-81, clone eBio17B7), or Foxp3 (catalog 45-5773-82, clone FJK-16s). For IFN-γ and IL-17 intracellular staining, cells were prestimulated with 50 ng/mL PMA and 1 μg/mL ionomycin at 37°C for 24 hours in the presence of Invitrogen eBioscience Protein Transport Inhibitor Cocktail (catalog 50-930-9, Invitrogen) before staining. For arginase and IL-10 intracellular staining, cells were stimulated with eBioscience Cell Stimulation Cocktail (catalog 00-4975-93, Invitrogen) and eBioscience Protein Transport Inhibitor Cocktail (catalog 00-4980-03, Invitrogen) for 24 hours before staining.
For flow cytometric analysis of CLN cells, single-cell suspension was acquired by mincing CLNs between the frosted ends of 2 glass slides in RPMI 1640 medium (Welgene) containing 10% FBS (Gibco) and filtering through a 70-μM cell strainer (Corning Inc.). The resultant suspension was centrifuged and stained with fluorescence-conjugated antibodies.
The cells were assayed for fluorescence using a S1000EXi Flow Cytometer (Stratedigm), and data were analyzed using FlowJo program (Tree Star Inc.).
Real-time RT-PCR.
Cells or ocular tissues were lysed in RNA isolation reagent (RNA Bee, Tel-Test) and homogenized with an ultrasound sonicator (Ultrasonic Processor, Cole Parmer Instruments). Total RNA was extracted using a RNeasy Mini Kit (QIAGEN). First-strand cDNA was synthesized by reverse transcription (High Capacity RNA-to-cDNA Kit, Applied Biosystems). Real-time amplification was performed with TaqMan Universal PCR Master Mix (Applied Biosystems) in an automated instrument (ABI 7500 Real-time PCR System, Applied Biosystems) for Arg1, Nos2, Il10, Ifnγ, Tnfα, Il1β, Il6, Cox2, and Hgf. Data were normalized to GAPDH and expressed as fold changes relative to controls. All PCR probe sets were purchased from Applied Biosystems (TaqMan Gene Expression Assay kits, Applied Biosystems).
ELISA.
The cell-free supernatants were collected from cell cultures after centrifugation at 635 g for 5 minutes at 20°C and assayed for concentrations of TNF-α, IL-10, IL-12, IFN-γ, active TGF-β1, active TGF-β2, HGF (all DuoSet ELISA kits from R&D Systems), and PGE2 (Prostaglandin E2 Parameter Assay Kit, catalog KGE004B, R&D Systems).
LPS stimulation assay.
BM cells were treated with 100 ng/mL LPS (InvivoGen) for 18 hours. The cells were assessed for expression of MHC class II, CD40, CD80, and CD86 on the surface by flow cytometry, and the cell-free culture supernatant was examined for the concentration of TNF-α and IL-12 by ELISA (DuoSet ELISA kits, R&D Systems).
Cell proliferation assay.
The isolated CD4+ cells were prelabeled with 5 μM CFSE (CellTrace CFSE kit, catalog C34554, Invitrogen) at 37°C for 10 minutes. After PBS washing, the CFSE-labeled CD4+ cells were seeded onto plates coated with 5 μg/mL anti-CD3 (catalog 16-0031-86, clone 145-2C11, eBioscience) and anti-CD28 mAbs (catalog 16-0281-86, clone 37.51, eBioscience) and cocultured with sorted BM cells (CD11bloLy6CloLy6Glo cells, CD11bmidLy6CmidLy6Glo cells, or CD11bhiLy6ChiLy6Glo cells) in direct coculture system at a ratio of 1:5 or 1:2 (BM cell/CD4) in the BM cell culture media containing DMEM (Welgene), 10% FBS (Gibco), and 1% PS (Lonza) for 5 days. The CFSE fluorescence was measured using a flow cytometer (S1000EXi Flow Cytometer, Stratedigm).
NOS inhibition and activity measurement.
For nonspecific inhibition of NOS, 5 mM L-NMMA (catalog M7033, MilliporeSigma) was added to the culture, and the effective inhibition of NOS activity was confirmed in the cell lysates with the Nitric Oxide Synthase Activity Assay kit (catalog K205-100, Biovision).
RNA-Seq.
For RNA-Seq with the sorted BM cells and MSCs, 500 ng total RNA was prepared from BM cells and MSCs, respectively, and the construction of library was made with the QuantSeq 3′ mRNA-Seq Library Prep Kit (Lexogen) according to the manufacturer’s instructions. High-throughput sequencing was performed as single-end 75 sequencing using NextSeq 500 (Illumina). QuantSeq 3′ mRNA-Seq reads were aligned using Bowtie2, and differentially expressed gene were determined based on counts from unique and multiple alignments using coverage in Bedtools. Gene classification was based on searches done by DAVID (http://david.abcc.ncifcrf.gov/) and Medline databases (http://www.ncbi.nlm.nih.gov/). The data were deposited in ArrayExpress (accession E-MTAB-8975 for murine BM cells and E-MTAB-8976 for human MSCs).
Transfection.
For siRNA transfection, MSCs were transfected with COX-2 siRNA (catalog sc-29279, Santa Cruz Biotechnology), HGF siRNA (catalog sc-37111, Santa Cruz Biotechnology), or control siRNA (catalog sc-37007, Santa Cruz Biotechnology) using a commercial kit (Lipofectamine RNAiMAX reagent, catalog 13778-075, Invitrogen) per the manufacturer’s instructions. The knockdown efficiency of each gene was confirmed by real-time RT-PCR and ELISA 24 hours after the start of transfection.
Animal model and adoptive transfer of cells.
EAU was induced in 7-week-old C57BL/6 (C57BL/6NCrljOri) male mice (Orient Bio) using standards method as previously described (15). Briefly, a mouse was immunized with subcutaneous injection of the retina-specific antigen, interphotoreceptor retinal binding protein peptide (IRBP) 1–20, GPTHLFQPSLVLDMAKVLLD (250 μg, Peptron), which was emulsified in CFA (MilliporeSigma) containing killed Mycobacterium tuberculosis (2.5 mg/mL, BD Difco) into a footpad. Simultaneously, 0.7 μg pertussis toxin (300 μl, MilliporeSigma) was injected into the peritoneal cavity.
CD11bloLy6CloLy6Glo cells, CD11bmidLy6CmidLy6Glo cells, or CD11bhiLy6ChiLy6Glo cells, which were sorted from BM cells (as in Figure 5A) and stimulated by 100 ng/mL LPS for 18 hours, were i.v. transferred into mice right after EAU induction (4 × 10⁵ cells/100 μl BSS per mouse). The same volume of vehicle (BSS) was injected via tail vein in control mice.
Histology.
The excised eyeballs were fixed in 10% formaldehyde and embedded in paraffin. The 6-μm-thickness sections were stained with H&E or subjected to CD3 immunostaining using rabbit polyclonal anti-mouse CD3 (catalog ab5690, Abcam). Retinal histology scores were assessed in the H&E-stained slides on a scale of 0–4 using the criteria previously defined by Caspi (41): score 0 (no change), score 0.5 (1–2 very small, peripheral focal chorioretinal lesions), score 1 (<5 focal lesions; ≤1 linear chorioretinal lesion), score 2 (multiple [>5] chorioretinal lesions and/or infiltrations; severe vasculitis [large size, thick wall, infiltrations]; < 5 linear lesions), score 3 (pattern of linear lesions; large confluent lesions; subretinal neovascularization), and score 4 (large retinal detachment; retinal atrophy).
Statistics.
GraphPad Prism Software was used for statistical tests. Levene’s test was used to check homogeneity of variance. Data were analyzed by Mann-Whitney test to compare means of 2 groups or by 1-way ANOVA to compare 3 or more groups. Tukey’s honestly significant difference test was used for a follow-up pairwise comparison of the groups. Data were presented as mean ± SD, and no data were excluded from the analysis. Differences were considered significant at P < 0.05.
Study approval.
The experimental protocol for animal studies was approved by the Institutional Animal Care and Use Committee of Seoul National University Biomedical Research Institute (IACUC no. 17-0081).
Author contributions
HJL, JHK, HJK, HJJ, and JYO conducted experiments and acquired data. HJL, JHK, and JYO designed the study and analyzed the data. HJL, JHK, and JYO wrote the manuscript. JYO acquired the funding and supervised the study.
Supplementary Material
Acknowledgments
This research was supported by a grant from the Korea Health Technology R&D Project through the Korea Health Industry Development Institute, funded by the Ministry of Health and Welfare, Republic of Korea (grant HI15C3134).
Version 1. 05/26/2020
In-Press Preview
Version 2. 06/18/2020
Electronic publication
Funding Statement
This research was supported by a grant of the Korea Health Technology R&D Project through the Korea Health Industry Development Institute (KHIDI), funded by the Ministry of Health & Welfare, Republic of Korea (grant number: HI15C3134).
Footnotes
Conflict of interest: The authors have declared that no conflict of interest exists.
Copyright: © 2020, American Society for Clinical Investigation.
Reference information: JCI Insight. 2020;5(12):e136059.https://doi.org/10.1172/jci.insight.136059.
Contributor Information
Hyun Ju Lee, Email: dalmuly@empas.com.
Jung Hwa Ko, Email: kjh382@hanmail.net.
Hyeon Ji Kim, Email: tuntun9@naver.com.
Hyun Jeong Jeong, Email: hj-2024@hanmail.net.
Joo Youn Oh, Email: jooyounoh77@gmail.com.
References
- 1.Cheung TS, Dazzi F. Mesenchymal-myeloid interaction in the regulation of immunity. Semin Immunol. 2018;35:59–68. doi: 10.1016/j.smim.2018.01.002. [DOI] [PubMed] [Google Scholar]
- 2.Veglia F, Perego M, Gabrilovich D. Myeloid-derived suppressor cells coming of age. Nat Immunol. 2018;19(2):108–119. doi: 10.1038/s41590-017-0022-x. [DOI] [PMC free article] [PubMed] [Google Scholar]
- 3.Vlachou K, et al. Elimination of granulocytic myeloid-derived suppressor cells in lupus-prone mice linked to reactive oxygen species-dependent extracellular trap formation. Arthritis Rheumatol. 2016;68(2):449–461. doi: 10.1002/art.39441. [DOI] [PubMed] [Google Scholar]
- 4.Kontaki E, Boumpas DT, Tzardi M, Mouzas IA, Papadakis KA, Verginis P. Aberrant function of myeloid-derived suppressor cells (MDSCs) in experimental colitis and in inflammatory bowel disease (IBD) immune responses. Autoimmunity. 2017;50(3):170–181. doi: 10.1080/08916934.2017.1283405. [DOI] [PubMed] [Google Scholar]
- 5.Zhang H, et al. Myeloid-derived suppressor cells are proinflammatory and regulate collagen-induced arthritis through manipulating Th17 cell differentiation. Clin Immunol. 2015;157(2):175–186. doi: 10.1016/j.clim.2015.02.001. [DOI] [PMC free article] [PubMed] [Google Scholar]
- 6.Whitfield-Larry F, Felton J, Buse J, Su MA. Myeloid-derived suppressor cells are increased in frequency but not maximally suppressive in peripheral blood of type 1 diabetes mellitus patients. Clin Immunol. 2014;153(1):156–164. doi: 10.1016/j.clim.2014.04.006. [DOI] [PubMed] [Google Scholar]
- 7.Park MJ, et al. Interleukin-10 produced by myeloid-derived suppressor cells is critical for the induction of Tregs and attenuation of rheumatoid inflammation in mice. Sci Rep. 2018;8(1):3753. doi: 10.1038/s41598-018-21856-2. [DOI] [PMC free article] [PubMed] [Google Scholar]
- 8.Jeong HJ, et al. Myeloid-derived suppressor cells mediate inflammation resolution in humans and mice with autoimmune uveoretinitis. J Immunol. 2018;200(4):1306–1315. doi: 10.4049/jimmunol.1700617. [DOI] [PubMed] [Google Scholar]
- 9.Yin B, et al. Myeloid-derived suppressor cells prevent type 1 diabetes in murine models. J Immunol. 2010;185(10):5828–5834. doi: 10.4049/jimmunol.0903636. [DOI] [PMC free article] [PubMed] [Google Scholar]
- 10.Xia S, Sha H, Yang L, Ji Y, Ostrand-Rosenberg S, Qi L. Gr-1+ CD11b+ myeloid-derived suppressor cells suppress inflammation and promote insulin sensitivity in obesity. J Biol Chem. 2011;286(26):23591–23599. doi: 10.1074/jbc.M111.237123. [DOI] [PMC free article] [PubMed] [Google Scholar]
- 11.Lee HJ, Park SY, Jeong HJ, Kim HJ, Kim MK, Oh JY. Glucocorticoids induce corneal allograft tolerance through expansion of monocytic myeloid-derived suppressor cells. Am J Transplant. 2018;18(12):3029–3037. doi: 10.1111/ajt.15026. [DOI] [PubMed] [Google Scholar]
- 12.He Y, Bei J, Zeng H, Pan Z. The roles of sepsis-induced myeloid derived suppressor cells in mice corneal, skin and combined transplantation. Transpl Immunol. 2016;34:8–13. doi: 10.1016/j.trim.2015.12.003. [DOI] [PubMed] [Google Scholar]
- 13.Chen HW, et al. Mesenchymal stem cells tune the development of monocyte-derived dendritic cells toward a myeloid-derived suppressive phenotype through growth-regulated oncogene chemokines. J Immunol. 2013;190(10):5065–5077. doi: 10.4049/jimmunol.1202775. [DOI] [PubMed] [Google Scholar]
- 14.Yen BL, et al. Multipotent human mesenchymal stromal cells mediate expansion of myeloid-derived suppressor cells via hepatocyte growth factor/c-met and STAT3. Stem Cell Reports. 2013;1(2):139–151. doi: 10.1016/j.stemcr.2013.06.006. [DOI] [PMC free article] [PubMed] [Google Scholar]
- 15.Lee HJ, et al. Mesenchymal stem/stromal cells protect against autoimmunity via CCL2-dependent recruitment of myeloid-derived suppressor cells. J Immunol. 2015;194(8):3634–3645. doi: 10.4049/jimmunol.1402139. [DOI] [PubMed] [Google Scholar]
- 16.Ko JH, Lee HJ, Jeong HJ, Oh JY. Ly6Chi monocytes are required for mesenchymal stem/stromal cell-induced immune tolerance in mice with experimental autoimmune uveitis. Biochem Biophys Res Commun. 2017;494(1-2):6–12. doi: 10.1016/j.bbrc.2017.10.097. [DOI] [PubMed] [Google Scholar]
- 17.Bronte V, et al. Recommendations for myeloid-derived suppressor cell nomenclature and characterization standards. Nat Commun. 2016;7:12150. doi: 10.1038/ncomms12150. [DOI] [PMC free article] [PubMed] [Google Scholar]
- 18.Mitroulis I, Kalafati L, Hajishengallis G, Chavakis T. Myelopoiesis in the context of innate immunity. J Innate Immun. 2018;10(5-6):365–372. doi: 10.1159/000489406. [DOI] [PMC free article] [PubMed] [Google Scholar]
- 19.Lu G, et al. Myeloid cell-derived inducible nitric oxide synthase suppresses M1 macrophage polarization. Nat Commun. 2015;6:6676. doi: 10.1038/ncomms7676. [DOI] [PMC free article] [PubMed] [Google Scholar]
- 20.Dugast AS, et al. Myeloid-derived suppressor cells accumulate in kidney allograft tolerance and specifically suppress effector T cell expansion. J Immunol. 2008;180(12):7898–7906. doi: 10.4049/jimmunol.180.12.7898. [DOI] [PubMed] [Google Scholar]
- 21.Deng Y, et al. Umbilical cord-derived mesenchymal stem cells instruct monocytes towards an IL10-producing phenotype by secreting IL6 and HGF. Sci Rep. 2016;6:37566. doi: 10.1038/srep37566. [DOI] [PMC free article] [PubMed] [Google Scholar]
- 22.Rutella S, et al. Hepatocyte growth factor favors monocyte differentiation into regulatory interleukin (IL)-10++IL-12low/neg accessory cells with dendritic-cell features. Blood. 2006;108(1):218–227. doi: 10.1182/blood-2005-08-3141. [DOI] [PubMed] [Google Scholar]
- 23.Obermajer N, Wong JL, Edwards RP, Odunsi K, Moysich K, Kalinski P. PGE(2)-driven induction and maintenance of cancer-associated myeloid-derived suppressor cells. Immunol Invest. 2012;41(6-7):635–657. doi: 10.3109/08820139.2012.695417. [DOI] [PubMed] [Google Scholar]
- 24.Obermajer N, Muthuswamy R, Lesnock J, Edwards RP, Kalinski P. Positive feedback between PGE2 and COX2 redirects the differentiation of human dendritic cells toward stable myeloid-derived suppressor cells. Blood. 2011;118(20):5498–5505. doi: 10.1182/blood-2011-07-365825. [DOI] [PMC free article] [PubMed] [Google Scholar]
- 25.Condamine T, Mastio J, Gabrilovich DI. Transcriptional regulation of myeloid-derived suppressor cells. J Leukoc Biol. 2015;98(6):913–922. doi: 10.1189/jlb.4RI0515-204R. [DOI] [PMC free article] [PubMed] [Google Scholar]
- 26.Ko JH, Kim HJ, Jeong HJ, Lee HJ, Oh JY. Mesenchymal stem and stromal cells harness macrophage-derived amphiregulin to maintain tissue homeostasis. Cell Rep. 2020;30(11):3806–3820.e6. doi: 10.1016/j.celrep.2020.02.062. [DOI] [PubMed] [Google Scholar]
- 27.Vasandan AB, Jahnavi S, Shashank C, Prasad P, Kumar A, Prasanna SJ. Human Mesenchymal stem cells program macrophage plasticity by altering their metabolic status via a PGE2-dependent mechanism. Sci Rep. 2016;6:38308. doi: 10.1038/srep38308. [DOI] [PMC free article] [PubMed] [Google Scholar]
- 28.Németh K, et al. Bone marrow stromal cells attenuate sepsis via prostaglandin E(2)-dependent reprogramming of host macrophages to increase their interleukin-10 production. Nat Med. 2009;15(1):42–49. doi: 10.1038/nm.1905. [DOI] [PMC free article] [PubMed] [Google Scholar]
- 29.Byun JY, Youn YS, Lee YJ, Choi YH, Woo SY, Kang JL. Interaction of apoptotic cells with macrophages upregulates COX-2/PGE2 and HGF expression via a positive feedback loop. Mediators Inflamm. 2014;2014:463524. doi: 10.1155/2014/463524. [DOI] [PMC free article] [PubMed] [Google Scholar]
- 30.Moore AE, et al. HGF/Met signalling promotes PGE(2) biogenesis via regulation of COX-2 and 15-PGDH expression in colorectal cancer cells. Carcinogenesis. 2009;30(10):1796–1804. doi: 10.1093/carcin/bgp183. [DOI] [PubMed] [Google Scholar]
- 31.Huang KH, et al. Correlation between HGF/c-Met and Notch1 signaling pathways in human gastric cancer cells. Oncol Rep. 2018;40(1):294–302. doi: 10.3892/or.2018.6447. [DOI] [PMC free article] [PubMed] [Google Scholar]
- 32.Rose S, Misharin A, Perlman H. A novel Ly6C/Ly6G-based strategy to analyze the mouse splenic myeloid compartment. Cytometry A. 2012;81(4):343–350. doi: 10.1002/cyto.a.22012. [DOI] [PMC free article] [PubMed] [Google Scholar]
- 33.Lee PY, Wang JX, Parisini E, Dascher CC, Nigrovic PA. Ly6 family proteins in neutrophil biology. J Leukoc Biol. 2013;94(4):585–594. doi: 10.1189/jlb.0113014. [DOI] [PubMed] [Google Scholar]
- 34.Wang J, et al. The bone marrow microenvironment enhances multiple myeloma progression by exosome-mediated activation of myeloid-derived suppressor cells. Oncotarget. 2015;6(41):43992–44004. doi: 10.18632/oncotarget.6083. [DOI] [PMC free article] [PubMed] [Google Scholar]
- 35.Stables MJ, et al. Transcriptomic analyses of murine resolution-phase macrophages. Blood. 2011;118(26):e192–e208. doi: 10.1182/blood-2011-04-345330. [DOI] [PMC free article] [PubMed] [Google Scholar]
- 36.Schif-Zuck S, Gross N, Assi S, Rostoker R, Serhan CN, Ariel A. Saturated-efferocytosis generates pro-resolving CD11b low macrophages: modulation by resolvins and glucocorticoids. Eur J Immunol. 2011;41(2):366–379. doi: 10.1002/eji.201040801. [DOI] [PMC free article] [PubMed] [Google Scholar]
- 37.Ghosn EE, et al. Two physically, functionally, and developmentally distinct peritoneal macrophage subsets. Proc Natl Acad Sci USA. 2010;107(6):2568–2573. doi: 10.1073/pnas.0915000107. [DOI] [PMC free article] [PubMed] [Google Scholar]
- 38.de Witte SFH, et al. Immunomodulation by therapeutic mesenchymal stromal cells (MSC) is triggered through phagocytosis of MSC by monocytic cells. Stem Cells. 2018;36(4):602–615. doi: 10.1002/stem.2779. [DOI] [PubMed] [Google Scholar]
- 39.Prockop DJ, Oh JY, Lee RH. Data against a common assumption: xenogeneic mouse models can be used to assay suppression of immunity by human MSCs. Mol Ther. 2017;25(8):1748–1756. doi: 10.1016/j.ymthe.2017.06.004. [DOI] [PMC free article] [PubMed] [Google Scholar]
- 40.Lee RH, et al. Intravenous hMSCs improve myocardial infarction in mice because cells embolized in lung are activated to secrete the anti-inflammatory protein TSG-6. Cell Stem Cell. 2009;5(1):54–63. doi: 10.1016/j.stem.2009.05.003. [DOI] [PMC free article] [PubMed] [Google Scholar]
- 41.Caspi RR. Experimental autoimmune uveoretinitis in the rat and mouse. Curr Protoc Immunol. 2003;Chapter 15:Unit 15.6. doi: 10.1002/0471142735.im1506s53. [DOI] [PubMed] [Google Scholar]
Associated Data
This section collects any data citations, data availability statements, or supplementary materials included in this article.


