. 2020 Aug 4;9:e58706. doi: 10.7554/eLife.58706

Figure 5. ATP dysregulation precedes voltage-induced bactericidal killing.

(A) iATPSnFR ratios from E. coli treated with vehicle (blue) or 10 µg/mL gentamicin (orange). The ratio of iATPSnFR (488 nm) to mRuby (561 nm) indicates ATP concentration. Each trace averages two biological replicates. (B–F) Cells treated with 10 µg/mL gentamicin. (B) iATPSnFR ratios from gentamicin-treated cells that do (blue) or do not (orange) regrow. The star represents a significance of < 0.05 tested at 2 hr after treatment using a student t-test with unequal variance. (C) Normalized CFUs of gentamicin-treated knockouts of components of the F1Fo-ATPase compared to WT. Each data point is in biological triplicate. (D) Mean moving GCaMP6f SD for gentamicin-treated F1Fo-ATPase component knockouts compared to WT. Each curve averages four biological replicates. (E) Mean moving GCaMP6f SD for gentamicin-treated E. coli strain DK8, missing all components of the F1Fo-ATPase compared to WT. Each curve averages four biological replicates. (F) Normalized CFUs of gentamicin-treated mgtC expressing E. coli compared to WT.

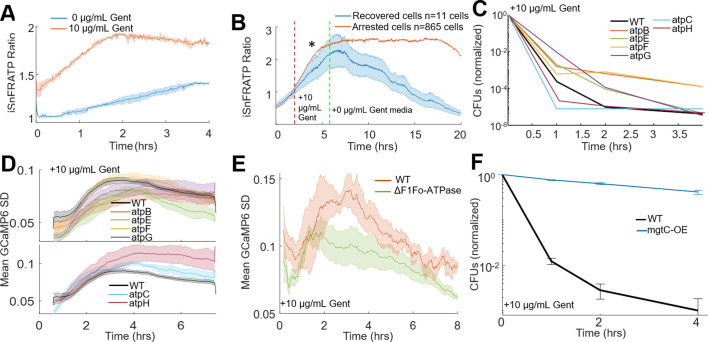
Figure 5.

Figure 5—figure supplement 1. ATP and membrane potential measurements are consistent with ATP dysregulation.

Figure 5—figure supplement 1.

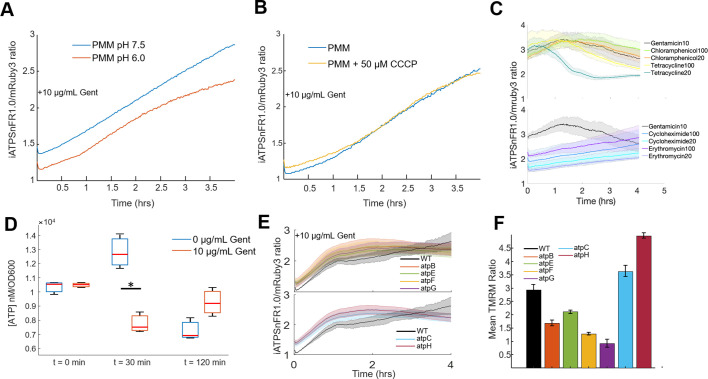
(A,B) Low pH and CCCP maintain the rise in the iATPSnFR1.0/mRuby ratio upon gentamicin treatment when compared to controls. (A) ATP measured in PMM pH 7.5 (blue) or low pH (orange) upon treatment with 10 µg/mL gentamicin. Each line represents the average of three biological replicates. (B) ATP measured in PMM (blue) or PMM + 50 µM CCCP (yellow) upon treatment with 10 µg/mL gentamicin. Each line represents the average of four biological replicates. Even under protective conditions of CCCP or pH 6, 10 µg/mL gentamicin still induced a rise in ATP, but was not coupled with cell death. (C) Some bacteriostatic antibiotics have similar iATPSnFR1.0 ratios compared to gentamicin-treated cells. (D) ATP concentration was quantified with a BacTiter Glo kit in the absence (blue boxplots) and presence (orange boxplots) of 10 µg/mL gentamicin at 0, 30, and 120 min. Simultaneously the optical density at 600 nm was read out, and the proportion of ATP to OD was taken to normalize the amount of ATP across the different time points and treatment conditions. The only significant difference between conditions is at 30 min with a p-value of 0.0036. (E,F) Compared to WT (black). (E) ATP concentration of 10 µg/mL gentamicin-treated F1Fo-ATPase component knockouts. Each curve averages four biological replicates. (F) A bar plot of the ratio of the mean TMRM fluorescence from gentamicin treated (2 hr) to untreated cells measured by flow cytometry. Error bars are 95% confidence interval.
Figure 5—figure supplement 2. Basal membrane potential measured in strains tested that protect against aminoglycosides does not explain the protective effect.

Figure 5—figure supplement 2.

(A) Violin plots of individual clonal populations of E. coli treated with 200 nM TMRM measured by flow cytometry, with additional strain and treatment indicated on the x-axis. CCCP concentration is 50 µM. All strains are grown to mid-log. (B) Violin plots of individual clonal populations of E. coli treated with 200 nM TMRM measured by flow cytometry, with additional strain and treatment indicated on the x-axis. CCCP concentration is 50 µM. All strains are grown to mid-log. (C) Violin plots of individual clonal populations of E. coli treated with 1 µM DiOC6(3) measured by cytometry, with additional strain and treatment indicated on the x-axis. CCCP concentration is 50 µM. All strains are grown to mid-log.
Figure 5—figure supplement 3. Proposed model of aminoglycoside-induced cell death in E. coli.

Figure 5—figure supplement 3.

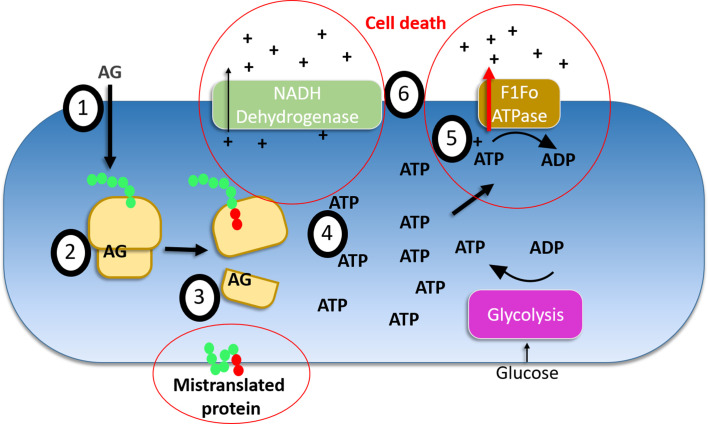
(1) Uptake of aminoglycosides has been extensively studied and is not shown in detail here, although our data indicates that aminoglycoside uptake can occur in the absence of membrane potential. (2) Aminoglycosides bind to ribosomes and (3) in the process create mistranslated protein and inhibit translation for a majority of translating ribosomes. These mistranslated proteins are implicated in creating pores in the inner membrane that occur regardless of polarization. Pore formation appears to be an essential step in aminoglycoside-mediated bactericide that distinguishes it from other translation inhibitors. With the loss of translation, (4) ATP is more readily available to other cellular processes. This in turn causes (5) ATPases (including the F1Fo ATPase) to increase their activity given the greater accessibility of ATP, causing the F1Fo ATPase to hyperpolarize cells. This hyperpolarization is required for the (6) bactericidal activity to occur in our observations. Cellular processes including the electron transport chain’s dehydrogenase activity, as well as the energetic state of the cell help determine the degree to which this bactericidal activity occurs. Specifically, higher respiration and carbon sources that contribute the most ATP to the cell (glucose) are the most detrimental prior states E. coli can experience before aminoglycoside treatment. Red circles indicate processes that have data supporting their essentiality in mediating aminoglycoside cell death that do not involve the direct binding of ribosomes.