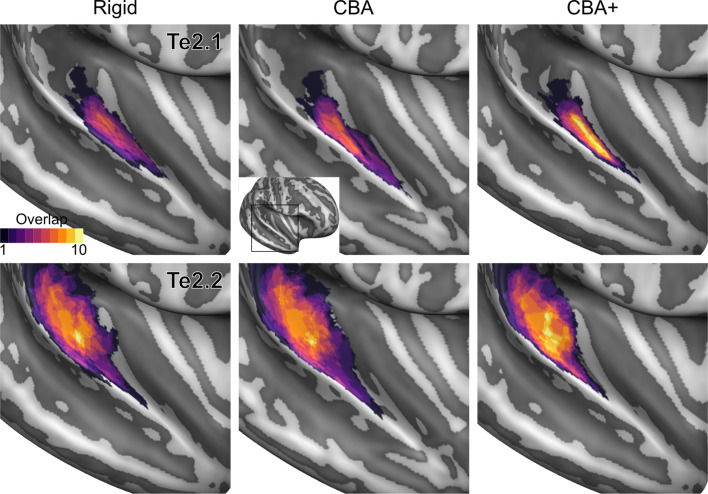
Figure 5. Probabilistic maps (after alignment) indicating the number of subjects for which a given vertex is labeled as belonging to the cytoarchitectonic areas Te2.1 and Te2.2 are presented on inflated group average cortical surfaces of the right hemisphere.
Columns show spherical rigid body alignment, curvature-based alignment (CBA) and CBA with anatomical priors (CBA+) from left to right. Improvements in the micro-anatomical correspondence diminishes low values in the maps (purple) and increases the presence of high probability values (yellow).

