. 2020 Jul 10;9:e56782. doi: 10.7554/eLife.56782

Figure 1. Glucose metabolism in PDAC tumors.

(A) Plasma glucose levels over time in autochthonous LSL-KrasG12D/+; Trp53fl/fl; Pdx1-Cre (KP-/-C) or autochthonous LSL-KrasG12D/+; Trp53R172H/+; Pdx1-Cre (KPC) pancreatic tumor-bearing mice infused with U-13C-glucose at a rate of 0.4 mg/min. n = 3 for each group. Mean +/- SEM is shown. (B) Enrichment of fully labeled glucose (M+6) in plasma from the indicated mice following a 6 hr U-13C-glucose infusion at a rate of 0.4 mg/min. Non-tumor bearing C57Bl6/J (WT) mice were used to assess metabolite labeling in normal pancreas. WT, n = 4; KP-/-C, n = 3, KPC, n = 3. Differences in plasma glucose enrichment were not significant between WT and KP-/-C mice (p=0.8723), WT and KPC mice (p=0.1907), or KP-/-C and KPC tumor-bearing mice (p=0.1512) based on unpaired, two-tailed student’s t tests. Mean +/- SEM is shown. (C–F) The fractional labeling of pyruvate (C), lactate (D), alanine (E), and serine (F) in pancreas (black), autochthonous KP-/-C pancreatic tumors (dark blue), or autochthonous KPC pancreatic tumors (light blue) following a 6 hr U-13C-glucose infusion at a rate of 0.4 mg/min. The M+3 isotopomers are shown for each metabolite: n = 3 for each group. Mean +/- SEM is shown. (G) Schematic illustrating how U-13C-glucose can label TCA cycle intermediates. An M+2 labeling pattern of TCA cycle intermediates can be derived from flux through pyruvate dehydrogenase (PDH) (left) while an M+3 labeling pattern can reflect flux through pyruvate carboxylase (PC) (right). (H–O) The fractional labeling of citrate (M+3; WT vs. KP-/-C p=0.0012, KP-/-C vs. KPC p=0.0084) (H), α-ketoglutarate (αKG) (I), succinate (J), fumarate (K), malate (M+3 KP-/-C vs. KPC p=0.0156) (L), aspartate (M+3 WT vs. KPC p=0.0194) (M), glutamate (M+2 WT vs. KP-/-C p=0.0089) (N), and proline (O) in pancreas (black), autochthonous KP-/-C pancreatic tumors (dark blue), or autochthonous KPC pancreatic tumors (light blue) following a 6 hr U-13C-glucose infusion at a rate of 0.4 mg/min. Significance based on unpaired, Students t-test. The M+2 and M+3 isotopomers are shown for each metabolite, n = 3 for each group. Mean +/- SEM is shown.

Figure 1—source data 1. Isotope labeling of tumors in U-13C- glucose-infused mice with autochthonous PDAC tumors presented in Figure 1.

Figure 1.

Figure 1—figure supplement 1. Metabolite abundance and plasma labeling in U-13C- glucose-infused autochthonous PDAC tumors.

Figure 1—figure supplement 1.

(A) Relative abundance of tumor metabolites in autochthonous LSL-KrasG12D/+; Trp53fl/fl; Pdx1-Cre (KP-/-C) (dark blue) or autochthonous LSL-KrasG12D/+; Trp53R172H/+; Pdx1-Cre (KPC) (light blue) pancreatic tumor-bearing mice infused with U-13C-glucose for 6 hr at a rate of 0.4 mg/min. Non-tumor bearing C57Bl6/J (WT) mice (black) were used to assess metabolite abundance in normal pancreas. Total ion counts were first normalized to tissue weight and norvaline abundance as an internal control, and then WT pancreas values were set to 1. Differences were significant based on unpaired, Students t-test for pyruvate, WT vs. KPC (p=0.0048), lactate, WT vs. KP-/-C (p=0.0003), citrate WT vs. KP-/-C (p=0.0106), WT vs. KPC (p=0.0387), and KP-/-C vs. KPC (p=0.0340), and aspartate WT vs. KP-/-C (p=0.0065) and WT vs. KPC (p=0.0034). n = 3 for each group. Mean +/- SEM is shown. (B–L) The fractional labeling of lactate (B), alanine (C), serine (D), citrate (E), succinate (F), α-ketoglutarate (αKG) (G), fumarate (M+3 WT vs. KP-/-C p=0.0252, WT vs. KPC p=0.0224) (H), malate (I), aspartate (M+2 p=0.0338, M+3 p=0.0044) (J), glutamate (M+3 p=0.0325) (K), and proline (M+3 p=0.0355) (L) in plasma in WT mice (black), KP-/-C mice (dark blue), or KPC mice (light blue) following a 6 hr U-13C-glucose infusion at a rate of 0.4 mg/min. Significance was based on unpaired, Students t-test. n = 3 for each group. Mean +/- SEM is shown.
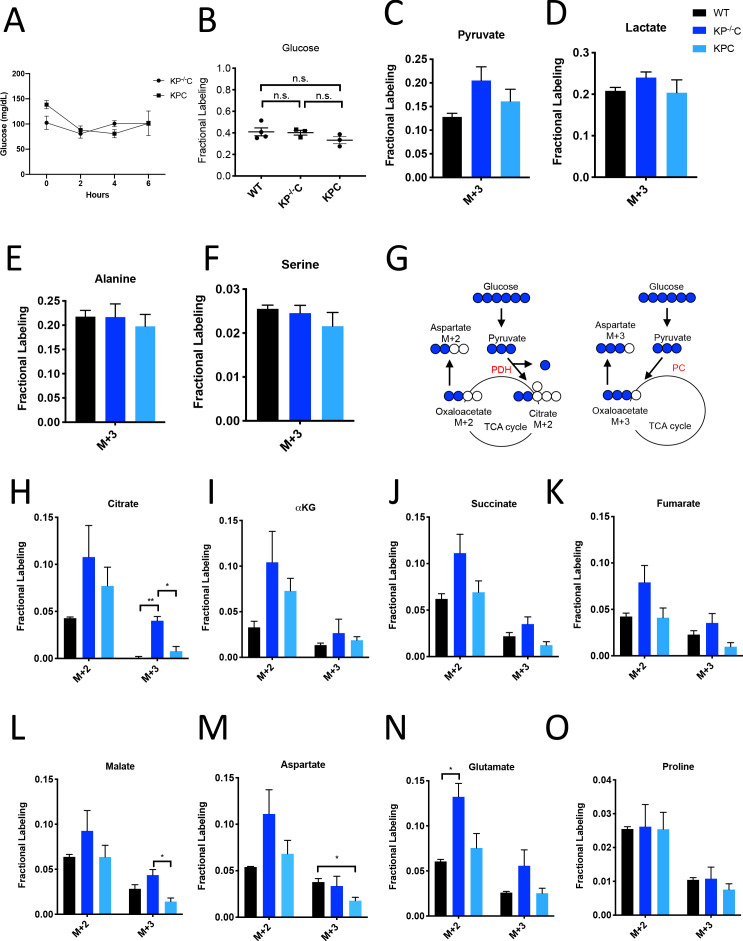
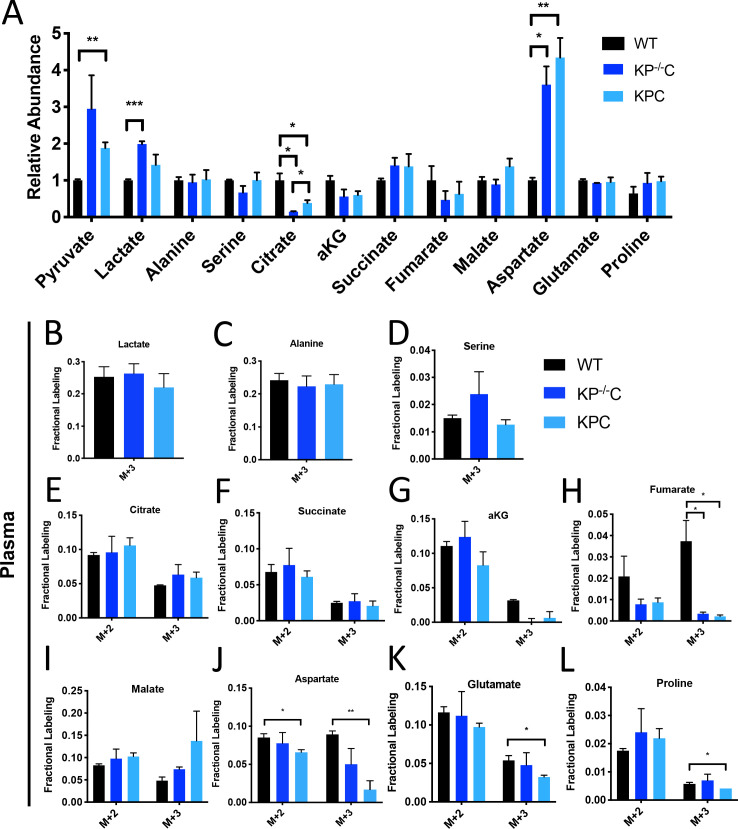
Figure 1—figure supplement 1—source data 1. Tumor metabolite abundance and plasma isotope labeling in U-13C- glucose-infused mice with autochthonous PDAC tumors presented in Figure 1—figure supplement 1.
Figure 1—figure supplement 2. Glucose metabolism in autochthonous PDAC tumors infused with U-13C- glucose at 30 mg/kg/min.

Figure 1—figure supplement 2.

(A) Enrichment of fully labeled glucose (M+6) in plasma from the indicated mice following a 4 hr U-13C-glucose infusion at a rate of 30 mg/kg/min. Non-tumor bearing C57Bl6/J (WT) mice were used to assess metabolite labeling in normal pancreas. WT, n = 3; KP-/-C, n = 4. Differences in plasma glucose enrichment were not significant between WT and KP-/-C tumor-bearing mice (p=0.7600) based on an unpaired student’s t test. Mean +/- SEM is shown. (B) Plasma glucose levels over time in tumor-bearing KP-/-C mice infused with U-13C-glucose at a rate of 30 mg/kg/min. n = 4. Mean +/- SEM is shown. (C–N) The fractional labeling of pyruvate (C), lactate (D), alanine (E), serine (F), citrate (M+2 p=0.0008, M+3 p=0.0155) (G), α-ketoglutarate (αKG) (M+2 p=0.0038, M+3 p=0.0398) (H), succinate (M+2 p=0.0098, M+3 p=0.0334) (I), fumarate (M+2 p=0.0018, M+3 p=0.0138) (J), malate (M+2 p=0.0208) (K), aspartate (M+2 p=0.0097) (L), glutamate (M+2 p=0.0058, M+3 p=0.0115) (M), and proline (N) in WT normal pancreas (black) and autochthonous pancreatic tumors (grey) from LSL-KrasG12D/+; Trp53fl/fl ; Pdx1-Cre (KP-/-C) mice following a 4 hr U-13C-glucose infusion at a rate of 30 mg/kg/min. Non-tumor bearing C57Bl6/J (WT) mice were used to assess metabolite labeling in normal pancreas. The M+2 and M+3 isotopomers are shown for each metabolite: pancreas, n = 3; tumor, n = 4. Significance was based on unpaired, Students t-test. Mean +/- SEM is shown. (O) Relative abundance of tumor metabolites in WT normal pancreas (black) and autochthonous pancreatic tumors (grey) from LSL-KrasG12D/+; Trp53fl/fl; Pdx1-Cre (KP-/-C) mice following a 4 hr U-13C-glucose infusion at a rate of 30 mg/kg/min. Total ion counts were first normalized to tissue weight and norvaline abundance as an internal control, and then WT pancreas values were set to 1. Differences were significant based on unpaired, Students t-test for aspartate (p=0.0171). pancreas, n = 3; tumor, n = 4. Mean +/- SEM is shown.
Figure 1—figure supplement 2—source data 1. Isotope labeling of tumors in U-13C- glucose-infused mice with autochthonous PDAC tumors presented in Figure 1—figure supplement 2.
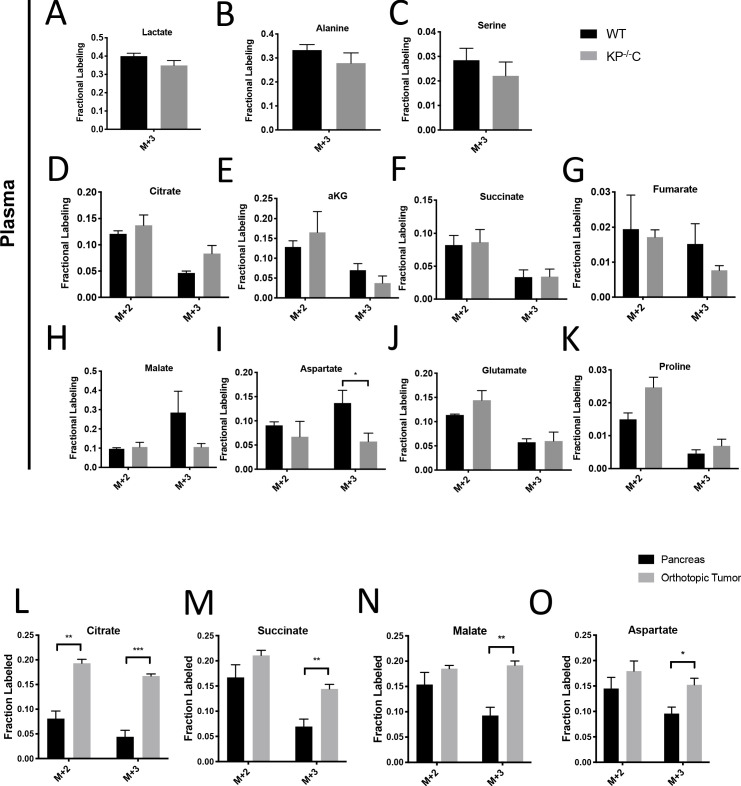
Figure 1—figure supplement 3. Glucose metabolism in autochthonous and orthotopic PDAC tumors infused with U-13C-glucose at 30 mg/kg/min.

Figure 1—figure supplement 3.

(A–K) The fractional labeling of lactate (A), alanine (B), serine (C), citrate (D), succinate (E), α-ketoglutarate (αKG) (F), fumarate (G), malate (H), aspartate (M+3 p=0.0458) (I), glutamate (J), and proline (K) in plasma in WT mice (black), KP-/-C mice (dark blue), or KPC mice (light blue) following a 4 hr U-13C-glucose infusion at a rate of 30 mg/kg/min. Significance was based on unpaired, Students t-test. pancreas, n = 3; tumor, n = 4. Mean +/- SEM is shown. (L–O) The fractional labeling of citrate (M+2 p=0.0006, M+3 p=0.0001) (L), succinate (M+3 p=0.0049) (M), malate (M+3 p=0.0017) (N), and aspartate (M+3 p=0.0204) (O) in adjacent normal pancreas (black) or orthotopically transplanted pancreatic tumors (grey) from the same mice following a 4 hr U-13C-glucose infusion at a rate of 30 mg/kg/min. Significance was based on unpaired, Students t-test. The M+2 and M+3 isotopomers are shown for each metabolite: n = 4 for each group. Mean +/- SEM is shown.
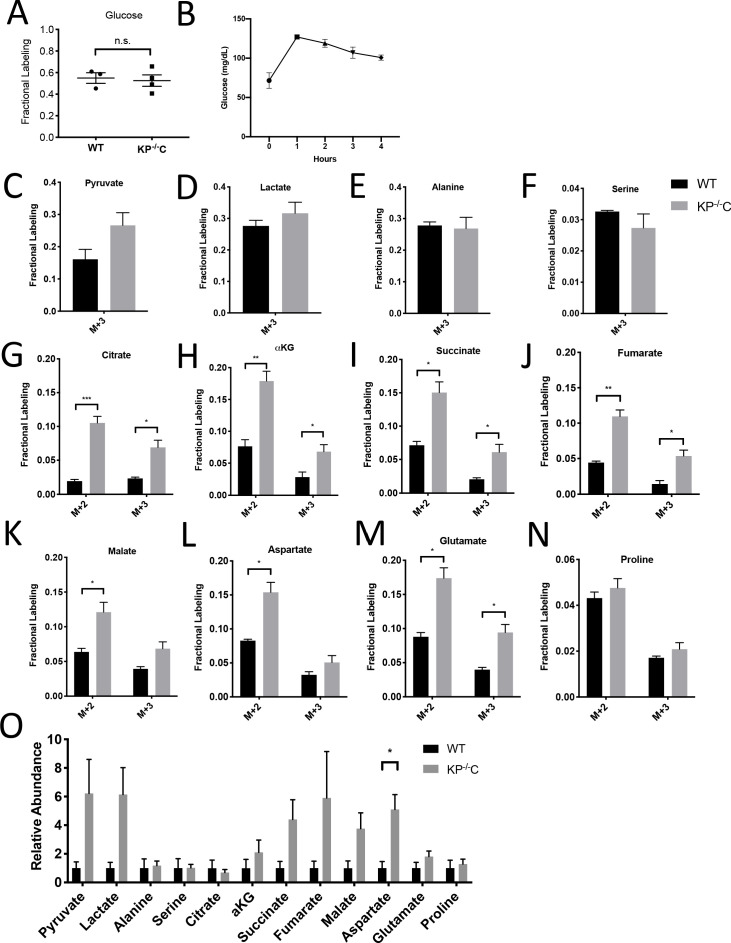
Figure 1—figure supplement 3—source data 1. Plasma isotope labeling in 13C- glucose-infused mice with autochthonous PDAC tumors and metabolite isotope labeling in orthotopic PDAC tumors presented in Figure 1—figure supplement 3.