

Formation of solid-phase protein aggregates in mitochondria is associated with mitochondrial lipid metabolism.
Abstract
Proteostasis declines with age, characterized by the accumulation of unfolded or damaged proteins. Recent studies suggest that proteins constituting pathological inclusions in neurodegenerative diseases also enter and accumulate in mitochondria. How unfolded proteins are managed within mitochondria remains unclear. Here, we found that excessive unfolded proteins in the mitochondrial matrix of yeast cells are consolidated into solid-phase inclusions, which we term deposits of unfolded mitochondrial proteins (DUMP). Formation of DUMP occurs in mitochondria near endoplasmic reticulum–mitochondria contact sites and is regulated by mitochondrial proteins controlling the production of cytidine 5′-diphosphate–diacylglycerol. DUMP formation is age dependent but accelerated by exogenous unfolded proteins. Many enzymes of the tricarboxylic acid cycle were enriched in DUMP. During yeast cell division, DUMP formation is necessary for asymmetric inheritance of damaged mitochondrial proteins between mother and daughter cells. We provide evidence that DUMP-like structures may be induced by excessive unfolded proteins in human cells.
INTRODUCTION
Mitochondrial dysfunction is a hallmark of aging and age-related diseases (1, 2), such as Parkinson’s and Alzheimer’s disease (3). The accumulation of damaged mitochondrial proteins is a common feature in both the free radical (4) and the mitochondrial DNA (mtDNA) mutation theories of aging (5, 6) and is supported by recent evidence that disruption or enhancement of mitochondrial proteostasis accelerates (7) or delays aging (8, 9), respectively. Mitochondria also assist in cellular proteostasis through the import and degradation of unfolded cytosolic proteins (10, 11). Recent studies have reported that many neurodegenerative disease (ND)–related, aggregation-prone proteins accumulate in mitochondria and cause mitochondrial dysfunction (12–14). Although much is known about the processing of mis- or unfolded proteins in the cytosol or nucleus (15–20), it remains unclear how unfolded proteins are organized within mitochondria and how they affect mitochondrial functions during the aging process.
RESULTS
As mitochondrial components are highly conserved across eukaryotes (1), to gain insights into the above question, we took advantage of the stereotypic aging pattern of the budding yeast Saccharomyces cerevisiae’s replicative life, whereby a mother cell of various replicative age gives birth to a daughter cell with newborn-like replicative potential (21, 22). To monitor mitochondrial proteostasis, we labeled the endogenous Hsp78, a protein disaggregase in the mitochondrial matrix (23), with green fluorescent protein (GFP), as it was shown that its cytosolic counterpart, Hsp104, marks inclusions of misfolded proteins in the cytosol (24–26). Approximately 25% of log-phase cells formed one or two Hsp78-GFP puncta per cell in mitochondria (Fig. 1A and fig. S1A). During replicative aging, the percentage of cells having mitochondrial protein aggregates rapidly increased, reaching 100% after five cell divisions (fig. S1B), a replicative age preceding mitochondrial fragmentation (~8 cell divisions) and roughly concurrent with the loss of vacuole acidity (27). To confirm that the Hsp78 puncta were aggregates of unfolded proteins, we targeted a structurally unstable protein, FlucSM (28) linked with mCherry, into the mitochondrial matrix using a mitochondrial matrix targeting sequence (MTS) (29). Unlike MTS-mCherry (mitoCherry), which distributed evenly along mitochondria, MTS-FlucSM-mCherry (mitoFluc) formed puncta in mitochondria that colocalized with Hsp78 (Fig. 1, B to D, and movie S1). In mitoFluc-expressing cells, Hsp78 puncta can be found in all log-phase cells, suggesting that excessive unfolded proteins accelerated protein aggregation in mitochondria (Fig. 1D).
Fig. 1. Mitochondria organize unfolded proteins into solid inclusions at DUMP sites.
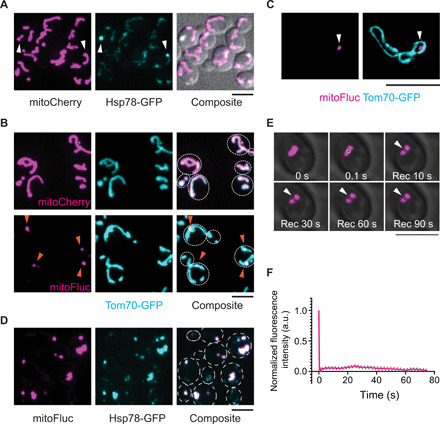
(A) Representative images of log-phase yeast cells expressing mitoCherry and the marker for mitochondrial protein aggregates, Hsp78, labeled with GFP at the endogenous locus. Arrowheads point to Hsp78-labeled aggregates. (B) Representative images of live cells that express mitoCherry or mitoFluc. Whole mitochondria were labeled with endogenous Tom70 C-terminally tagged with GFP. Arrowheads point to mitoFluc puncta. (C) Structured illumination microscopy images of mitochondrial outer membrane (MOM) labeled with Tom70-GFP and matrix mitoFluc labeled with mCherry. Arrowheads point to a mitoFluc punctum inside mitochondria. (D) Representative confocal images of colocalization of mitoFluc with Hsp78-GFP. (E and F) Representative montage (E) and quantification (F) of FRAP of DUMP labeled by mitoFluc in yeast mitochondria. Shown are means and SEM of the boxed region normalized to the prebleach intensity (n = 40). White box indicates the bleached region and arrowheads track the bleached region. Scale bars, 5 μm [(A), (B), (D), and (E)] and 2.5 μm (C). a.u., arbitrary units.
MitoFluc puncta were resistant to dilution in detergent-containing buffer in vitro (fig. S1C), resembling features of solid-phase protein condensates. Ultracentrifugation of detergent-treated lysates showed that mitoFluc was in the pellet fraction, whereas solubilized Tom70 and mitoCherry were in the supernatant, further confirming that mitoFluc formed solid structures (fig. S1D). In vivo, mitoFluc puncta were stable for the duration of up to 5 hours of observation in cells where protein synthesis was inhibited by treatment with cycloheximide (fig. S1E), indicating a lack of turnover. Consistent with these being solid-phase condensates, fluorescence recovery after photobleaching (FRAP) analysis of mitoFluc puncta in live cells also showed limited component diffusion within these structures (Fig. 1, E and F, and movie S2) (30). Thus, we termed these stable structures that consolidate mitochondrial unfolded proteins Deposits of Unfolded Mitochondrial Proteins (DUMP).
By labeling various organelles in mitoFluc-expressing yeast cells, we found that DUMP-containing mitochondria were associated with endoplasmic reticulum (ER) (fig. S2A). ER and mitochondria interact in part through the ER-mitochondria encounter structures (ERMES) in budding yeast (31). Time-lapse movies showed that DUMP associated dynamically with a subset of ERMES marked by Mdm34-GFP (Fig. 2, A and B; fig. S2, B and C; and movie S3). Using a β-estradiol–inducible system (32) for acute mitoFluc expression, we found that DUMP form near ERMES (Fig. 2C). To examine the role of ERMES in DUMP formation, we applied the auxin-induced degradation (AID) system (33) to acutely degrade Mdm12, a nonmembrane component of ERMES. After auxin induction, Mdm12 was acutely degraded and mitochondrial morphology changed from tubular to spherical (fig. S2, D and E), a known effect of ERMES disruption (34). When mitoFluc was induced with β-estradiol before ERMES disruption with auxin addition, DUMP persisted as solid structures in mitochondria, as shown by FLIP (fluorescence loss in photobleaching) in live cells and detergent resistance in vitro after isolation (Fig. 2D; fig. S2, F to H; and movie S4). In contrast, when ERMES were disrupted before mitoFluc induction, mitoFluc remained diffusive within the round mitochondria (Fig. 2D; fig. S2, G and H; and movie S5). In live cells, mitoFluc-containing mitochondria were deformed when passing through the bud neck, suggesting that mitoFluc was not organized as a solid DUMP (fig. S2I) (30). A lack of solid-phase condensation was further confirmed by sucrose-gradient fractionation of detergent-solubilized cell lysates: The majority of mitoFluc from cells with intact ERMES was in the heaviest fraction, whereas that from ERMES-disrupted cells was in the lightest fraction (Fig. 2E and fig. S2, J and K). These data show that ERMES is essential for the formation but not maintenance of DUMP.
Fig. 2. Disruption of ERMES blocks DUMP formation.
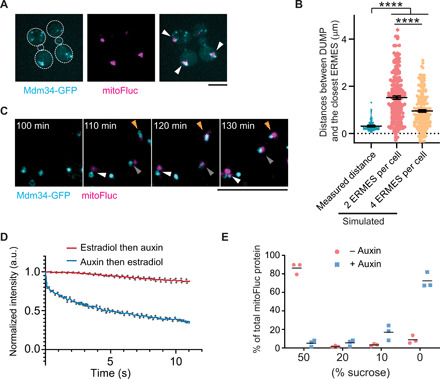
(A) Representative images of cells expressing mitoFluc (middle) and the endogenous Mdm34 tagged with GFP (left). Arrowheads point to DUMP. (B) Measured and simulated distances between DUMP and the closest ERMES structure. Measured distances were from 203 DUMP and ERMES pairs of three biological repeats. Simulated distances were based on random distribution of 1 DUMP and 2 or 4 ERMES in each cell (n = 203 simulations). Means and SEM are shown. Each two conditions were compared with Mann-Whitney U test, ****P < 0.0001. (C) Montage of time-lapse imaging after induction of mitoFluc expression in cells where endogenous Mdm34 was tagged with GFP. Arrowheads point to newly formed DUMP. Arrowheads with the same color track the same DUMP overtime. (D) Quantification of FLIP in cells that expressed β-estradiol–inducible mitoFluc and AID-tagged Mdm12. Log-phase cells were either induced for expression of mitoFluc with β-estradiol followed by auxin addition to remove ERMES (β-estradiol then auxin, n = 49) or subjected to the reverse order of treatment (auxin then β-estradiol, n = 86). The mean intensity of mitoFluc from the nonphotobleached region of the same DUMP subjected to photobleaching was quantified and normalized to the prebleach level. Means ± SEM are shown. (E) Quantification of immunoblots from sucrose gradient fractionation to determine the aggregation of mitoFluc in cells with intact or acutely disrupted ERMES. Bar indicates mean from three biological repeats. In cells with intact ERMES (−auxin), the majority of mitoFluc was present in the 50% sucrose fraction.
ERMES mutants are known to have defects in mitochondrial import (35). To determine whether the lack of consolidation of mitoFluc in acutely ERMES-disrupted cells was due to reduced levels of mitoFluc compared to ERMES-intact cells, we quantified the mean intensity of mitoFluc after its induction under both conditions. The mean intensity of mitoFluc in ERMES-disrupted cells was indeed lower than that in ERMES-intact cells within the same period of induction (fig. S3, A and B). However, after 3 hours of induction, the mean intensity of mitoFluc in ERMES-disrupted cells was higher than that of ERMES-intact cells after 2 hours of mitoFluc induction—a concentration sufficient for DUMP formation (fig. S3, A and B). Moreover, mutations of mitochondrial proteins such as Δpim1 and Δmsd1 also significantly reduced the level of imported mitoFluc, but DUMP formation was not blocked (fig. S3, C and D). These data suggest that the lack of DUMP formation in ERMES-disrupted cells was not caused by insufficient concentration of imported mitoFluc.
ERMES plays multiple roles in mitochondrial function and dynamics, including mtDNA replication, mitochondrial fission, maintenance of tubular morphology, and ER-mitochondria lipid transfer (36). mtDNA is unlikely to be involved in DUMP formation as the latter was unaffected in rho0 cells that lack mtDNA (fig. S3E). In addition, while DUMP did not form after acute ERMES disruption, mtDNA was still present (fig. S3F). Mitochondrial fission is also unlikely to be important for DUMP formation because Δdnm1 mutant cells defective in mitochondria fission also formed DUMP (fig. S3G). The change in mitochondrial shape after ERMES disruption was also unlikely to be involved, because mitochondria also lost the tubular shape in latrunculin A–treated cells, but DUMP formation was unaffected (fig. S3, H to J, and movie S6). Last, we evaluated ERMES’ role in lipid transfer in DUMP formation. Among tested deletions of genes involved in transferring different lipids between mitochondria and ER, Δups1 blocked DUMP formation (Fig. 3A, fig. S4A, and movies S7 and S8). Ups1 is required for transferring phosphatidic acid (PA) from the mitochondrial outer membrane (MOM) to the inner membrane to be used for cardiolipin (CL) production (37). Δups2 mutation was known to rescue the CL biogenesis defect of Δups1 (38), and it also rescued DUMP formation with or without mitoFluc in Δups1 cells (fig. S4, B to E; Hsp78-GFP was used to label DUMP without mitoFluc). Thus, the lipid transfer function of ERMES may be particularly important for DUMP formation.
Fig. 3. Regulation of DUMP formation by enzymes in the CL synthetic pathway.
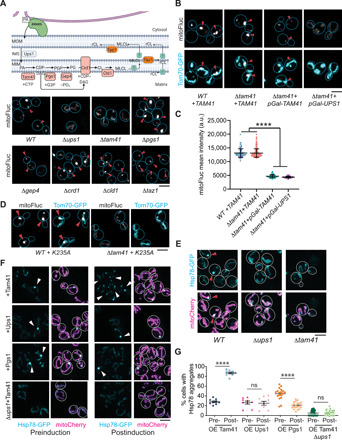
(A) Top, schematic illustration of CL synthetic pathway using PA transferred from ER via ERMES. Bottom, live cell images of mitoFluc in indicated genotypes. Arrowheads point to mitoFluc puncta. (B and C) Representative images (B) and quantification (C) of mitoFluc in cells with genotypes indicated below the panels. TAM41, a copy of TAM41 expressed under the native promoter; pGal-TAM41, TAM41 under the estradiol-inducible Gal promoter; pGal-UPS1, UPS1 under the estradiol-inducible Gal promoter. Arrowheads point to mitoFluc puncta. Means and SD are shown. Mann-Whitney U test comparing two conditions. (D) Representative images of mitoFluc in cells with indicated genotypes. K235A, catalytic inactive mutant tam41K235A. Arrowheads point to mitoFluc puncta. (E) Representative images of cells in which HSP78 was tagged with GFP at the endogenous locus in the genetic background as indicated. Arrowheads point to Hsp78 puncta. (F) Representative images of cells expressing Hsp78-GFP and mitoCherry. The two left columns and the two right columns are before and after induction of overexpression of indicated proteins, respectively. Arrowheads point to Hsp78 puncta. (G) Quantification of percentage of cells with Hsp78-GFP labeled foci in (F). Shown are means ± SEM. Each data point represents one 74 μm by 74 μm image of log-phase cells. Two-tailed Mann-Whitney U test comparing each group of pre- and postinduction. Scale bars, 5 μm. ****P < 0.0001; ns, not significant, P > 0.05.
We next tested mutations affecting each of the known genes involved in CL production and remodeling (Fig. 3A). Deletion of TAM41, which converts PA to cytidine 5′-diphosphate–diacylglycerol (CDP-DAG), also blocked DUMP formation (Fig. 3A), whereas deletion of PGS1, which uses CDP-DAG to synthesize phosphatidylglycerolphosphate, led to formation of bigger DUMP (Fig. 3A and fig. S4F). Both Δgep4 (deletion of a downstream enzyme) and Δtam41 have import defects (39, 40), but DUMP formation was not affected in Δgep4, as confirmed by the detergent resistance of the dim mitoFluc punct isolated from Δgep4 cells in vitro (Fig. 3A and fig. S4G). Deletions of any of the other downstream enzymes also did not affect DUMP formation (Fig. 3A). Introducing a wild-type (WT) copy of TAM41 or acute overexpression of TAM41 rescued DUMP formation in Δtam41 background, although the latter did not recuse the import defect of Δtam41 (Fig. 3, B and C). The rescue of DUMP in Δtam41 cells was not conferred by an enzymatically inactive mutant, tam41K235A (Fig. 3D and fig. S4H) (41). Deletion of TAM41 or UPS1 also blocked endogenous DUMP formation, marked by Hsp78 in cells without mitoFluc expression (Fig. 3E). Moreover, overexpression of TAM41, but not the upstream gene UPS1 or the downstream gene PGS1, markedly increased the percentage of cells containing endogenous DUMP in log-phase cultures (Fig. 3, F and G). This effect was abolished by Δups1, which disrupts upstream PA transfer (Fig. 3, F and G). The native level of Tam41 protein is low (42, 43), and Tam41-GFP tagged at the native locus had a weak signal (fig. S4I). While it was difficult to observe enrichment of Tam41-GFP at ERMES in WT cells, mitoFluc-expressing cells indeed displayed a weak but clear enrichment of Tam41 around DUMP (fig. S4I). These results suggest that DUMP formation is likely to be promoted by the mitochondrial CDP-DAG.
To identify the protein components of DUMP, we purified DUMP in mitoFluc-expressing cells by immunoaffinity chromatography against mitoFluc (fig. S5A) and performed mass spectrometry analysis. Eighty-three mitochondrial proteins were found to be enriched in the pull-down from the mitoFluc-expressing strain compared to the control strain expressing mitoCherry. We did not detect MTS peptides in mitoFluc pull-down by proteomics, suggesting that the MTS was successfully removed from mitoFluc in DUMP. To determine whether the proteomics candidates were enriched in DUMP compared to the rest of the mitochondrial network, 73 of these proteins were tagged with GFP at the genomic loci and imaged (44). First, we confirmed that the mitochondrial matrix–targeted GFP did not aggregate by itself (fig. S5B). Also, as negative controls, proteins in electron transport chain complexes III, IV, and V were excluded from DUMP (fig. S5C). Of the candidate proteins identified by mass spectrometry, 23 showed GFP signal concentrated in DUMP as marked by mitoFluc, whereas the rest showed diffused signal in mitochondria (fig. S5D and table S1). Sixteen of these proteins have known human homologs and are associated with 642 human diseases (table S2) (45). Pathway analysis revealed that the validated components of DUMP were enriched for enzymes of the tricarboxylic acid (TCA) cycle and mitochondrial oxidoreductases (Fig. 4A).
Fig. 4. DUMP contain key components of mitochondrial metabolism.
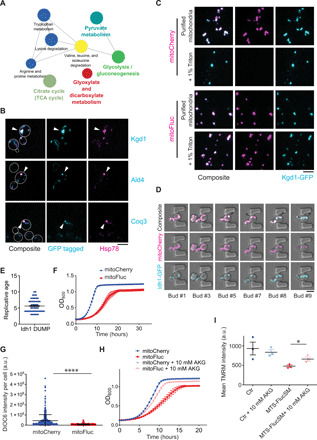
(A) KEGG pathway analysis of DUMP components identified by proteomics analysis and verified by imaging of mitoFluc-bound proteins. Node size indicates significance. P value < 0.001, corrected with Bonferroni. (B) Confocal imaging of log-phase cells expressing mCherry-tagged Hsp78 and indicated proteins tagged with GFP at the genomic loci. Arrowheads point to native DUMP. (C) Detergent-resistance assay. Mitochondria were purified from cells expressing Kgd1 tagged with GFP genomically and with either mitoCherry (top two rows) or mitoFluc (bottom two rows). + 1% Triton, purified mitochondria after treatment with 1% Triton X-100. (D) Montage showing that Idh1 (cyan) gradually formed aggregates during replicative aging. Magenta, mitoCherry. Arrowheads point to Idh1 puncta. (E) The replicative age of cells at which Idh1 formed aggregates in experiments as represented in (D). Means and SEM are shown. (F) Growth curves of WT cells expressing either mitoCherry or mitoFluc. Optical density at 600 nm (OD600) was recorded every 30 min at 30°C. Shown are means and SEM of three biological repeats. (G) Mitochondrial membrane potential measured as total green fluorescence intensity of DiOC6 per cell by imaging. Two-tailed unpaired t test, ****P < 0.0001. Three biological repeats. Shown are means and SD. (H) Growth curves for WT cells expressing either mitoCherry or mitoFluc, with or without the addition of 10 mM α-ketoglutarate (AKG) to the yeast extract, peptone, and dextrose media. Means ± SEM are shown (n = 3). (I) Membrane potential measured by using TMRM from three independent colonies. Each data point is the mean TMRM intensity of more than 10,000 cells. Two-tailed unpaired t test, *P < 0.05. Means ± SEM are shown. Ctr, WT yeast cells; MTS-FlucSM, cells expressing MTS-FlucSM (mitoFluc without the mCherry part). Scale bars, 5 μm.
Five of the 23 proteins, Kgd1, Lpd1, Ald4, Coq3, and Pda1, which were tagged with GFP at the genomic loci, formed puncta in mitochondria even without mitoFluc expression in log-phase cells (fig. S5E), and these puncta colocalized with Hsp78 tagged genomically with mCherry (Fig. 4B). To determine whether these native proteins are stable components of DUMP, we purified mitochondria from Kgd1-GFP cells that also expressed either mitoCherry or mitoFluc. Before detergent treatment, Kgd1-GFP colocalized with mitoCherry in fragmented mitochondria, but after membrane solubilization with detergent, mitoCherry was released while the Kgd1-GFP puncta were not affected (Fig. 4C). Similar results were observed in Lpd1-GFP and mitoCherry-expressing cells (fig. S5F). By contrast, mitoFluc remained concentrated in the puncta that also contained Kgd1 (Fig. 4C). Fractionation of detergent-solubilized lysates of cells expressing Kgd1-GFP on a sucrose gradient confirmed that most Kgd1-GFP was in heavy fractions, likely in aggregated forms (fig. S5G). Similar fractionation of lysate of log-phase cells expressing untagged Kgd1, which was detected by using an antibody (46), also reveals the tendency for Kgd1 to partition in heavier fractions compared to the soluble protein control mitoCherry (fig. S5, H and I). This finding was consistent with our observation that only ~25% of log-phase cells contained visible DUMP in the absence of mitoFluc (Fig. 1A and fig. S1A) but suggests that GFP tagging could enhance the aggregation of Kgd1. The other 18 of the 23 proteins showed prominent localization to DUMP only in the presence of mitoFluc (fig. S5D). By tracking aging cells using microfluidics, we observed that DUMP formation for one of these proteins, Idh1, occurred in an age-dependent manner in the absence of mitoFluc (Fig. 4D), and the mean replicative cycle for Idh1 DUMP was 5 (Fig. 4E), coinciding with native DUMP formation as detected by using Hsp78 (fig. S1B). As expected, in mitoFluc-expressing cells, the aggregation of Idh1 was accelerated by and colocalized with mitoFluc in the majority of the log-phase population (fig. S5D).
The above results suggest that excessive unfolded proteins in mitochondria enhance aggregation of TCA enzymes. Consistent with this, the activity of α-ketoglutarate (AKG) dehydrogenase, the enzymatic activity of Kgd1, was significantly reduced in mitoFluc-expressing cells, compared to the control mitoCherry-expressing cells (fig. S6, A and B). MitoFluc-expression also inhibited growth, reduced mitochondrial membrane potential, and enhanced mtDNA loss in yeast cells (Fig. 4, F and G, and fig. S6, C to F). The toxic effects of mitoFluc were not simply a result of overexpression as the steady-state levels of mitoCherry were higher than those of mitoFluc (fig. S6G). To test whether the defects caused by mitoFluc may be rescued by enhancing the metabolic flux of the TCA cycle, we supplemented mitoFluc-expressing yeast cells with AKG, the product of Idh1. Addition of AKG partially rescued both the membrane potential and growth defects in mitoFluc-expressing cells (Fig. 4, H and I), but DUMP formation was not affected (fig. S6, H and I), supporting the possibility that AKG rescued downstream effects of DUMP.
The mitochondrial defects caused by mitoFluc mirror various aspects of mitochondrial dysfunction observed during aging and in age-related diseases (47). MitoFluc-expressing yeast cells exhibited premature aging and reduced replicative life span (RLS) (Fig. 5A). Mitochondria that harbored DUMP did not colocalize with mitophagy markers under fermentable or nonfermentable conditions and were not cleared under the latter where mitophagy is known to be highly active (fig. S7A and movie S9) (48). Using a microfluidic device to observe repeated budding cycles of single mother cells (49), we found that DUMP were asymmetrically retained in mother cells through most of the RLS (Fig. 5B and movie S10). To quantify the asymmetric inheritance of DUMP, we used an inducible promoter to acutely express mitoFluc (fig. S7B). In WT cells, full leakage of DUMP into the bud occurred in only 10% of mother cells (Fig. 5C and fig. S7C). However, in ERMES mutants (Δmmm1 and Δmdm34) where misfolded proteins do not condense into DUMP, more than 40% of cells showed leakage of mitoFluc from the mother into the bud (Fig. 5C, fig. S7C, and movies S11 to S13). Furthermore, in Δups1 and Δtam41, where DUMP could not form but the mitochondrial shape remained tubular, there was no asymmetry of mitoFluc distribution between the mother and the bud (Fig. 3A and fig. S7D), as expected. These data suggest that DUMP formation is required for asymmetric inheritance of unfolded mitochondrial proteins during cell division. To determine how asymmetric inheritance of DUMP was achieved, we assessed two known mechanisms for mitochondrial retention in the yeast mother cell: one mediated by mitochondria-ER-cortex-anchor (MECA) (50) and one by the F-box protein Mfb1 (51, 52). Δmfb1 resulted in a loss of the asymmetry in DUMP inheritance whereas Δnum1, disrupting MECA, had no effect (Fig. 5, D and E; fig. S7, E and F; and movies S14 to S16). Moreover, overexpression of Mfb1 enhanced the fidelity of asymmetric retention of DUMP in mother cells (Fig. 5E). These data suggest that the asymmetric inheritance of DUMP is a regulated process dependent on Mfb1, the mechanism of which will be of interest for future investigation.
Fig. 5. DUMP facilitates asymmetric inheritance of unfolded mitochondrial proteins.
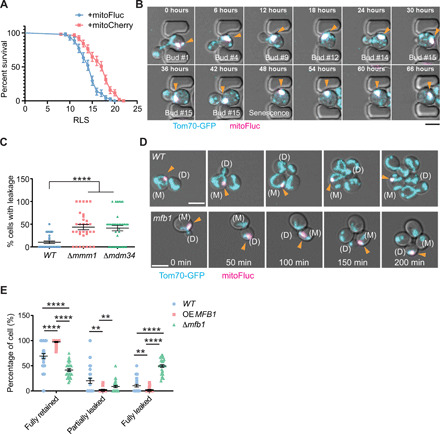
(A) RLS of mitoCherry and mitoFluc-expressing cells measured by using a microfluidic device. Curves show mean survival percentages and SEM. P < 0.0001, both Mantel-Cox test and Gehan-Breslow-Wilcoxon test. n = 44 for mitoFluc and 51 for mitoCherry. (B) Time-lapse confocal imaging of single yeast cells expressing mitofluc undergoing replicative aging using a microfluidic device. Mitochondria were labeled with Tom70-GFP. During asymmetric cell division, mitoFluc puncta were retained in the mother cell. See movie S10. Arrowheads point to DUMP. (C) Quantification of cells in which full mitoFluc DUMP was leaked into the daughter cell from the mother cell. Tukey’s multiple comparisons test. ****P < 0.0001. Means ± SEM are shown. Each dot represents the percentage of cells that passed their entire DUMP from mother to the daughter cells from a movie. Three biological repeats. (D) Time-lapse live cell confocal imaging of inducible mitoFluc in WT (top) and Δmfb1 mutant (bottom). Mitochondria were labeled by tagging Tom70 genomically with GFP. See movies S15 and S16. Arrowheads point to DUMP. (M), mother cell. (D), daughter cell. Three biological repeats. (E) Quantification of DUMP inheritance in indicated genotypes by live cell movies of three biological repeats. Means ± SEM are shown. **P < 0.01; ****P < 0.0001. Scale bars, 5 μm.
Stable, DUMP-like structures were also observed in human embryonic kidney (HEK) 293T cells and RPE1 cells expressing mitoFluc (Fig. 6, A and B, and fig. S8A). Using a MOM marker (53), we confirmed that mitoFluc was inside of mitochondria (fig. S8B; note that expression of the MOM marker and/or mitoFluc may cause mitochondria to fragment to spherical bodies, in which mitoFluc could be more easily seen engulfed inside the mitochondrial membrane). The majority of mitoFluc was sedimented in detergent-containing buffers after ultracentrifugation, demonstrating its insolubility (Fig. 6C). FRAP of mitoFluc puncta in HEK293T cells also confirmed that these puncta were solid structures (Fig. 6D and movie S17). These results suggest that mammalian mitochondria may also organize unfolded proteins into solid inclusions, although much remains to be determined about the native conditions under which DUMP form in mammalian cells. To investigate the role of the human homolog of Tam41, TAMM41, in DUMP formation, we used a lentivirus-based, Tet-on–inducible CRISPR construct to acutely knock out the gene TAMM41 in the HEK293T cell line upon addition of doxycycline (fig. S8, C to E). Disruption of TAMM41 significantly reduced DUMP formation as visualized by using mitoFluc, and this was rescued by expression of TAMM41 cDNA (Fig. 6, E and F, and fig. S8F). Conversely, overexpression of the downstream enzyme PGS1, but not the upstream enzyme PRELID1 (homolog of yeast Ups1), markedly reduced DUMP formation in HEK293T cells (Fig. 6, E and F, and fig. S8F). Further experiments will be required to rule out other effects of these genetic manipulations on mitochondrial integrity that could contribute to the observed phenotypes.
Fig. 6. DUMP-like structures in human cells.
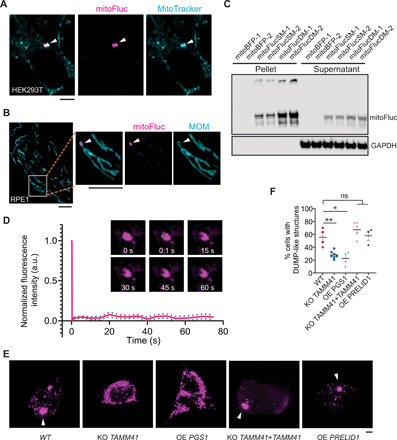
(A) Live confocal imaging of HEK293T cells expressing mitoFluc stained with mitoTracker. Arrowheads point to mitoFluc puncta. More examples in fig. S8A. (B) RPE1 cells expressing mitoFluc and MOM marker. Arrowheads point to mitoFluc puncta. (C) Immunoblots of lysates, fractionated by ultracentrifugation, from HEK293 cells transfected with mitoBFP, mitoFluc single mutant (SM), or double mutants (DM) (28). -1 and -2 represent two biological repeats shown of a total of three biological repeats. Glyceraldehyde-3-phosphate dehydrogenase (GAPDH): loading control. (D) Quantification of fluorescence recovery and representative montage of FRAP of DUMP-like structures formed with mitoFluc in HEK293T cells. Shown are means and SEM of fluorescence of the boxed region normalized to the prebleach intensity (n = 40). White box indicates the bleached region. (E) Representative images of transfected mitoFluc in HEK293T cells with the indicated genotypes. Arrowheads point to DUMP-like structures formed with mitoFluc. (F) Quantification of the percentage of cells that exhibited DUMP-like structures after mitoFluc transfection in the experiment in (E). MitoFluc signal was segmented and its SD of mean intensity within a cell was calculated. Higher SD represents more punctate distribution of mitoFluc. Cells with SD > 3000 were classified as DUMP-like structures containing cells. Shown are means ± SEM. Each data point represents one biological repeat. Two-tailed Mann-Whitney U test, comparing WT with each condition individually. Scale bars, 5 μm. **P < 0.01; *P < 0.05.
DISCUSSION AND CONCLUSION
The data described above shed light on how mitochondria manage unfolded or damaged proteins during aging, in addition to degradation or chaperone-assisted refolding. Excessive unfolded proteins form solid inclusions referred to as DUMP. Our data from experiments disrupting or overexpressing upstream or downstream enzymes consistently support the idea that DUMP formation is promoted by CDP-DAG. However, due to the exceedingly low abundance of this lipid in the mitochondrial matrix (54), we currently do not have direct evidence of a role for this lipid in mitochondrial protein aggregation. Future study may also differentiate whether CDP-DAG is directly involved in seeding the aggregation or indirectly involved by providing an environment that promotes the aggregation of unfolded proteins in mitochondria. We note that a recent study reported mitochondria-targeted GFP-DHFRds formed puncta, named intramitochondrial protein quality control compartment (IMiQ), which are stored at the nucleus but not at the mitochondrial network (55). As DUMP exist exclusively in mitochondria, they are likely to be distinct from IMiQ.
Our proteomics experiments revealed that native components of DUMP are enriched for TCA cycle enzymes and oxidoreductases. Since many of these proteins perform their enzymatic functions in a highly oxidizing environment, damage accumulated within the polypeptides could drive their aggregation during aging. Our observation also suggests that a heightened proteostasis burden, i.e., an increased level of unfolded proteins in mitochondria, could also promote the aggregation of TCA cycle proteins, which may accelerate metabolic dysfunction. Recent evidence suggests that mitochondrial quality is a key determinant of cellular replicative potential, as newer or fitter mitochondria are preferentially partitioned into the progeny cell with higher stemness in human mammary stem-like cell divisions (56) or the daughter cell of yeast with a renewed replicative potential (57). DUMP formation allows the mother yeast cell to retain mitochondrial proteome damage while sparing the newborn bud. Thus, instead of eliminating damaged mitochondria through mitophagy, DUMP represent a mechanism that consolidates damaged proteins to a small number of mitochondria, leading to their eventual elimination from the population through asymmetric cell division. It is conceivable that ND-related, aggregation-prone proteins that enter mitochondria also promote DUMP formation and aggregation of metabolic enzymes such as the components of the TCA cycle. TCA cycle defects are observed in several NDs (58–60). The stability of DUMP and the lack of destruction of DUMP-containing mitochondria by mitophagy may impose persistent damage in nondividing cells. Thus, DUMP may be a case of antagonistic pleiotropy that can be either protective or detrimental in different developmental contexts or stages of aging. Modulation of the enzymes that control CDP-DAG abundance could tune DUMP formation and potentially be exploited for anti-aging or the prevention of age-related diseases.
MATERIALS AND METHODS
Yeast strains
Yeast strains used in this study are based on the BY4741 strain background (MATa his3Δ1 leu2Δ0 met15Δ0 ura3Δ0), and the genotypes of the strains used in this study are listed in table S3. Gene deletion and fluorescent protein tagging were performed with polymerase chain reaction (PCR)–mediated homologous recombination and verified by PCR genotyping. Proteomics hits were verified with strains from the yeast GFP library (44) by introducing pGAP-MTS-FlucSM-mCherry into the TRP1 locus. Knockout (KO) strains were made using PCR-mediated homologous recombination or picked from the Yeast KO Collection (61). Δtam41 and Δpgs1 were made by PCR-mediated homologous recombination with PCR products containing the KO cassette from Δtam41 and Δpgs1 strains of the Claypool laboratory. Cells were grown in yeast extract, peptone, and dextrose (YPD) for biochemistry assays and growth assays, in synthetic complete (SC) medium for imaging at 30°C. The respective media contained either 2% glucose (YPD, SC-complete), 2% galactose (YPGal, SC-glucose + Gal), 2% glycerol [Yeast extract–Peptone–Glycerol (YPG)], or 2% raffinose (SC-glucose + Raf). Optical density at 600 nm (OD600) was used to estimate the amount of yeast cells used in the various experiments.
Plasmids
Plasmids used in this study are listed in the “Plasmid” section of table S3 “List of strains and plasmids.” Molecular cloning was performed either by T4 DNA ligase (NEB, no. M0202)–based DNA ligation or by the Gibson Assembly (62). Q5 High-Fidelity DNA Polymerase (NEB, no. M0491) was applied for PCR reactions. pGAP-MTS-mCherry plasmid was constructed by replacing the HcRed in the p404-pGAP-MTS-HcRed-NatMax (16) with mCherry. pGAP-MTS-FlucSM-mCherry was constructed by inserting the FlucSM provided by F.-U. Hartl (28) into pGAP-MTS-mCherry at Bam HI and Nco I cutting sites. The plasmids p404-Cyc-mCherry-Fis1TM and GFP-ATG8 were described previously (16, 63). The GAP promoter in pGAP-MTS-FlucSM-mCherry was replaced with pGAL1 by Gibson Assembly. β-Estradiol–inducible pGal-MTS-FlucSM-mCherry of a fusion protein consisting of a GAL DNA binding domain, β-estradiol–binding domain, and Msn2 activation domain system was constructed by replacing GFP in pJW1663 (32) with pGal-MTS-FlucSM-mCherry. Mdm12 was tagged with AID tag using plasmid pJW1662 (32). MOM marker for human cells was described previously (53). Mammalian version of mitoFluc was constructed by using MTS-FlucSM-mCherry to replace the DsRed in pDsRed-Monomer-Hyg-N1 vector. mitoBFP was a gift from the Nunnari laboratory (64). LentiCRISPR KO TAMM41 was made by cutting TLCV2 with Bsm BI and Gibson Assembly the vector with guide RNA of TAMM41 (tatatatcttgtggaaaggacgaaacaccgGACCGGCAATCTCTATGAAGgttttagagctagaaatagcaagttaaaat) (65). Plasmids expressing cDNA of TAMM41, PGS1, and PRELID1 under EF-1α promoter were cloned using reverse transcription PCR with RNA from RPE1 cells. The PGS1 cDNA was a natural variant missing amino acids 112 to 137, and amino acid 287 was mutated from glycine to valine. pBABEpuro GFP-LC3 was a gift from J. Debnath (66).
Antibodies
mCherry (PA5-34974) was obtained from Invitrogen. Glyceraldehyde-3-phosphate dehydrogenase: (CS#5174S) was purchased from Cell Signaling. IDH3B (NBP2-14114) was obtained from Novus Biologicals. PGK1 (459250), TAMM41 (PA5-97027), and ALDH2 (MA5-17029) were purchased from Invitrogen. Kgd1 was a gift from the Claypool laboratory (46).
Confocal microscopy
Live-cell images were acquired using a Yokogawa CSU-10 spinning disc on the side port of a Carl Zeiss 200-m inverted microscope or a Carl Zeiss LSM780 confocal system. Laser 488- or 561-nm excitation was applied to excite GFP or mCherry, respectively, and the emission was collected through the appropriate filters onto a Hamamatsu C9100-13 EMCCD on the spinning disc confocal system or the single-photon avalanche photodiodes on the Zeiss 780 system. For multitrack acquisition, the configuration of alternating excitation was applied to avoid the bleed-through of GFP (for dual-color imaging, GFP or mCherry-labeled controls were applied for laser and exposure settings). The spinning disc and the LSM780 were equipped with a 100× 1.45 numerical aperture (NA) Plan-Apochromat objective and a 63× 1.4 oil Plan-Apochromat objective, respectively. For yeast three-dimensional (3D) imaging, we used a 0.5-μm step size for 6 μm in total in Z; for human cells, we used a 1-μm step size. Images were acquired using MetaMorph (version 7.0; MDS Analytical Technologies) on a CSU-10 spinning disc system and Carl Zeiss ZEN software on the LSM780.
Yeast culture condition for imaging: Yeast cells were cultured in SC or drop-out medium containing 2% dextrose or raffinose medium overnight at 30°C. The cells were then refreshed in the corresponding medium for at least 3 hours at 30°C to an OD600 around 0.1 to 0.25. For 3D time-lapse imaging, cells were laid on an SC-complete agarose gel pad or cultured in a MatTek (P35G-0-14-C) glass bottom dish and were treated with Concanavalin A (MP Biomedicals, catalog no. IC150710.2), to allow long-term imaging at room temperature. Each z series was acquired with a 0.5-μm step size. For the Gal-inducible experiment, cells were grown in SC-glucose media containing 2% raffinose overnight and induced by adding 2% Gal for 6 hours. Gal induction was shut down by adding 2% glucose for 4 hours at 30°C before the time-lapse imaging. For GEM-inducible systems, 1 μM β-estradiol (E2758-1G, Sigma-Aldrich) was added to SC-complete upon induction. For the AID system, 0.5 mM 3-indoleacetic acid (I2886-25G, Sigma-Aldrich) was added upon treatment. For inducing mitochondrial shape change, 100 μM latrunculin A was added to culture for 30 min (confirmed by imaging) before adding β-estradiol for mitoFluc expression. The image processing was performed using the ImageJ software (National Institutes of Health) or the Imaris software. For visualization purposes, some of the images in the figures and the Supplementary movies were scaled with bilinear interpolation and shown as max projection on Z for fluorescent channels.
Super-resolution microscopy
Structured illumination microscopy (SIM) images were acquired with a GE OMX-SR Super-Resolution Microscope 3D Structure Illumination (3D-SIM) equipped with high-sensitivity PCO scientific complementary metal-oxide semiconductor (sCMOS) cameras. The system is equipped with a 60× 1.42 NA UPlanApo oil objective. The z step interval was 125 nm. GFP and mCherry were excited with 488- and 568-nm lasers, respectively. Their emissions were collected with standard GFP and red fluorescent protein filter settings. The SIM images were reconstructed with the Softworx and aligned following the Applied Precision protocols.
Zeiss LSM880-Airyscan FAST Super-Resolution microscopy equipped with 63×/1.4 PlanApo oil was used. Airyscan processing was applied to generate super-resolution images.
FRAP and FLIP
Yeast cells were allowed to adhere on Concanavalin A–coated glass bottom dishes (MatTek). HEK293T cells transfected with mitoFluc were cultured in poly-d-lysine–coated glass bottom dish (MatTek). FRAP and FLIP were performed with LSM780 (Zeiss) or LSM880 (Zeiss). Square regions of the same size were bleached and monitored overtime for fluorescence recovery. For FLIP, the intensity of unbleached region of the same aggregate was quantified. Fluorescence mean intensity was quantified with ImageJ.
Mammalian cell culture, transfection, imaging, and quantification
HEK293T cells (a gift from the Wu laboratory) were cultured in Dulbecco’s modified Eagle’s medium (DMEM; Corning, with l-glutamine and sodium pyruvate) supplemented with 10% fetal bovine serum (Sigma-Aldrich), penicillin (100 IU/ml; Gibco), and streptomycin (100 μg/ml; Gibco). RPE1 cells (American Type Culture Collection CRL4000) were cultured in DMEM/F-12 (HyClone) supplemented with 10% fetal bovine serum (Sigma-Aldrich). The HEK293T Tet-on–inducible CRISPR-Cas9 KO TAMM41 polyclonal cell line was generated using lentivirus. High-titer viruses were produced in 293FT cells as previously described (67). Briefly, 500 ng of psPAX2 packaging plasmid, 50 ng of pMD2.G envelope plasmid, and 500 ng of TLCV2 TAMM41 KO vector were used for the transfection per well in six-well tissue culture plate. Media (2.5 ml) containing lentivirus were harvested after incubation for 24 hours, and 200 μl of lentivirus particles was used for each transduction of 2 × 10⁵ cells in the six-well tissue culture plate. The stable line was selected and maintained in the medium described above supplemented with puromycin (3 and 2 μg/ml, respectively; GIBCO). Doxycycline (1 μg/ml; Sigma-Aldrich) was added to the polyclonal cell line to induce Cas9-T2A-GFP expression. After 24 to 36 hours of induction, cells were transfected with mitoFluc for 36 to 48 hours, followed by cell sorting using Sony cell sort SH800 for GFP and mCherry double-positive cells. Control HEK293T cell line transfected with mitoFluc or mitoFluc plus another gene was also sorted for mCherry-positive cells. Same gating for mCherry was applied to all samples. Sorted cells (10,000 to 20,000) were plated in a poly-d-lysine–coated glass bottom dishes (MatTek). Confocal live cell imaging was performed 24 to 36 hours after sorting using LSM780 or LSM880. Cells were unbiasedly located using bright-field or GFP channel for control HEK293T or Cas9-T2A-GFP TAMM41 KO cells, respectively. Quantification was performed using Imaris (Bitplane). MitoFluc signal was segmented and its SD of mean intensity per cell was calculated. In cells that formed mitoFluc aggregates, the distribution of mean intensity was more uneven; thus, their SD was higher. Cells with SD > 3000 were classified as DUMP-containing. Lipofectamine 3000 (Invitrogen) was used for transient transfections according to the manufacturer’s instruction.
Immunofluorescence
Cells were cultured on poly-d-lysine–coated glass bottom dishes (MatTek). Fixation was performed using BD Phosflow Fix Buffer I (BD 557870) at room temperature for 15 min, followed by 3× phosphate-buffered saline (PBS) washing. Cells were blocked with goat serum 5% in blocking buffer (1× PBS buffer, 0.3% Triton X-100, 0.05% NaN3, and 5% goat serum) at room temperature for 1 hour. Primary antibody incubation was performed at 4°C overnight. After washing with 3× PBS, cells were incubated with fluorescent secondary antibodies and 4′,6-diamidino-2-phenylindole (DAPI) for 1 hour at room temperature in the dark. After washing with PBS, cells were mounted with fluorescence-compatible mounting medium.
Microfluidic devices
As previously described (49), our home-made microfluidic devices were fabricated by adopting a previous design (68). In this case, after plasma bonding, the device was incubated at 65°C overnight instead of 70°C. Approximately 400 cells cultured in SC-complete (Sunrise) were loaded. The initial flow rate was 30 μl/min, and it was reduced to 6 μl/min during imaging. Imaging was performed at room temperature with a Carl Zeiss LSM780 confocal system equipped with a 63× 1.4 NA oil Plan-Apochromat objective. The multiple-position time-lapse imaging was recorded with a 30-min interval, 0.5-μm step size for 6 μm in Z.
Proteomics analysis
Immunoprecipitation and enzyme digestion
Overnight cultured TOM70-GFP-HIS3MX; trp::Su9-FlucSM-mCherry-6xHis-NatMX and control strain TOM70-GFP-HIS3MX; trp::Su9-mCherry-6xHis-NatMX were refreshed in 4.5 liters of YPD for about 3 hours and the final OD600 readings were ~1100. Cells were collected by centrifugation (5000g, 6 min) and then the cells were washed once with ddH2O. The cells were then treated with 10 mM dithiothreitol (DTT) for 5 min (pH 9.3) at 30°C. To get rid of the DTT, cells were then washed with sorbitol buffer (pH 7.5, 1.2 M sorbitol) and followed by 5-min digestion with Zymolyase 100T (0.8 mg/ml) in Zymolyase buffer at 30°C. Samples were washed two times using SEH buffer [0.6 M sorbitol, 20 mM Hepes-KOH (pH 7.4), 2 mM MgCl2, and EDTA-free protease inhibitors (Thermo Fisher Scientific no. 78441); phenylmethylsulfonyl fluoride (PMSF) 1 mM was added before use] and then lysed with a dounce homogenizer (~50 strikes). The homogenates were then centrifuged at 1500g (low speed) for 5 min at 4°C to get rid of large debris and unbroken cells. Supernatants were collected and centrifuged at 12,000g (high speed) for 10 min at 4°C to enrich mitochondria and separate unimported precursor proteins that may affect the results. Purified mitochondria were checked by microscopy. The mitochondrial membranes were broken with nonionic detergent (1% Triton X-100) without breaking the interactions between proteins. The lysates were incubated with HIS affinity magnetic beads [Thermo Fisher Scientific HisPur Ni–nitrilotriacetic acid (NTA) Magnetic Beads] following the manufacturer’s protocols. Beads and samples were mixed on an end-over-end rotator. The beads were collected by placing the tube on a magnetic stand. Supernatants were checked for aggregate reduction by microscopy. The beads were washed five times with washing buffer [PBS, 0.05% Tween 20 detergent, and 50 mM imidazole (pH 8.0)]. Aggregate binding to beads was assessed by imaging and then beads were washed in PBS five times to eliminate detergent. After washing the beads, proteins bound to Ni-NTA beads were reduced with 10 mM DTT (Sigma-Aldrich) at room temperature for 1 hour and alkylated with 30 mM iodoacetamide (Sigma-Aldrich) at room temperature for 30 min in the dark followed by digestion with 0.3 μg of Sequencing Grade trypsin (Promega) in 30 μl of triethylammonium bicarbonate (Sigma-Aldrich) and 2 M urea at 37°C overnight. The peptides were desalted with a C18 StageTip.
Mass spectrometry analysis
The peptides were analyzed on an Orbitrap Fusion Lumos Tribrid Mass Spectrometer coupled with the EASY-nLC 1200 nano-flow liquid chromatography system (Thermo Fisher Scientific). The peptides from each fraction were reconstituted in 15 μl of 0.1% formic acid and loaded on an Acclaim PepMap100 Nano-Trap Column (100 μm by 2 cm; Thermo Fisher Scientific) packed with 5-μm C18 particles at a flow rate of 5 μl/min. Peptides were resolved at a flow rate of 250 nl/min using a linear gradient of 10 to 35% solvent B (0.1% formic acid in 95% acetonitrile) over 95 min on an EASY-Spray column [50 cm by 75 μm inner diameter (ID), Thermo Fisher Scientific] packed with PepMap RSLC C18 and 2-μm C18 particles (Thermo Fisher Scientific), which was fitted with an EASY-Spray ion source operated at a voltage of 2.3 kV.
Mass spectrometry analysis was completed in a data-dependent manner with a full scan in the mass/charge ratio (m/z) range of 350 to 1800 in the “Top Speed” setting, 3 s per cycle. MS1 and MS2 were acquired for the precursor ions and peptide fragmentation ions and measured at a resolution of 120,000 at an m/z of 200. MS2 scan was acquired by fragmenting precursor ions using the higher-energy collisional dissociation (HCD) method and detected at a mass resolution of 30,000, at an m/z of 200. Automatic gain control for MS1 was set to 1 million ions and that for MS2 was set to 0.05 million ions. A maximum ion injection time was set to 50 ms for MS1 and 100 ms for MS2 (HCD was set to 32 with stepped collision energy of 5% for MS2). Precursor isolation window was set to 2 m/z with 0.5 m/z offset. Dynamic exclusion was set to 35 s, and singly charged ions were rejected. Internal calibration was carried out using the lock mass option (m/z 445.1200025) from ambient air.
Data analysis
MaxQuant (v1.5.3.8) software was used for quantitation and identification (69). During tandem mass spectrometry (MS/MS) preprocessing, the top 12 peaks in each window of 100 m/z were selected for database search. The MS/MS data were then searched using Andromeda search algorithms against a S. cerevisiae database (version 82) with common contaminant proteins. Search parameters included (i) trypsin as a proteolytic enzyme with up to two missed cleavages; (ii) first search peptide mass error tolerance of 20 ppm and the main search peptide mass error tolerance of 4 ppm; (iii) fragment mass error tolerance of 20 ppm; (iv) carbamidomethylation of cysteine (+57.02146 Da) as a fixed modification; and (v) oxidation of methionine (+15.99492 Da) and protein acetyl (+ 42.01056 Da) on N terminus as a dynamic modifications. The minimum peptide length was set to six amino acids and the minimum number of peptide sequence per protein was set to one peptide. Peptides and proteins were filtered at 1% false discovery rate. The iBAQ and the Match Between Runs parameters were enabled. Gene Ontology and pathway analysis was performed using ClueGO (http://apps.cytoscape.org/apps/cluego).
Computational modeling of distance between ERMES and DUMP from random distributions
A model yeast cell is represented as a circle with radius R, populated with E nonoverlapping randomly dispersed ERMES Spots each of radius r. Assuming only one DUMP spot of radius d is present per cell, the total area occupied by ERMES spots is Er2π. To determine the probability of a single randomly spawned DUMP spot falling within a distance x of an ERMES spot, the DUMP spot’s center must fall within a radius of r + d + x of any ERMES spot. From thence, the calculated distribution function is the ratio of the effective total ERMES target area versus cytoplasmic area:. The probability distribution for a 3D case can be similarly calculated to be: . Values for r (150 nm) and d (250 nm) are derived from experimental data, while R (3 μm) is taken from the average radius of a yeast cell.
Simulations were executed to estimate the distribution of minimum distance proximity between randomly seeded ERMES spots and a single spawned DUMP spot. Both 2D and 3D environments were simulated. Each simulation consists of a circle or sphere of radius 3 μm representing the cell cytoplasm, and E noncolliding ERMES spots of radius 150 nm randomly seeded into the cell space. A single DUMP spot of radius 250 nm was then spawned into the space, and distances between DUMP and ERMES spots were measured. DUMP spots are permitted to colocalize with ERMES spots, and the minimum distance among all ERMES-DUMP pairs is recorded per simulation. A range of 1 to 32 ERMES spots was tested, with 10k simulations run per condition. Simulation output was verified by visual rendering of the physical simulation space (code is available in git repo).
Membrane potential measurements
3,3′-Dihexyloxacarbocyanine iodide (DiOC6; Invitrogen, D273) staining was performed as described previously (27) for yeast cells labeled with mitoCherry or mitoFluc. Briefly, 1 × 10⁶ log-phase cells cultured in SC-complete were washed once with staining buffer (10 mM Hepes, pH 7.6 + 5% glucose). After washing and centrifugation, the pellet was resuspended in staining buffer with 21.875 nM DiOC6. After incubation for 5 min at room temperature, the cells were washed two times with staining buffer and followed by confocal imaging or flow cytometry analysis. Tetramethylrhodamine methyl ester (TMRM; Sigma-Aldrich, catalog no. T5428-25MG) staining was performed for cells that have GFP labels. Cells were incubated with 250 nM TMRM at 30°C for 10 min and washed three times before recording. Mammalian cells were incubated with 20 nM DiOC6 at 37°C for 30 min, followed by washing three times with PBS. Fluorescence intensity was measured with an Attune NxT flow cytometer (Thermo Fisher Scientific).
Detergent resistance assay
Log-phase yeast cells cultured in YPD were collected by centrifugation (5000g, 6 min) and then washed once with ddH2O, followed by 10 mM DTT treatment for 5 min (pH 9.3) at 30°C. The cells were then washed with sorbitol buffer (pH 7.5, 1.2 M sorbitol) followed by 8-min digestion with Zymolyase 100T (1 mg/ml) in Zymolyase buffer. The cells then were washed twice with SEH buffer [0.6 M sorbitol, 20 mM Hepes-KOH (pH 7.4), 2 mM MgCl2, and protease cocktail (Sigma-Aldrich); PMSF 1 mM was added before use] to remove the Zymolyase and were lysed with a dounce homogenizer. The homogenate was centrifuged at 1500g for 5 min at 4°C, and then the supernatant was collected and centrifuged at 12,000g for 10 min at 4°C. The pellet was resuspended and imaged to ensure mitochondria were intact. Then, 1% Triton X-100 was added and incubated on ice for 10 min before confocal imaging. The mitochondrial membranes were removed by detergent extraction, which was confirmed by imaging. The purified mitochondrial aggregates were stable at 4°C for greater than 12 hours.
Sucrose density gradient analysis
A strain expressing both the β-estradiol–inducible GEM system of mitoFluc expression and the AID system of Mdm12-AID was cultured in YPD overnight and then was refreshed in two individual flasks of YPD for 2 to 3 hours at 30°C. One of the flasks was supplemented with 0.5 mM auxin (I2886-25G, Sigma-Aldrich) for 3 hours and then both flasks were supplied with 1 μM β-estradiol for 3 hours of mitoFluc induction. Total OD600 ~ 60 to 70 cells were collected by centrifugation at 6000g for 5 min. The pellets were then washed once with ddH2O, followed by 10 mM DTT treatment for 5 min (pH 9.3) at 30°C. After washing with sorbitol buffer (pH 7.5, 1.2 M sorbitol), cells were treated with Zymolyase 100T (1 mg/ml) at 30°C for 8 min, followed by two runs of washing with Zymolyase buffer. The digested cells were lysed with 900 μl of ice-cold lysis buffer [50 mM Hepes (pH 7.5), 150 mM NaCl, 1 mM DTT, 5% glycerol, 1% Triton X-100, and protease inhibitor cocktail]. The lysates were centrifuged for 1 min at 3000g to remove cell debris. The supernatant was collected and transferred to the top of a sucrose gradient (900 μl of 50% sucrose, 900 μl of 20% sucrose, and 900 μl of 10% sucrose dissolved in lysis buffer, or equal amounts of 50, 40, 30, 20, and 10% sucrose in lysis buffer). Samples were centrifuged at 20,000 rpm for 20 min at 4°C using a swing bucket SW55Ti (Beckman). Different fractions were collected by inserting 18-gauge needles to the side of the centrifuge tube. About 200 μl was extracted from each fraction for imaging and Western blotting analysis. Kgd1 sedimentation experiments were performed likewise.
Mammalian cell lysates and sedimentation
HEK293T cells transfected with either mito-BFP, mitoFluc-SM, or mitoFluc-DM for 2 days were washed with PBS and lysed with radioimmunoprecipitation assay buffer supplemented with protease inhibitors on ice for 30 min. Cell lysates were further sonicated and incubated on ice, followed by 10 min of 21,200g centrifugation at 4°C. Both supernatant and pellet were collected and analyzed using SDS–polyacrylamide gel electrophoresis. Transfer was performed using iBlot2 (Thermo Fisher Scientific) and immunoblots were developed using Clarity Western ECL substrate (Bio-Rad). Data were acquired using LI-COR imaging systems (LI-COR Biosciences) and analyzed with Image Studio (LI-COR Biosciences).
Yeast cell lysates and sedimentation
Total OD600 ~ 10 log-phase cells were collected and lysed by 1% Triton X-100 containing lysis buffer [50 mM Hepes (pH 7.5), 150 mM NaCl, 1 mM DTT, 5% glycerol, 1% Triton X-100, and protease inhibitor cocktail] (see the “Sucrose density gradient analysis” section for details). Cell debris were removed by 1-min 3000g centrifugation. The supernatant was centrifuged at 100,000g for 1 hour at 4°C to separate the “soluble fraction” from the “insoluble fraction.” Different fractions were collected and analyzed by Western blot.
AKG dehydrogenase activity
Two different strains (WT + mitoCherry; WT + MTS-FlucSM-mCherry) were cultured in YPD overnight and refreshed for 4 hours at 30°C. In total, ~1 OD600/ml of cells were collected by centrifugation at 6000g for 5 min and then washed once with ddH2O, followed by 10 mM DTT treatment for 5 min (pH 9.3) at 30°C. Then, cells were washed with sorbitol buffer, followed by 8-min digestion with Zymolyase 100T (1 mg/ml) at 30°C. The digested cells were washed twice with Zymolyase buffer. Then, the cells were lysed by adding 100 μl of sample buffer from an AKG Dehydrogenase Activity Colorimetric Assay Kit (Sigma-Aldrich, catalog no. MAK189-1KT) on ice for 10 min. Samples were centrifuged at 10,000g for 5 min to remove insoluble material. The supernatant was transferred to a fresh tube. Two microliters of Ketoglutarate Dehydrogenase (KGDH) Developer and 2 μl of KGDH Substrate were added to 46 μl of each sample, according to the kit protocol. Each reaction mix was added to a 96-well plate (Evergreen, catalog no. 222-8030-01F). Samples were mixed well using an orbital shaker. Absorbance (450 nm) was measured with Cytation 5 (BioTek) in kinetic mode for 60 min at 30°C. The absorbance readings were recorded every minute. The absorbance for each sample versus time was plotted. The values obtained from the appropriate NADH Standards were used to plot a standard curve. Reaction parameters were calculated following the kit instruction (Sigma-Aldrich, catalog no. MAK189-1KT).
Yeast growth assays
Plate: Three single colonies of the cells expressing mitoCherry or mitoFluc were inoculated in YPD or YPG media at 30°C overnight. The cultures were then diluted to an OD of 0.04 and 0.075, respectively, to refresh for 4 hours at 30°C to enter log phase. Then the OD-adjusted mitoCherry cells and mitoFluc cells were plated on YPD and YPG plates. Cells were spotted at 10× serial dilutions from left to right and cultured at 30°C for 42 hours on YPD plates and 118 hours on YPG plates before imaging with a document scanner.
For the growth curves, cells of the indicated genetic background were cultured in corresponding media. Overnight cultures were refreshed for 4 hours at 30°C and the OD600 of the cells was measured and adjusted to 0.04. Two hundred microliters of this suspension was added to a 96-well plate. The wells along the plate’s perimeter were filled with 200 μl of medium without sample to avoid evaporation and the plate was sealed with parafilm. The OD at 600 nm was continuously monitored at 30°C using a Tecan Infinite M200 Pro every 30 min. The data were extracted and analyzed using Magellan 7 software and the R package grofit (https://cran.r-project.org/src/contrib/Archive/grofit/) (70).
Bud scar staining
Log-phase cells cultured in SC-complete media (Sunrise Science Productions, catalog no. 1459-1KG) were stained with calcofluor dye (calcofluor white HMR, 1 g/liter; Evans Blue, 0.5 g/liter) in a 5:1 (v/v) culture/dye ratio. The mixture was then incubated at 30°C for 10 min while protecting from light. Cells were then washed once with SC-complete and imaged with a Nikon Ti-E inverted fluorescence microscope equipped with a FLASH 4 LT CMOS camera. GFP-labeled Hsp78 and calcofluor-stained bud scars were imaged by 470-nm excitation at 50% exposure using a fluorescein isothiocyanate filter and by 395-nm excitation at 5% exposure via a DAPI filter.
Flow cytometry
After DiOC6 or TMRM staining, cells were analyzed on the Attune NxT flow cytometer (Thermo Fisher Scientific) equipped with appropriate filter sets. At least 50,000 events were collected for each sample. Statistical analysis was performed with GraphPad Prism software.
mtDNA staining
Yeast cultures containing 106 to 107 cells were collected at 5000g for 30 s and resuspended in 100 μl of PBS + 4% formaldehyde. Following a 15-min incubation at room temperature, cells were sedimented and resuspended in 1 ml of PBS + 0.1% Triton X-100 by vortexing for 30 s. Cells were then washed twice with PBS and resuspended in PBS + DAPI (200 ng/ml). Following a 30-min incubation at room temperature, cells were spotted on a glass slide and z-stacks were taken using the DAPI channel on a Nikon Ti-E inverted fluorescence microscope equipped with a FLASH 4 LT CMOS camera using 3-s exposures at 100% light-emitting diode power or the OMX SIM for super-resolution imaging.
Petite frequency determination
Yeast cells from 30°C exponentially growing YPD cultures were serially diluted in three steps to OD600 of 2.5 × 10⁻⁴, and 150 μl was plated on prewarmed YPD plates using 8 to 10 glass plating beads. After 3 days of growth at 30°C, plates were imaged using a standard document scanner at 600 DPI. Images were cropped in ImageJ and quantified with the OpenCFU* colony analysis program (71) using a colony radius range of 3 to 5000 pixels and an inverted threshold set to 2 with no other filters applied.
Quantification and statistical analysis
Please refer to the figure legends or Materials and Methods for description of sample size and statistical details. Data are displayed as means ± SEM. Statistical analysis was performed with Prism 5 (GraphPad Software, La Jolla, USA) and P values < 0.05 were considered significant. The yeast growth analyses were performed using grofit R package.
Supplementary Material
Acknowledgments
We thank D. Klionsky and S. Claypool for reagents, and H. Sesaki, S. Claypool, B.C. Kim, S. Margolis, S. Li, S. Watanabe, and J. Liu for valuable discussion. Funding: This work was supported by grant R35 GM118172 from the NIH, a grant from Re-Stem Biotech to R.L., a Predoctoral Fellowship from the American Heart Association and the DC Women’s Board (AHA 17PRE33670517), the Isaac Morris Hay and Lucille Elizabeth Hay Graduate Fellowship from Johns Hopkins Cell Biology to L.R., and the shared instrumentation grant S10OD021844 from the NIH to Johns Hopkins. A.P. and J.T.M. were supported by a training grant, T32 GM007445, from the NIH to the BCMB graduate program at JHMI. G.S. was supported by a National Defense Science and Engineering Graduate Fellowship. Author contributions: Conceptualization: L.R. and R.L. Methodology: L.R., J.T.M., X.Z., J.Z., Y.D., G.S., and C.H.N. Investigation: L.R., J.T.M., X.Z., and A.C.-C.C. Validation: A.C.-C.C. and A.P. Writing—original draft: L.R. and R.L. Writing—review and editing: L.R., R.L., J.T.M., X.Z., and A.C.-C.C. Supervision: R.L. Funding acquisition: R.L. Competing interests: The authors declare that they have no competing interests. Data and materials availability: All data needed to evaluate the conclusions in the paper are present in the paper and/or the Supplementary Materials. Additional data related to this paper may be requested from the authors. Requests for resources and reagents should be directed to and will be fulfilled by the corresponding author, R.L. (Rong@jhu.edu). Proteomics data are included in table S1. All strains and plasmids are listed in table S3.
SUPPLEMENTARY MATERIALS
Supplementary material for this article is available at http://advances.sciencemag.org/cgi/content/full/6/32/eabc7288/DC1
REFERENCES AND NOTES
- 1.Friedman J. R., Nunnari J., Mitochondrial form and function. Nature 505, 335–343 (2014). [DOI] [PMC free article] [PubMed] [Google Scholar]
- 2.López-Otín C., Blasco M. A., Partridge L., Serrano M., Kroemer G., The hallmarks of aging. Cell 153, 1194–1217 (2013). [DOI] [PMC free article] [PubMed] [Google Scholar]
- 3.Lin M. T., Beal M. F., Mitochondrial dysfunction and oxidative stress in neurodegenerative diseases. Nature 443, 787–795 (2006). [DOI] [PubMed] [Google Scholar]
- 4.Shadel G. S., Horvath T. L., Mitochondrial ROS signaling in organismal homeostasis. Cell 163, 560–569 (2015). [DOI] [PMC free article] [PubMed] [Google Scholar]
- 5.Park C. B., Larsson N.-G., Mitochondrial DNA mutations in disease and aging. J. Cell Biol. 193, 809–818 (2011). [DOI] [PMC free article] [PubMed] [Google Scholar]
- 6.Moehle E. A., Shen K., Dillin A., Mitochondrial proteostasis in the context of cellular and organismal health and aging. J. Biol. Chem. 294, 5396–5407 (2019). [DOI] [PMC free article] [PubMed] [Google Scholar]
- 7.Quirós P. M., Langer T., López-Otín C., New roles for mitochondrial proteases in health, ageing and disease. Nat. Rev. Mol. Cell Biol. 16, 345–359 (2015). [DOI] [PubMed] [Google Scholar]
- 8.Durieux J., Wolff S., Dillin A., The cell non-autonomous nature of electron transport chain-mediated longevity. Cell 144, 79–91 (2011). [DOI] [PMC free article] [PubMed] [Google Scholar]
- 9.Sorrentino V., Romani M., Mouchiroud L., Beck J. S., Zhang H., D’Amico D., Moullan N., Potenza F., Schmid A. W., Rietsch S., Counts S. E., Auwerx J., Enhancing mitochondrial proteostasis reduces amyloid-β proteotoxicity. Nature 552, 187–193 (2017). [DOI] [PMC free article] [PubMed] [Google Scholar]
- 10.Ruan L., Zhou C., Jin E., Kucharavy A., Zhang Y., Wen Z., Florens L., Li R., Cytosolic proteostasis through importing of misfolded proteins into mitochondria. Nature 543, 443–446 (2017). [DOI] [PMC free article] [PubMed] [Google Scholar]
- 11.Li Y., Xue Y., Xu X., Wang G., Liu Y., Wu H., Li W., Wang Y., Chen Z., Zhang W., Zhu Y., Ji W., Xu T., Liu L., Chen Q., A mitochondrial FUNDC1/HSC70 interaction organizes the proteostatic stress response at the risk of cell morbidity. EMBO J. 38, e98786 (2019). [DOI] [PMC free article] [PubMed] [Google Scholar]
- 12.Fang D., Wang Y., Zhang Z., Du H., Yan S., Sun Q., Zhong C., Wu L., Vangavaragu J. R., Yan S., Hu G., Guo L., Rabinowitz M., Glaser E., Arancio O., Sosunov A. A., McKhann G. M., Chen J. X., Yan S. S., Increased neuronal PreP activity reduces Aβ accumulation, attenuates neuroinflammation and improves mitochondrial and synaptic function in Alzheimer disease’s mouse model. Hum. Mol. Genet. 24, 5198–5210 (2015). [DOI] [PMC free article] [PubMed] [Google Scholar]
- 13.Choi S. Y., Lopez-Gonzalez R., Krishnan G., Phillips H. L., Li A. N., Seeley W. W., Yao W. D., Almeida S., Gao F. B., C9ORF72-ALS/FTD-associated poly(GR) binds Atp5a1 and compromises mitochondrial function in vivo. Nat. Neurosci. 22, 851–862 (2019). [DOI] [PMC free article] [PubMed] [Google Scholar]
- 14.Wang W., Wang L., Lu J., Siedlak S. L., Fujioka H., Liang J., Jiang S., Ma X., Jiang Z., da Rocha E. L., Sheng M., Choi H., Lerou P. H., Li H., Wang X., The inhibition of TDP-43 mitochondrial localization blocks its neuronal toxicity. Nat. Med. 22, 869–878 (2016). [DOI] [PMC free article] [PubMed] [Google Scholar]
- 15.Kaganovich D., Kopito R., Frydman J., Misfolded proteins partition between two distinct quality control compartments. Nature 454, 1088–1095 (2008). [DOI] [PMC free article] [PubMed] [Google Scholar]
- 16.Zhou C., Slaughter B. D., Unruh J. R., Guo F., Yu Z., Mickey K., Narkar A., Ross R. T., McClain M., Li R., Organelle-based aggregation and retention of damaged proteins in asymmetrically dividing cells. Cell 159, 530–542 (2014). [DOI] [PMC free article] [PubMed] [Google Scholar]
- 17.Frottin F., Schueder F., Tiwary S., Gupta R., Körner R., Schlichthaerle T., Cox J., Jungmann R., Hartl F. U., Hipp M. S., The nucleolus functions as a phase-separated protein quality control compartment. Science 365, 342–347 (2019). [DOI] [PubMed] [Google Scholar]
- 18.Hipp M. S., Kasturi P., Hartl F. U., The proteostasis network and its decline in ageing. Nat. Rev. Mol. Cell Biol. 20, 421–435 (2019). [DOI] [PubMed] [Google Scholar]
- 19.Wolff S., Weissman J. S., Dillin A., Differential scales of protein quality control. Cell 157, 52–64 (2014). [DOI] [PubMed] [Google Scholar]
- 20.Sontag E. M., Samant R. S., Frydman J., Mechanisms and functions of spatial protein quality control. Annu. Rev. Biochem. 86, 97–122 (2017). [DOI] [PubMed] [Google Scholar]
- 21.Steinkraus K. A., Kaeberlein M., Kennedy B. K., Replicative aging in yeast: The means to the end. Annu. Rev. Cell Dev. Biol. 24, 29–54 (2008). [DOI] [PMC free article] [PubMed] [Google Scholar]
- 22.Gottschling D. E., Nyström T., The upsides and downsides of organelle interconnectivity. Cell 169, 24–34 (2017). [DOI] [PMC free article] [PubMed] [Google Scholar]
- 23.von Janowsky B., Major T., Knapp K., Voos W., The disaggregation activity of the mitochondrial ClpB homolog Hsp78 maintains Hsp70 function during heat stress. J. Mol. Biol. 357, 793–807 (2006). [DOI] [PubMed] [Google Scholar]
- 24.Parsell D. A., Kowal A. S., Singer M. A., Lindquist S., Protein disaggregation mediated by heat-shock protein Hspl04. Nature 372, 475–478 (1994). [DOI] [PubMed] [Google Scholar]
- 25.Glover J. R., Lindquist S., Hsp104, Hsp70, and Hsp40: A novel chaperone system that rescues previously aggregated proteins. Cell 94, 73–82 (1998). [DOI] [PubMed] [Google Scholar]
- 26.Zhou C., Slaughter B. D., Unruh J. R., Eldakak A., Rubinstein B., Li R., Motility and segregation of Hsp104-associated protein aggregates in budding yeast. Cell 147, 1186–1196 (2011). [DOI] [PMC free article] [PubMed] [Google Scholar]
- 27.Hughes A. L., Gottschling D. E., An early-age increase in vacuolar pH limits mitochondrial function and lifespan in yeast. Nature 492, 261–265 (2012). [DOI] [PMC free article] [PubMed] [Google Scholar]
- 28.Gupta R., Kasturi P., Bracher A., Loew C., Zheng M., Villella A., Garza D., Hartl F. U., Raychaudhuri S., Firefly luciferase mutants as sensors of proteome stress. Nat. Methods 8, 879–884 (2011). [DOI] [PubMed] [Google Scholar]
- 29.Geissler A., Krimmer T., Bömer U., Guiard B., Rassow J., Pfanner N., Membrane potential-driven protein import into mitochondria: The sorting sequence of cytochrome b2 modulates the δψ-dependence of translocation of the matrix-targeting sequence. Mol. Biol. Cell 11, 3977–3991 (2000). [DOI] [PMC free article] [PubMed] [Google Scholar]
- 30.Hyman A. A., Weber C. A., Jülicher F., Liquid-liquid phase separation in biology. Annu. Rev. Cell Dev. Biol. 30, 39–58 (2014). [DOI] [PubMed] [Google Scholar]
- 31.Kornmann B., Currie E., Collins S. R., Schuldiner M., Nunnari J., Weissman J. S., Walter P., An ER-mitochondria tethering complex revealed by a synthetic biology screen. Science 325, 477–481 (2009). [DOI] [PMC free article] [PubMed] [Google Scholar]
- 32.Costa E. A., Subramanian K., Nunnari J., Weissman J. S., Defining the physiological role of SRP in protein-targeting efficiency and specificity. Science 359, 689–692 (2018). [DOI] [PMC free article] [PubMed] [Google Scholar]
- 33.Nishimura K., Fukagawa T., Takisawa H., Kakimoto T., Kanemaki M., An auxin-based degron system for the rapid depletion of proteins in nonplant cells. Nat. Methods 6, 917–922 (2009). [DOI] [PubMed] [Google Scholar]
- 34.Boldogh I. R., Nowakowski D. W., Yang H.-C., Chung H., Karmon S., Royes P., Pon L. A., A protein complex containing Mdm10p, Mdm12p, and Mmm1p links mitochondrial membranes and DNA to the cytoskeleton-based segregation machinery. Mol. Biol. Cell 14, 4618–4627 (2003). [DOI] [PMC free article] [PubMed] [Google Scholar]
- 35.Meisinger C., Pfannschmidt S., Rissler M., Milenkovic D., Becker T., Stojanovski D., Youngman M. J., Jensen R. E., Chacinska A., Guiard B., Pfanner N., Wiedemann N., The morphology proteins Mdm12/Mmm1 function in the major β-barrel assembly pathway of mitochondria. EMBO J. 26, 2229–2239 (2007). [DOI] [PMC free article] [PubMed] [Google Scholar]
- 36.Lackner L. L., The expanding and unexpected functions of mitochondria contact sites. Trends Cell. Biol. 29, 580–590 (2019). [DOI] [PMC free article] [PubMed] [Google Scholar]
- 37.Connerth M., Tatsuta T., Haag M., Klecker T., Westermann B., Langer T., Intramitochondrial transport of phosphatidic acid in yeast by a lipid transfer protein. Science 338, 815–818 (2012). [DOI] [PubMed] [Google Scholar]
- 38.Tamura Y., Endo T., Iijima M., Sesaki H., Ups1p and Ups2p antagonistically regulate cardiolipin metabolism in mitochondria. J. Cell Biol. 185, 1029–1045 (2009). [DOI] [PMC free article] [PubMed] [Google Scholar]
- 39.Sauerwald J., Jores T., Eisenberg-Bord M., Chuartzman S. G., Schuldiner M., Rapaport D., Genome-wide screens in Saccharomyces cerevisiae highlight a role for cardiolipin in biogenesis of mitochondrial outer membrane multispan proteins. Mol. Cell. Biol. 35, 3200–3211 (2015). [DOI] [PMC free article] [PubMed] [Google Scholar]
- 40.Tamura Y., Harada Y., Yamano K., Watanabe K., Ishikawa D., Ohshima C., Nishikawa S.-i., Yamamoto H., Endo T., Identification of Tam41 maintaining integrity of the TIM23 protein translocator complex in mitochondria. J. Cell Biol. 174, 631–637 (2006). [DOI] [PMC free article] [PubMed] [Google Scholar]
- 41.Jiao H., Yin Y., Liu Z., Structures of the mitochondrial CDP-DAG synthase Tam41 suggest a potential lipid substrate pathway from membrane to the active site. Structure 27, 1258–1269.e4 (2019). [DOI] [PubMed] [Google Scholar]
- 42.Ho B., Baryshnikova A., Brown G. W., Unification of protein abundance datasets yields a quantitative Saccharomyces cerevisiae proteome. Cell Syst. 6, 192–205.e3 (2018). [DOI] [PubMed] [Google Scholar]
- 43.Christiano R., Nagaraj N., Frohlich F., Walther T. C., Global proteome turnover analyses of the yeasts S. cerevisiae and S. pombe. Cell Rep. 9, 1959–1965 (2014). [DOI] [PMC free article] [PubMed] [Google Scholar]
- 44.Huh W.-K., Falvo J. V., Gerke L. C., Carroll A. S., Howson R. W., Weissman J. S., O’Shea E. K., Global analysis of protein localization in budding yeast. Nature 425, 686–691 (2003). [DOI] [PubMed] [Google Scholar]
- 45.Piñero J., Bravo À., Queralt-Rosinach N., Gutiérrez-Sacristán A., Deu-Pons J., Centeno E., García-García J., Sanz F., Furlong L. I., DisGeNET: A comprehensive platform integrating information on human disease-associated genes and variants. Nucleic Acids Res. 45, D833–D839 (2017). [DOI] [PMC free article] [PubMed] [Google Scholar]
- 46.Glick B. S., Brandt A., Cunningham K., Müller S., Hallberg R. L., Schatz G., Cytochromes c1 and b2 are sorted to the intermembrane space of yeast mitochondria by a stop-transfer mechanism. Cell 69, 809–822 (1992). [DOI] [PubMed] [Google Scholar]
- 47.Jang J. Y., Blum A., Liu J., Finkel T., The role of mitochondria in aging. J. Clin. Invest. 128, 3662–3670 (2018). [DOI] [PMC free article] [PubMed] [Google Scholar]
- 48.Fukuda T., Kanki T., Mechanisms and physiological roles of mitophagy in yeast. Mol. Cells 41, 35–44 (2018). [DOI] [PMC free article] [PubMed] [Google Scholar]
- 49.Singh P., Ramachandran S. K., Zhu J., Kim B. C., Biswas D., Ha T., Iglesias P. A., Li R., Sphingolipids facilitate age asymmetry of membrane proteins in dividing yeast cells. Mol. Biol. Cell 28, 2712–2722 (2017). [DOI] [PMC free article] [PubMed] [Google Scholar]
- 50.Lackner L. L., Ping H., Graef M., Murley A., Nunnari J., Endoplasmic reticulum-associated mitochondria–cortex tether functions in the distribution and inheritance of mitochondria. Proc. Natl. Acad. Sci. U.S.A. 110, E458–E467 (2013). [DOI] [PMC free article] [PubMed] [Google Scholar]
- 51.Pernice W. M., Vevea J. D., Pon L. A., A role for Mfb1p in region-specific anchorage of high-functioning mitochondria and lifespan in Saccharomyces cerevisiae. Nat. Commun. 7, 10595 (2016). [DOI] [PMC free article] [PubMed] [Google Scholar]
- 52.Kondo-Okamoto N., Ohkuni K., Kitagawa K., Mccaffery J. M., Shaw J. M., Okamoto K., The novel F-box protein Mfb1p regulates mitochondrial connectivity and exhibits asymmetric localization in yeast. Mol. Biol. Cell 17, 3756–3767 (2006). [DOI] [PMC free article] [PubMed] [Google Scholar]
- 53.Ballister E. R., Ayloo S., Chenoweth D. M., Lampson M. A., Holzbaur E. L. F., Optogenetic control of organelle transport using a photocaged chemical inducer of dimerization. Curr. Biol. 25, R407–R408 (2015). [DOI] [PMC free article] [PubMed] [Google Scholar]
- 54.Tamura Y., Harada Y., Nishikawa S.-i., Yamano K., Kamiya M., Shiota T., Kuroda T., Kuge O., Sesaki H., Imai K., Tomii K., Endo T., Tam41 is a CDP-diacylglycerol synthase required for cardiolipin biosynthesis in mitochondria. Cell Metab. 17, 709–718 (2013). [DOI] [PMC free article] [PubMed] [Google Scholar]
- 55.Bruderek M., Jaworek W., Wilkening A., Rüb C., Cenini G., Förtsch A., Sylvester M., Voos W., IMiQ: A novel protein quality control compartment protecting mitochondrial functional integrity. Mol. Biol. Cell 29, 256–269 (2018). [DOI] [PMC free article] [PubMed] [Google Scholar]
- 56.Katajisto P., Döhla J., Chaffer C. L., Pentinmikko N., Marjanovic N., Iqbal S., Zoncu R., Chen W., Weinberg R. A., Sabatini D. M., Asymmetric apportioning of aged mitochondria between daughter cells is required for stemness. Science 348, 340–343 (2015). [DOI] [PMC free article] [PubMed] [Google Scholar]
- 57.Higuchi R., Vevea J. D., Swayne T. C., Chojnowski R., Hill V., Boldogh I. R., Pon L. A., Actin dynamics affect mitochondrial quality control and aging in budding yeast. Curr. Biol. 23, 2417–2422 (2013). [DOI] [PMC free article] [PubMed] [Google Scholar]
- 58.Bubber P., Hartounian V., Gibson G. E., Blass J. P., Abnormalities in the tricarboxylic acid (TCA) cycle in the brains of schizophrenia patients. Eur. Neuropsychopharmacol. 21, 254–260 (2011). [DOI] [PMC free article] [PubMed] [Google Scholar]
- 59.Naseri N. N., Xu H., Bonica J., Vonsattel J. P. G., Cortes E. P., Park L. C., Arjomand J., Gibson G. E., Abnormalities in the tricarboxylic acid cycle in Huntington disease and in a Huntington disease mouse model. J. Neuropathol. Exp. Neurol. 74, 527–537 (2015). [DOI] [PMC free article] [PubMed] [Google Scholar]
- 60.Gibson G. E., Kingsbury A. E., Xu H., Lindsay J. G., Daniel S., Foster O. J. F., Lees A. J., Blass J. P., Deficits in a tricarboxylic acid cycle enzyme in brains from patients with Parkinson’s disease. Neurochem. Int. 43, 129–135 (2003). [DOI] [PubMed] [Google Scholar]
- 61.Giaever G., Chu A. M., Ni L., Connelly C., Riles L., Véronneau S., Dow S., Lucau-Danila A., Anderson K., André B., Arkin A. P., Astromoff A., El Bakkoury M., Bangham R., Benito R., Brachat S., Campanaro S., Curtiss M., Davis K., Deutschbauer A., Entian K.-D., Flaherty P., Foury F., Garfinkel D. J., Gerstein M., Gotte D., Güldener U., Hegemann J. H., Hempel S., Herman Z., Jaramillo D. F., Kelly D. E., Kelly S. L., Kötter P., LaBonte D., Lamb D. C., Lan N., Liang H., Liao H., Liu L., Luo C., Lussier M., Mao R., Menard P., Ooi S. L., Revuelta J. L., Roberts C. J., Rose M., Ross-Macdonald P., Scherens B., Schimmack G., Shafer B., Shoemaker D. D., Sookhai-Mahadeo S., Storms R. K., Strathern J. N., Valle G., Voet M., Volckaert G., Wang C.-y., Ward T. R., Wilhelmy J., Winzeler E. A., Yang Y., Yen G., Youngman E., Yu K., Bussey H., Boeke J. D., Snyder M., Philippsen P., Davis R. W., Johnston M., Functional profiling of the Saccharomyces cerevisiae genome. Nature 418, 387–391 (2002). [DOI] [PubMed] [Google Scholar]
- 62.Gibson D. G., Young L., Chuang R.-Y., Venter J. C., Hutchison C. A., Smith H. O., Enzymatic assembly of DNA molecules up to several hundred kilobases. Nat. Methods 6, 343–345 (2009). [DOI] [PubMed] [Google Scholar]
- 63.Guan J., Stromhaug P. E., George M. D., Habibzadegah-Tari P., Bevan A., Dunn W. A. J., Klionsky D. J., Cvt18/Gsa12 is required for cytoplasm-to-vacuole transport, pexophagy, and autophagy in Saccharomyces cerevisiae and Pichia pastoris. Mol. Biol. Cell 12, 3821–3838 (2001). [DOI] [PMC free article] [PubMed] [Google Scholar]
- 64.Lewis S. C., Uchiyama L. F., Nunnari J., ER-mitochondria contacts couple mtDNA synthesis with mitochondrial division in human cells. Science 353, aaf5549 (2016). [DOI] [PMC free article] [PubMed] [Google Scholar]
- 65.Barger C. J., Branick C., Chee L., Karpf A. R., Pan-cancer analyses reveal genomic features of FOXM1 overexpression in cancer. Cancers (Basel). 11, 251 (2019). [DOI] [PMC free article] [PubMed] [Google Scholar]
- 66.Fung C., Lock R., Gao S., Salas E., Debnath J., Induction of autophagy during extracellular matrix detachment promotes cell survival. Mol. Biol. Cell 19, 797–806 (2008). [DOI] [PMC free article] [PubMed] [Google Scholar]
- 67.Moffat J., Grueneberg D. A., Yang X., Kim S. Y., Kloepfer A. M., Hinkle G., Piqani B., Eisenhaure T. M., Luo B., Grenier J. K., Carpenter A. E., Foo S. Y., Stewart S. A., Stockwell B. R., Hacohen N., Hahn W. C., Lander E. S., Sabatini D. M., Root D. E., A lentiviral RNAi library for human and mouse genes applied to an arrayed viral high-content screen. Cell 124, 1283–1298 (2006). [DOI] [PubMed] [Google Scholar]
- 68.Jo M. C., Liu W., Gu L., Dang W., Qin L., High-throughput analysis of yeast replicative aging using a microfluidic system. Proc. Natl. Acad. Sci. U.S.A. 112, 9364–9369 (2015). [DOI] [PMC free article] [PubMed] [Google Scholar]
- 69.Cox J., Mann M., MaxQuant enables high peptide identification rates, individualized p.p.b.-range mass accuracies and proteome-wide protein quantification. Nat. Biotechnol. 26, 1367–1372 (2008). [DOI] [PubMed] [Google Scholar]
- 70.Kahm M., Hasenbrink G., Lichtenberg-Fraté H., Ludwig J., Kschischo M., grofit: Fitting biological growth curves with R. J. Stat. Softw. 33, 1–21 (2010).20808728 [Google Scholar]
- 71.Geissmann Q., OpenCFU, a new free and open-source software to count cell colonies and other circular objects. PLOS ONE 8, e54072 (2013). [DOI] [PMC free article] [PubMed] [Google Scholar]
Associated Data
This section collects any data citations, data availability statements, or supplementary materials included in this article.
Supplementary Materials
Supplementary material for this article is available at http://advances.sciencemag.org/cgi/content/full/6/32/eabc7288/DC1