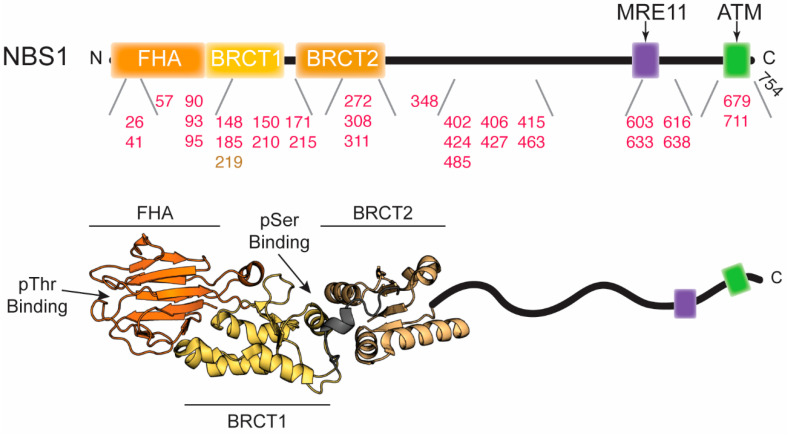
Figure 4.
Disease-associated mutations in NBS1. Top, domain architecture of NBS1. The numbers indicate the position of mutations outlined in the text and in Table 3. Red and gold numbers correspond to mutations associated with cancer and NBS, respectively. The two arrows above indicate the positions where MRE11 and ATM bind. Bottom, crystal structure of the S. pombe FHA and tandem BRCT domains (PDB ID: 3HUE). The intrinsically disordered C-terminus is cartooned in and is not to scale.

