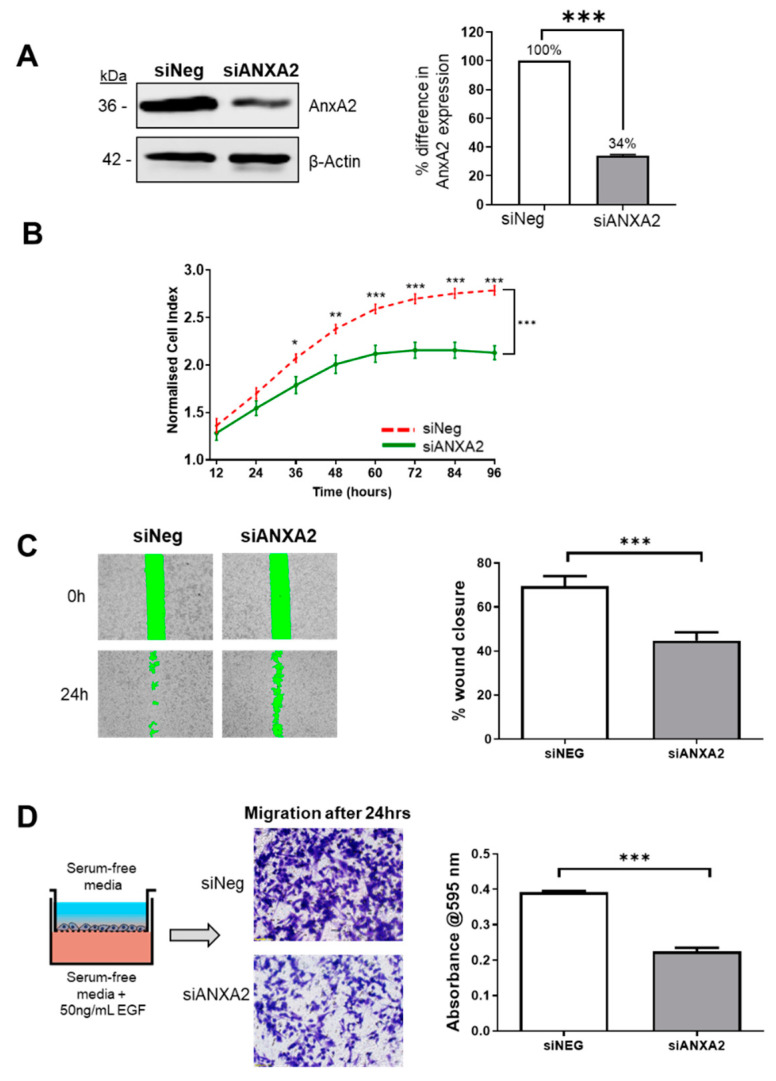
Figure 4.
siRNA mediated knockdown of AnxA2 inhibits the proliferation and migration of MDA-MB-231 cells. (A) MDA-MB-231 cells were transfected with a small interference oligonucleotide against ANXA2 [10 nM] for 72 h, using the Neon Transfection system. Representative blot showing the efficiency of ANXA2 knockdown (KD) after 72 h and densitometry analysis of Annexin A2 protein bands normalized against beta-actin loading control and expressed as a percentage of AnxA2 level in negative control, measured using Image Studio software. Data displayed as mean +/− SEM for three individual experiments. (B) Reduction of Annexin A2 expression in MDA-MB-231 cells significantly inhibits cell proliferation as measured by real time change in cell impedance. KD and negative control cells were seeded in duplicate into E-plate wells and the rate of proliferation was measured in real-time using the xCELLigence system. Proliferation of KD cells (green) was compared to the proliferation of negative control wells (red) over the course of 96 h. Data displayed as mean cell index +/− SEM for three individual experiments. (C) Reduction of Annexin A2 expression in MDA-MB-231 cells significantly inhibits cell migration as measured by wound healing assay. Knockdown and negative control cells were plated into dishes containing ibidi Culture Inserts. After 72 h, the inserts were removed to generate a cell free wound. The green zone indicates the wound size as measured at 0 h and 24 h post-removal of insert. Data displayed as percent wound closure for 3 individual experiments (6 fields of view each) +/− SEM, p = 0.0002. (D) Reduction of Annexin A2 expression significantly inhibits EGF directed cell migration as measured with transwell migration chambers. Cells were plated onto the upper chamber of transwell membrane and allowed to migrate towards 50 ng/mL EGF chemoattractant for 24 h. Cells were removed from the upper chamber, leaving only those that had migrated to the lower chamber. Migrated cells were stained with crystal violet and imaged using an inverted light microscope. Crystal violet stain was dissolved, and intensity measured as absorbance at 595 nm in triplicate. Data displayed as mean absorbance values for 3 individual experiments +/− SEM, p < 0.0001.

