Abstract
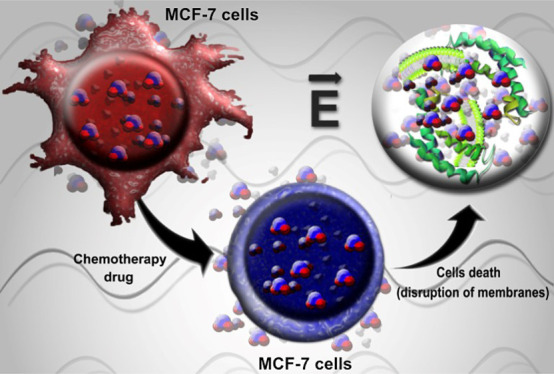
Using dielectric spectroscopy experiments performed at multiple temperatures and frequency ranges, we demonstrate how the chemotherapy drug paclitaxel changes the dynamic properties of water in a breast cancer cell line (MCF-7). From the measured data, we present evidence that treatment with paclitaxel leads to a slight increase in activation energy in a relaxation related to bulk-like water. More importantly, we also observe that paclitaxel changes the constraining imposed by the biological interfaces on hydration water, whose single-particle dynamics becomes slower and with higher activation energy. These variations are only observable after freezing the dynamics from other cellular components, such as proteins and DNAs, regardless of the state of the cells, that is, treated or not treated or even if the cells are no longer viable. Therefore, changes in water dynamics could be detected prior to those related to the global dynamics within the cellular environment.
1. Introduction
Some of the many biological events related to the dynamic properties of cellular water include stabilization of DNA’s double helix,1 catalysis, protein dynamics and structure,2,3 cell migration,4 biological effects of ionizing radiation,5 and effects of chemotherapy drugs.6−8 However, the existence of such diverse water populations still hinders the drawing of a definitive picture of the exact role of water in living cells. For instance, in different types of cells, the water populations with weaker contact with the biological interfaces, the so-called bulk-like populations, can have properties closer to or apart from the behavior of bulk water. Moreover, as a result of the soft confinement conditions, the properties of water molecules in close contact with the biological interfaces are frequently different for distinct cells and may even change depending on the stage of the cells’ life cycle. Additionally, all these aspects can be altered by diseases, radiation therapy, or drugs. Understanding how these variations in water dynamics may influence the overall mechanisms within the cells requires the combination of several theoretical and experimental approaches. Furthermore, considering that biological water has a low-temperature behavior that differs from that of bulk water, experiments at cryo-temperatures are of interest to interpret the structural and dynamical properties of water confined in the complex architecture of a living cell.9
In a previous work, we used neutron spectroscopy, which provides information not only about energy variations but also momentum transfer,10−12 to show how the dynamics of intracellular water in the breast cancer cell line MCF-7 is affected by the action of the chemotherapy drug paclitaxel (PTX).6 As PTX causes mitotic arrest and apoptotic cell death, changes in a cellular membrane’s and proteins’ conformation occur, and, as an adjacent consequence, changes in the dynamics of water populations associated with these cellular interfaces may take place.13 Hence, using quasi-elastic scattering, we reported considerable changes in the bulk-like water dynamics at room temperature and with inelastic scattering, we obtained initial insights about changes in the mobility and overall organization of the confined water populations.6
Here, we have performed temperature-dependent dielectric spectroscopy (DS) experiments that allowed us to study the water dynamics on a broader timescale and thus complement our earlier observations. The same cells used in the previous neutron scattering experiments were investigated, that is, MCF-7 cells treated and not treated with PTX, hereafter TC and NTC. We have also investigated a TC sample exposed for 12 h at room temperature without any further control. In this sample, hereafter, TCnext-day, the cells are no longer alive, thus allowing us to study the properties of an aqueous solution containing the biomolecules present in the living cells without the structure of cellular membranes.
2. Results and Discussion
According to previous DS investigations involving living cells at room temperature, two relaxations are, in principle, the most important to be considered in this work. While the polarization effects from the cell membranes lead to a relaxation below 1 GHz that can be used to verify the integrity of the cellular membranes, at frequencies around 10 GHz the γ-relaxation will give insights regarding the reorientation of water molecules.14−16 The γ-relaxation is, therefore, our starting point. At lower temperatures, because of supercooling effects,17,18 the behavior of this relaxation will also provide valuable understanding of the dynamics of water populations in closer contact with the biological interfaces within the cells.
Initially, we performed DS experiments at room temperature in the microwave frequency range (0.1 to 50 GHz) that allowed us to characterize the γ-relaxation in the NTC, TC, and TCnext-day. As these experiments were conducted at room temperature, the signal from bulk-like water is dominant in the γ-relaxation, and, in contrast to our previous quasi-elastic neutron scattering experiments,6 no considerable differences between the NTC and TC were detected. This implies that spatial resolution (or, in other words, information about the momentum transfer) is critical to observe the dynamic differences in the bulk-like water populations of these cells at room temperature. At this point, one must also recall that DS is only sensitive to rotational dipolar dynamics and the diffusion of ionic entities. Further information about the DS data collection and analysis can be found in the Materials and Methods section at the end of the paper.
Figure 1 also includes data collected at room temperature in the radiofrequency range. In this case, the DC conductivities dominate the loss components (ε″), as depicted by the slopes in the data, and subtle signatures of lower frequency dispersions are detected in the real parts (ε′) of the spectra. The experimental DS data were fitted with the empirical Cole–Cole (CC) equation for the complex dielectric relaxation
| 1 |
where the first term accounts for ionic DC conductivity (σ0 is the limiting low-frequency conductivity), ε∞ is the limiting high-frequency permittivity, ω is the angular frequency, An is the dispersion amplitude, and τn is the relaxation time of the relaxation component n. The parameter αn (0 < αn≤ 1) accounts for the broadening of the relaxations and is often related to the interactions between water dipoles and other dipolar or charged species.19
Figure 1.
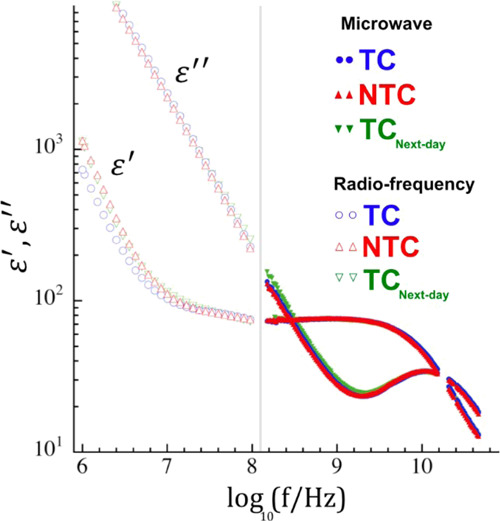
DS data for the NTC, TC, and TCnext-day at room temperature. On the right-hand side of the gray line, the data collected in the microwave frequency range are presented as closed symbols. On the left-hand side, the data collected at the radio-frequency range are presented as open symbols.
The values obtained for the γ-relaxation times in the MCF-7 cells (∼13 ps) are nearly independent of the treatment with PTX and are higher than the relaxation times determined for pure water as well as for other systems containing dispersed living cells (∼8 ps).14 Even for the TCnext-day, such a relaxation time is not considerably shifted and was determined as 13.3 ± 0.12 ps.
Although the presence of a cellular membrane structure can usually be confirmed by a relaxation observed below 0.1 GHz,20 as shown in Figure 1, this relaxation also presents nearly the same characteristics in all the samples despite the expected differences in the TCnext-day. Therefore, we rely on viability tests to ensure that the cellular integrity is kept in both the NTC and TC (details of these tests are given in the Materials and Methods section). Additionally, the absence of differences in this lower frequency dispersion can expose the dominance of electrode polarization phenomena in the real part of the data, as depicted by the slope at lower frequencies (see Figure 1). To circumvent this effect, in the following analyses, we focused on the imaginary part of the dielectric response, ε″.
Sequentially, we moved to results obtained at lower temperatures, where the dielectric responses were evaluated on cooling in the radiofrequency range. The presence of any dynamic relaxation at temperatures above 250 K is not clear because of the dominance of the conductivities in the signals that monotonically decrease with temperature, as shown in the Supporting Information (Figure S2). This monotonic decrease in conductivity is broken as the samples experience phase transitions at around 256 K in the NTC, 258 K in the TC, and 252 K in the TCnext-day. After these transitions during cooling and the consequent drastic drop in the DC conductivity, it is possible to detect relaxations from the confined water populations in the NTC, TC, and TCnext-day. As shown in Figure 2, reliable quantitative descriptions of these relaxations with the CC equation are achieved between ∼230 and ∼200 K. At higher temperatures, fitting the data was not possible because of the proximity to the instrumental limit. From these fits, we obtained the relaxation times from each sample at these temperature ranges and the temperature dependence of these parameters is discussed further in the paper.
Figure 2.
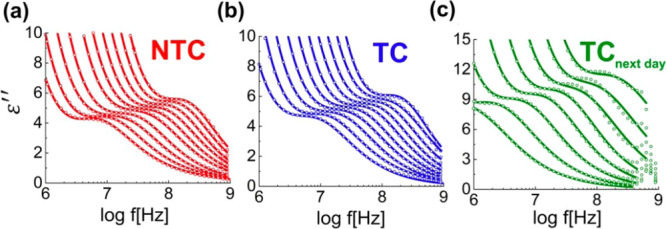
Dielectric loss data collected at the radiofrequency range between 230 and 200 K for the (a)NTC, (b) TC, and (c) TCnext-day. The dots are the experimental data and the full lines represent the fits with eq 1.
To obtain a complete dynamic map, we also conducted experiments with a broadband spectrometer at even lower temperatures, between 205 and 115 K and at frequencies between 10–2 and 107 Hz. At such low temperatures, in addition to the relaxations previously observed in the radiofrequency range, slower processes are also detected in all samples as shown by the arrows in Figure 3.
Figure 3.
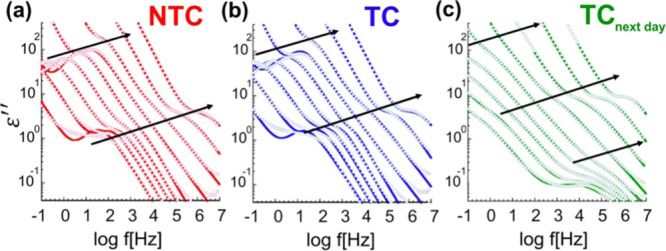
Dielectric loss data collected with the broadband spectrometer between 200 and 120 K for the (a) NTC, (b) TC, and (c) TCnext-day. The full lines indicate the fits with eq 1.
It is seen that the low-temperature relaxation behavior of NTC and TC is similar, whereas that of TCnext-day is altered. The two first samples show two apparent relaxation processes (see arrows in Figure 3). The main dynamic processes are the faster ones and were also observed at higher temperatures in the radiofrequency range. At lower frequencies, slower and more prominent relaxations become apparent once the DC conductivity contribution is sufficiently reduced. For the TCnext-day, the presence of the slower relaxation is not so clear and another fast relaxation becomes apparent at the lowest temperatures. The analysis of these relaxations has also been performed by fitting the data with eq 1. As one can appreciate in Figure 3, such an equation can reasonably describe the experimental data except at the lowest temperatures for both the NTC and TC samples. Here, even though the CC equation becomes too simplistic to describe the data, the main peak frequencies are rather well captured and can be used to evaluate the corresponding characteristic relaxation times. Hence, the extracted relaxation times, together with those obtained at the radiofrequency range, were used to build the Arrhenius plots shown in Figure 4a.
Figure 4.
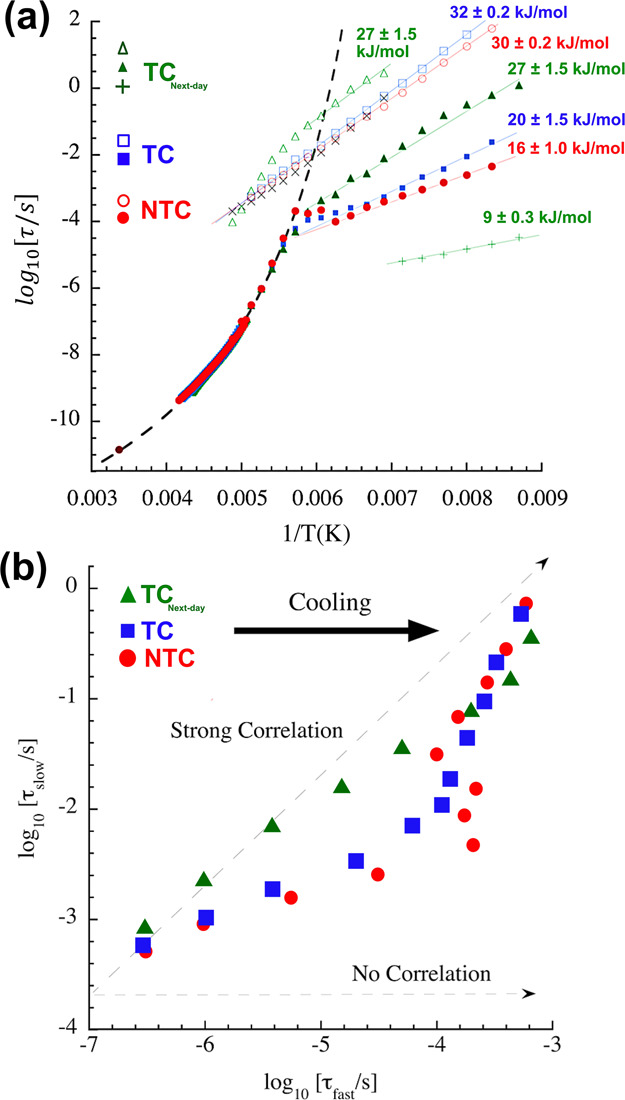
(a) Arrhenius representation of the characteristic times of the main dielectric relaxation process from the three samples investigated. The solid symbol at 0.0033 K–1 is a superposition of the data collected at room temperature in the microwave frequency range for the three samples. The dashed line corresponds to a VFT description, whereas solid lines show Arrhenius behaviors. The “x” symbols close to the slow relaxations from the NTC and TC depict the data from the dielectric relaxation of bulk water (ice) included for comparison purposes. (b) Correlation plot showing the log10(τslow) versus log10(τfast) for NTC, TC, and TCnext-day. The “strong correlation” line depicts a slope = 1 and is a reference for a proportional relation between the fast and slow processes represented in (a).
First, we shall discuss the temperature dependence of the main process initially observed at the radiofrequency range and further detected with the broadband spectrometer in all samples. The relaxation times for these processes are indicated as closed symbols in Figure 4a. At higher temperatures, NTC, TC, and TCnext-day show very similar dynamic behaviors following a Vogel–Fulcher–Tammann (VFT) temperature dependence.21 Comparable responses have been observed in aqueous solutions of polymers and biomolecules and are associated with strongly coupled motions between solvent and solutes. This indicates that the water molecules, under the influence of other cellular components, such as proteins and DNAs, give rise to this dynamic process.22 The dynamic similarity between the three samples at this temperature range leads to important observations, as follows. Given the TCnext-day result, we can disregard the influence of the integrity of the membrane structure on this process. Additionally, as a coupled dynamics system, this water relaxation ought to follow a very similar temperature dependence than that of the dissolved biomolecules themselves.22 In our case, as we will discuss in detail in the sequence, the relaxations from the cell components are only detected for the TCnext-day. However, we can still argue that the dynamical behavior from the cellular components other than water, or at least their contribution to this coupled motion, is the same regardless of whether the cells are alive or if they were treated with PTX. This is in full agreement with our previous inelastic neutron scattering experiments, where we showed that the frequencies and amplitudes of the vibrations from proteins in NTC and TC were similar.6
At lower temperatures, around 170–180 K, a crossover from non-Arrhenius to Arrhenius behavior is observed in the main relaxation for the three samples, indicating a transition from liquid-like to localized dynamics. Although the origin of this transition is still debated,22−24 we argue that the global motions from the cellular components undergo a glass transition, whereas the water molecules in close contact with the biological interfaces still experience single-particle motions.25 Here, the dynamic crossovers were observed at 180, 179, and 175 K for NTC, TC and TCnext-day, respectively. The slightly higher crossover temperature in the NTC might be considered as an indication that a distinct dynamic coupling between water and the solutes is found after the action of PTX.22 Nevertheless, acknowledging the small differences in the crossover temperatures, further evidence supporting this hypothesis is given along with a discussion on the activation energies and Cole–Cole broadening factor, α, of the motions.
As we mentioned, at temperatures below the dynamic crossover, the main dynamical processes show Arrhenius behaviors (log (τ) ∝ 1/T) with distinct activation energies obtained via τ = τ0exp(Eact/RT), where τ0 is a pre-factor, Eact is the activation energy of the relaxation, R is the universal gas constant, and T is the absolute temperature. The values obtained for NTC and TC are 16 ± 1 and 20 ± 1.5 kJ/mol, as also shown in Figure 4a. Here, the higher relaxation times (see Figure 4a) together with the higher activation energy determined for the TC reinforce the idea that the interactions between hydration water and the biological interfaces are changed by PTX. Concerning the Cole–Cole broadening factor, α, we found that it is slightly higher for the NTC (α ≈ 0.80) at temperatures below 170 K as compared with TC (α ≈ 0.70) and TCnext-day (α ≈ 0.68), indicating a higher occurrence of interactions between water dipoles and other cellular components after the action of the drug.19 For TCnext-day, a distinct faster process is detected below the dynamic crossover. This process is commonly detected in protein solutions26 and also follows an Arrhenius temperature dependence with a much lower activation energy of 9 ± 0.3 kJ/mol, demonstrating the presence of an additional single-particle dynamics not observed in the living cells.
As previously mentioned, the data collected with the broadband spectrometer at temperatures below 200 K also revealed the presence of slower relaxations in all samples. For these, the temperature dependences are shown as the open symbols in Figure 4a. For NTC and TC, this process presents dynamical behavior very similar to a dielectric relaxation detected in bulk-like water (ice Ih), whose temperature dependence is depicted by the “x” signals in Figure 4a (the dielectric response from pure water is presented in Figure S3a). Therefore, this relaxation can be ascribed to the fraction of water with minor interactions with the cellular components. A small increase in activation energy is detected for this process after treatment with PTX (from 30 ± 0.2 to 32 ± 0.2 kJ/mol) and, as shown in Figure S3b, the relaxation times for the TC are slightly higher than in the NTC and in pure water, indicating a change in the relaxation mechanism of this water population. This result is in good agreement with our previous thermal analyses that indicated a higher specific heat for the TC in comparison with the NTC at low temperatures.6
Turning to the analysis of TCnext-day, a change in behavior of the slow dynamics is clearly observed at temperatures around the dynamic crossover of the main relaxation process. Initially, the slow dynamics of this sample shows a temperature dependence whose linear extrapolation would lead to values of relaxation times around 100 s at 170–180 K. Therefore, we can infer that this relaxation is related to the α-like global relaxations of the system and these indeed undergo a glass transition around the crossover temperature. At lower temperatures, new motions become dominant and a deviation in the initial behavior occurs. In this case, given the high relaxation times, it is very unlikely that this motion is related to the fraction of water with minor interactions with the biological interfaces, as discussed for NTC and TC. Instead, it is more reasonable that collective motions from hydration water are observed.23 As the cells were exposed to nonideal conditions for a long period, an increase in the concentration of proteins related to cellular death is expected in the solution. Hence, in TCnext-day we could detect the additional fast dynamics at low temperatures as well as motions from the proteins themselves and the previously mentioned collective motions from hydration water.
A definitive picture of the origin of the detected dynamical processes is possible by the analyses presented in Figure 4b. A plot of ln(τslow) versus ln(τfast) is shown for all samples together with a “strong correlation” line (slope = 1), which is a reference for a proportional relation between the relaxation times.25
As discussed above, for NTC and TC, the slow process is directly related to events within the populations of water with minor interactions with the biological interfaces. Therefore, the weaker correlation at the higher temperatures confirms that the fast process is influenced by the dynamics of the several cellular components. After the dynamic crossover and the freezing of the dynamics from the cells’ components, the data points assume values closer to the strong correlation line, indicating that water is the major contributor in both processes. In TCnext-day, at temperatures below the dynamic crossover, the fast and slow relaxations are strongly correlated, confirming that the dynamics from the diverse biomolecules strongly influences both processes. The smooth deviation from the “strong correlation” line observed at lower temperatures indicates that although water is the main contributor in the fast process, the cellular components are still relevant in the slow relaxation.
3. Conclusions
By combining the present results with our previous neutron scattering experiments, a reasonable picture of the dynamical behavior of water in the MCF-7 cells after the action of PTX can be elucidated. Regarding the bulk-like water populations, the dynamic discrepancies between NTC and TC show a long-range character at room temperature and are only detectable by quasi-elastic neutron scattering that allows for spatial resolution of the motion. At low temperatures, however, differences in the relaxation process related to bulk-like water are detected as exposed by an increase in activation energy and relaxation times in TC as compared with NTC. The influence of these possible discrepancies in bulk-like water dynamics within the cells on the diffusivity of ionic species ought to be considered in future investigations. Regarding the dynamics from water populations in closer contact with the biological interfaces, we found that PTX leads to an increase in the activation energy of their single-particle motions as well as in their relaxation times. Interestingly, dynamical differences between NTC, TC, and even TCnext-day are only detected at temperatures below the glass transition of proteins and other biomolecules in the cells. Therefore, in the systems studied here, changes in water dynamics could be detected before changes in the overall dynamics of other cellular components could be observed. In the future, further experiments must be performed to establish if our findings are also observable in other cell lines as well as when treating cancer cells with other chemotherapeutic agents.
4. Materials and Methods
4.1. Cell Cultures
Breast cancer cells (MCF-7) were propagated in Petri dishes at 37 °C in Dulbecco’s Modified Eagles Medium (DMEM) supplemented with 10% fetal calf serum, 2 mM glutamine, 5000 IU/mL penicillin, and streptomycin in a humidified atmosphere containing 5% CO2. When the cells became about 50% confluent, they were washed with phosphate buffer saline (PBS: 10 mM Na2HPO4, 1.8 mM KH2PO4, 137 mM NaCl, 3 mM KCl, pH 7.4) and incubated in DMEM without serum. A part of the cells were then treated with paclitaxel (PTX) (LC Laboratories) with a final concentration of 15 nM for 24 h. The cells treated and not treated with PTX, NTC, and TC, respectively, were then dislodged with trypsin and transferred to DMEM-containing serum and washed with PBS by centrifugation (1000g, 10 min). The cells were then resuspended in 4 mL of DMEM with 10% DMSO (without serum), leading to a concentration of 3 × 10⁷ cells/mL. The cells were frozen and stored at −80 °C until use. The cell cultures are from the same batch as the ones described in ref (6), where a portion of the cells were thawed and investigated at room temperature for several hours with neutron spectroscopy. After these experiments, the viability of the cells was tested by staining with Trypan Blue (Sigma-Aldrich) and 70% of both TC and NTC were found to be viable. Based on these results, we inferred that the viabilities of the TC and NTC used here are similar or above 70% as they were rapidly taken out of the fridge, placed in the spectrometers, and studied at low temperatures. Representative optical microscopy images of the cells before and after treatment with paclitaxel are reported in ref (6).
4.2. Dielectric Spectra Collection
First, dielectric spectra of NTC and TC were collected at room temperature in the frequency range between 2 × 10⁷ and 5 × 10¹⁰ Hz using a Micro-Wave Dielectric Spectrometer (Keysight E8361A Microwave Network Analyzer). As the experiments at room temperature expose the cells to nonideal conditions, we also collected data for TC as a function of time to establish a time window in which we could safely handle the cells. We collected data after 15, 30, 45, 60, and 75 min and no considerable changes in the cells’ dielectric behavior were observed. Next, we also collected data after 12 h and, for this, a very slight change in dielectric behavior was detected. These results are presented as the Supporting Information in Figure S1, and, based on them, we inferred that the cells no longer had their membranes’ integrity after 12 h. The TC exposed to room temperature for 12 h were then named TCnext-day.
Sequentially, NTC, TC, and TCnext-day were analyzed in the radiofrequency range with a High-Frequency Dielectric Spectrometer (RF impedance analyzer Keysight E4991A) in the frequency range between 1 × 10⁶ and 3 × 10⁹ Hz and between room temperature and 203 K. A 1 K/min cooling rate was used, and the temperature was controlled by a Nitrogen-jet stream Quatro Cryosystem, Novocontrol, apparatus. Finally, NTC, TC, TCnext-day, and also pure water were analyzed in a Broad-Band Dielectric Spectrometer (high-resolution dielectric/impedance analyzer ALPHA-S—Novocontrol) in the frequency range between 1 × 10⁻² and 1 × 10⁷ Hz. The data were collected isothermally at temperatures between 205 and 115 K as also controlled by a Nitrogen-jet stream Quatro Cryosystem, Novocontrol, apparatus.
Acknowledgments
The authors thank Alexander B. Dinitzen and Rasmus Hartmann-Petersen for providing the cells. They acknowledge the financial support from the European Union’s Horizon 2020 research and innovation programme (grant agreement 731019—EUSMI). M.L.M. is funded by FAPEG (20171026700070) and CNPQ (205609/2014-7 and 300509/2017-0). S.A.I., AA, and J.C.L. also acknowledge the financial support from IT-1175-19 and Ministerio de Ciencia, Innovación y Universidades, project: PGC2018-094548-B-I00 (MCIU/AEI/FEDER UE).
Supporting Information Available
The Supporting Information is available free of charge at https://pubs.acs.org/doi/10.1021/acsomega.0c00897.
Additional DS data (PDF)
Author Present Address
⊥ Neutron Scattering Division, Oak Ridge National Laboratory, P.O. Box 2008 MS6455, Oak Ridge, Tennessee 37831, United States.
The authors declare no competing financial interest.
Supplementary Material
References
- Feng B.; Sosa R. P.; Mårtensson A. K. F.; Jiang K.; Tong A.; Dorfman K. D.; Takahashi M.; Lincoln P.; Bustamante C. J.; Westerlund F.; et al. Hydrophobic Catalysis and a Potential Biological Role of DNA Unstacking Induced by Environment Effects. Proc. Natl. Acad. Sci. U.S.A. 2019, 116, 17169–17174. 10.1073/pnas.1909122116. [DOI] [PMC free article] [PubMed] [Google Scholar]
- Bellissent-Funel M.-C.; Hassanali A.; Havenith M.; Henchman R.; Pohl P.; Sterpone F.; Van Der Spoel D.; Xu Y.; Garcia A. E. Water Determines the Structure and Dynamics of Proteins. Chem. Rev. 2016, 116, 7673–7697. 10.1021/acs.chemrev.5b00664. [DOI] [PMC free article] [PubMed] [Google Scholar]
- Mondal S.; Mukherjee S.; Bagchi B. Protein Hydration Dynamics: Much Ado about Nothing?. J. Phys. Chem. Lett. 2017, 8, 4878–4882. 10.1021/acs.jpclett.7b02324. [DOI] [PubMed] [Google Scholar]
- Jensen H. H.; Login F. H.; Koffman J. S.; Kwon T.-H.; Nejsum L. N. The Role of Aquaporin-5 in Cancer Cell Migration: A Potential Active Participant. Int. J. Biochem. Cell Biol. 2016, 79, 271–276. 10.1016/j.biocel.2016.09.005. [DOI] [PubMed] [Google Scholar]
- Johns H. E.; Cunningham J. R. The Physics of Radiology. Proc. R. Soc. Med. 1983, 55, 333–334. [Google Scholar]
- Martins M. L.; Dinitzen A. B.; Mamontov E.; Rudić S.; Pereira J. E. M.; Hartmann-Petersen R.; Herwig K. W.; Bordallo H. N. Water Dynamics in MCF-7 Breast Cancer Cells: A Neutron Scattering Descriptive Study. Sci. Rep. 2019, 9, 8704. 10.1038/s41598-019-45056-8. [DOI] [PMC free article] [PubMed] [Google Scholar]
- Marques M. P. M.; Batista De Carvalho A. L. M.; Sakai V. G.; Hatter L.; Batista De Carvalho L. A. E. Intracellular water - an overlooked drug target? Cisplatin impact in cancer cells probed by neutrons. Phys. Chem. Chem. Phys. 2017, 19, 2702–2713. 10.1039/c6cp05198g. [DOI] [PubMed] [Google Scholar]
- Marques M. P. M.; Batista de Carvalho A. L. M.; Mamede A. P.; Rudić S.; Dopplapudi A.; García Sakai V.; Batista de Carvalho L. A. E. Intracellular Water as a Mediator of Anticancer Drug Action. Int. Rev. Phys. Chem. 2020, 39, 67–81. 10.1080/0144235x.2020.1700083. [DOI] [Google Scholar]
- Laage D.; Elsaesser T.; Hynes J. T. Water Dynamics in the Hydration Shells of Biomolecules. Chem. Rev. 2017, 117, 10694–10725. 10.1021/acs.chemrev.6b00765. [DOI] [PMC free article] [PubMed] [Google Scholar]
- Martins M. L.; et al. Probing the dynamics of complexed local anesthetics via neutron scattering spectroscopy and DFT calculations. Int. J. Pharm. 2017, 524, 397–406. 10.1016/j.ijpharm.2017.03.051. [DOI] [PubMed] [Google Scholar]
- Martins M. L.; Ignazzi R.; Eckert J.; Watts B.; Kaneno R.; Zambuzzi W. F.; Daemen L.; Saeki M. J.; Bordallo H. N. Restricted Mobility of Specific Functional Groups Reduces Anti-Cancer Drug Activity in Healthy Cells. Sci. Rep. 2016, 6, 22478. 10.1038/srep22478. [DOI] [PMC free article] [PubMed] [Google Scholar]
- Martins M. L.; Orecchini A.; Aguilera L.; Eckert J.; Embs J.; Matic A.; Saeki M. J.; Bordallo H. N. Encapsulation of Paclitaxel into a Bio-Nanocomposite. A Study Combining Inelastic Neutron Scattering to Thermal Analysis and Infrared Spectroscopy. EPJ Web Conf. 2015, 83, 02011. 10.1051/epjconf/20158302011. [DOI] [Google Scholar]
- Fan W. Possible Mechanisms of Paclitaxel-Induced Apoptosis. Biochem. Pharmacol. 1999, 57, 1215–1221. [DOI] [PubMed] [Google Scholar]
- Wolf M.; Gulich R.; Lunkenheimer P.; Loidl A. Broadband Dielectric Spectroscopy on Human Blood. Biochim. Biophys. Acta, Gen. Subj. 2011, 1810, 727–740. 10.1016/j.bbagen.2011.05.012. [DOI] [PubMed] [Google Scholar]
- Asami K. Characterization of Biological Cells by Dielectric Spectroscopy. J. Non-Cryst. Solids 2002, 305, 268–277. 10.1016/s0022-3093(02)01110-9. [DOI] [Google Scholar]
- Asami K. Low-Frequency Dielectric Dispersion of Bacterial Cell Suspensions. Colloids Surf., B 2014, 119, 1–5. 10.1016/j.colsurfb.2014.04.014. [DOI] [PubMed] [Google Scholar]
- Bergman R.; Swenson J. Dynamics of Supercooled Water in Confined Geometry. Nature 2000, 403, 283–286. 10.1038/35002027. [DOI] [PubMed] [Google Scholar]
- Debenedetti P. G. Supercooled and Glassy Water. J. Phys.: Condens. Matter 2003, 15, R1669. 10.1088/0953-8984/15/45/r01. [DOI] [Google Scholar]
- Valerica Raicu Y. F. In Dielectric Relaxation in Biological Systems: Physical Principles, Methods, and Applications, 1st ed.; Valerica Raicu Y. F., Ed.; Oxford: Oxford, 2015. [Google Scholar]
- Prodan E.; Prodan C.; Miller J. H. The Dielectric Response of Spherical Live Cells in Suspension: An Analytic Solution. Biophys. J. 2008, 95, 4174–4182. 10.1529/biophysj.108.137042. [DOI] [PMC free article] [PubMed] [Google Scholar]
- Cangialosi D.; Boucher V. M.; Alegría A.; Colmenero J. Direct Evidence of Two Equilibration Mechanisms in Glassy Polymers. Phys. Rev. Lett. 2013, 111, 095701. 10.1103/physrevlett.111.095701. [DOI] [PubMed] [Google Scholar]
- Cerveny S.; Swenson J. Water Dynamics in the Hydration Shells of Biological and Non-Biological Polymers. J. Chem. Phys. 2019, 150, 234904. 10.1063/1.5096392. [DOI] [PubMed] [Google Scholar]
- Bruni F.; Mancinelli R.; Ricci M. A. Multiple relaxation processes versus the fragile-to-strong transition in confined water. Phys. Chem. Chem. Phys. 2011, 13, 19773–19779. 10.1039/c1cp22029b. [DOI] [PubMed] [Google Scholar]
- Cerveny S.; Colmenero J.; Alegría A. Comment on ‘pressure dependence of fragile-to-strong transition and a possible second critical point in supercooled confined water’. Phys. Rev. Lett. 2006, 97, 189802. 10.1103/physrevlett.97.189802. [DOI] [PubMed] [Google Scholar]
- Cerveny S.; Alegría Á.; Colmenero J. Universal features of water dynamics in solutions of hydrophilic polymers, biopolymers, and small glass-forming materials. Phys. Rev. E: Stat., Nonlinear, Soft Matter Phys. 2008, 77, 031803. 10.1103/physreve.77.031803. [DOI] [PubMed] [Google Scholar]
- Jansson H.; Swenson J. The protein glass transition as measured by dielectric spectroscopy and differential scanning calorimetry. Biochim. Biophys. Acta, Proteins Proteomics 2010, 1804, 20–26. 10.1016/j.bbapap.2009.06.026. [DOI] [PubMed] [Google Scholar]
Associated Data
This section collects any data citations, data availability statements, or supplementary materials included in this article.


