

Abstract
Single nucleotide polymorphisms (SNPs) in the genes coding for leptin (LEP) and its receptor (LEPR) might regulate energy balance and be implicated in the development of colorectal cancer (CRC). In the present investigation, 1,003 CRC cases and 1,303 matched controls was compared. Five functional SNPs in LEP and LEPR genes were chosen to evaluate the correlation of these chosen SNPs with CRC susceptibility. We used the SNPscanTM genotyping assay to genotype LEP and LEPR SNPs. A significantly decreased risk of CRC was found to be associated with the LEPR rs6588147 polymorphism (GA vs. GG: crude P=0.007 and GA/AA vs. GG: crude P=0.018). With adjustments for risk factors (e.g. age, gender, drinking, BMI and smoking), these associations were not changed. In subgroup analyses, the association of LEP rs2167270 with a decreased risk of CRC was found in the ≥61 years old subgroup. For LEPR rs1137100, the association of this SNP with an increased susceptibility of CRC was found in the BMI <24 kg/m2 subgroup. In subgroup analyses for LEPR rs6588147, we identified that this locus also decreased the susceptibility of CRC in the male subgroup, <61 years old subgroup, never smoking subgroup and never drinking subgroup. For LEPR rs1137101, the relationship of this polymorphism with a decreased susceptibility to CRC was found in the never drinking subgroup. In summary, the present study highlights that LEPR rs6588147, rs1137101 and LEP rs2167270 may decrease the risk of CRC. However, LEPR rs1137100 is associated with susceptibility to CRC. Further case-control studies with larger sample sizes should be conducted to validate our findings.
Keywords: LEP/LEPR, polymorphisms, colorectal cancer, single nucleotide polymorphisms
Introduction
Obesity and/or overweight are common public health issues all over the world [1,2]. Several investigations have focused on the correlation of obesity and overweight with colorectal cancer (CRC) [3-7]. Some studies have reported that obesity and overweight are risk factor for the development of CRC [3,8-10]. Among CRC cases, obesity and overweight may influence the survival of CRC patients [9,11,12].
The intake of excess calories contributes to the development of overweight and obesity, which is considered to be controlledby important molecular mechanisms and pathways [e.g. leptin (LEP), LEP receptor (LEPR), insulin, microRNA expression and DNA methylation] [5,7]. LEP is produced by adipocytes. It has been reported that the level of LEP is increased in obese and overweight individuals [13]. LEP has been found to be associated with both appetite and body weight [14,15]. LEP binds with the LEPR and plays a significant role in energy metabolism in the body [16]. Previous investigations have reported that LEP and LEPR are associated with the development of colorectal cancer, and could be used as important therapy targetsin CRC [17]. Ho et al. reported that a high level of LEP conferred a susceptibility to the development of CRC [18]. Song et al. found that the level of soluble LEPR in the plasma was significantly associated with an increased risk of rectal cancer [19]. These previous studies showed that the LEP/LEPR pathway may be implicated in the occurrence of CRC.
A study has suggested that the rs1137101 A>G (Gln223Arg) single nucleotide polymorphisms (SNPs) in the LEPR gene are correlated with obesity [20]. Another investigation also found that LEPR rs1137100 G>A (Arg109Lys) and LEP rs7799039 G>A (-2548 G/A) polymorphisms were related to the level of LEP and the development of obesity [21]. Dasgupta et al. reported that the LEP variants rs2167270 A allele and rs7799039 A allele were independently associated with the susceptibility to obesity [22]. Nock et al. also showed an association of LEPR rs6588147 SNP to physical activity and food intake [23]. SNPs in LEP and LEPR genes have also been explored for their relationship to the etiology of CRC. Some case-control studies have suggested that the rs2167270 A (19A) allele of the LEP gene might be a protective factor for the occurrence of CRC [24,25]. A meta-analysis indicated that LEP rs7799039 G>A SNP might decrease the susceptibility to CRC [26]. The LEPR Gln223Arg SNP was found to be associated with the tumor stage of CRC [27], and Slattery et al. reported that the combination of LEP rs2167270 GG and LEPR rs6588147 GG genotypes had a tendency to be associated with a decreased CRC risk [24]. However, these observations were not studied in Asians. In addition, the association between LEPR rs1137100 G>A (Arg109Lys) and the risk of CRC is unknown.
Here we report our evaluation of the correlation between LEP rs2167270 G>A, rs7799039 A>G, LEPR rs6588147 G>A, rs1137100 G>A, and rs1137101 G>A SNPs with the susceptibility to CRC. We recruited 2,306 participants from eastern China. Additionally, we assessed whether the CRC correlations with these SNPs were influenced by some risk factors [e.g. body mass index (BMI), age, gender, smoking and drinking].
Materials and methods
Subjects
This study was carried out with 1,003 CRC cases (mean age 61.10 ± 12.17 years) and 1,303 cancer-free controls (mean age 61.40 ± 9.61 years). The CRC cases were recruited from the Department of General Surgery at the Union Clinical Medical College of Fujian Medical University (Fuzhou City, China) and the Clinical Medical College of Jiangsu University (Zhenjiang City, China) between 2014-2017. CRC patients were diagnosed by two pathologists. Our investigation was performed after gaining the approval of the ethics committee of Fujian Medical University. Additionally, before recruitment, a written informed consent was also obtained from each participant. We collected the clinical data from their medical records where we also selected some important risk factors (e.g. gender, age of onset, BMI, tobacco consumption and drinking). In this study, we matched age and gender in the two groups.
DNA extraction and genotyping
We collected 2 ml blood samples from each participant and stored it at -80°C. Leukocytes was harvested to extract and purify DNA according to manual of Promega DNA Kit (Promega, Madison, USA). A NanoDrop ND-1000 spectrophotometer was used to measure the quality of obtained DNA. We used the SNPscanTM genotyping method to obtain the genotypes of the LEP and LEPR SNPs. Ninety-two (4%) of the DNA samples were randomly selected and a second technician repeated the polymerase chain reaction process. The retested genotypes were found to be accurate.
Statistical analysis
We used SAS 9.4 software (SAS Institute, Cary, NC) to analyze the data. The distribution of the LEP and LEPR genotypes in controls was evaluated to determine whether they were consistent with a Hardy-Weinberg equilibrium (HWE) by using an online calculator (http://ihg.gsf.de/cgi-bin/hw/hwa1.pl) [28-32]. Chi-square (χ2) or a Fisher’s exact test were used to compare the differences of LEP and LEPR genotypes. Continuous variables were expressed as mean ± standard deviation. The differences in continuous variables were analyzed by a Student’s t-test. The distribution of categorical variables [e.g. age, sex, body mass index (BMI), smoking status, alcohol consumption, and LEP and LEPR genotypes] was compared by χ2 or a Fisher’s exact test. A P<0.05 was consider significant.
Results
Characteristics
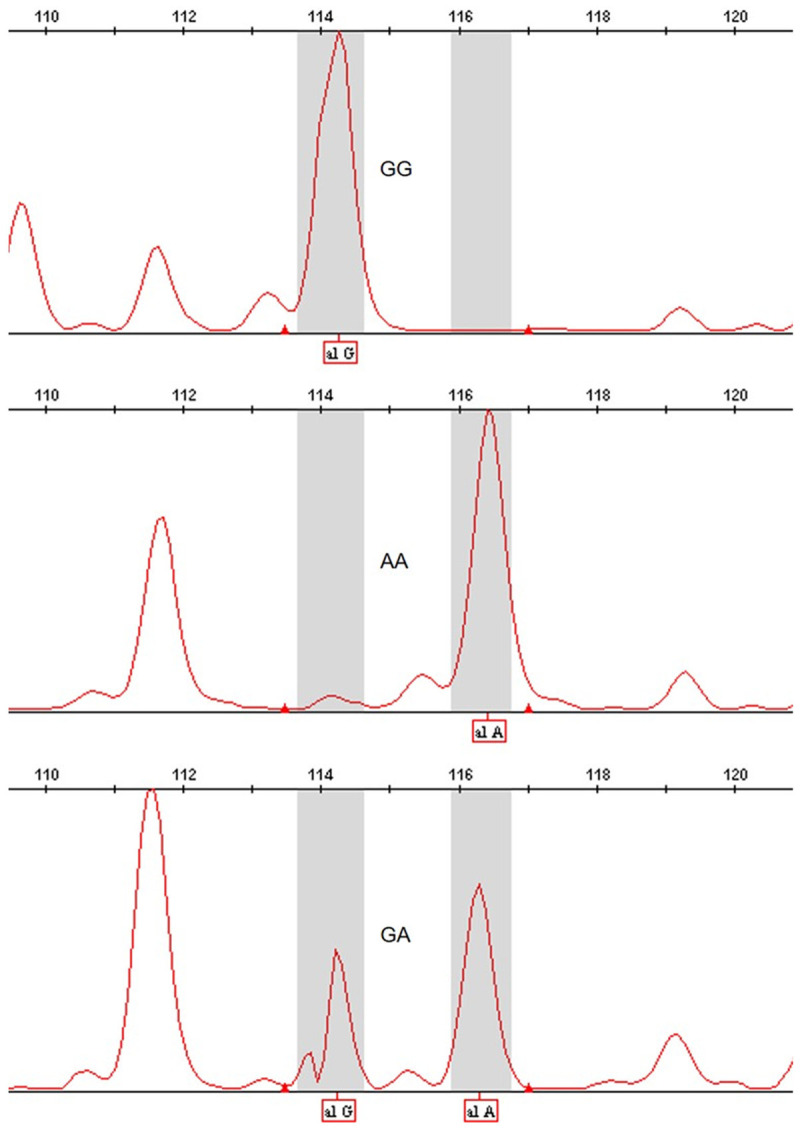
There were 2,306 participants (1,003 CRC cases and 1,303 cancer-free controls) included in this investigation. Table 1 summarizes the distribution of age, gender, BMI, smoking status, and alcohol consumption between the two groups. In the current study, the distribution by age [number of CRC cases/controls (<61 years vs. ≥61 years): 451/552 vs. 600/703, P=0.605], gender [number of cases vs. controls (male/female): 620/383 vs. 801/502, P=0.867] were not significantly different. However, the distribution by BMI [number of cases vs. controls (<24 kg/m2/≥24 kg/m2): 670/333 vs. 688/615, P<0.001], smoking status [number of cases vs. controls (never/ever): 774/259 vs. 1,038/265, P=0.002] and alcohol consumption [number of cases vs. controls (never/ever): 829/174 vs. 1,167/136, P<0.001] were significantly different. Table 2 contains the information in the database and our results for LEP and LEPR SNPs. The success rate for identifying LEP and LEPR SNPs genotyping was excellent (>98%). The minor allele frequency (MAF) of LEP and LEPR SNPs is also shown in Table 2. For the included LEP and LEPR loci in controls, the distribution of variants was consistent with the HWE. The sequencing results of each of the SNPs were showed in Figures 1, 2, 3, 4, 5 and 6.
Table 1.
Distribution of selected characteristics in CRC cases and controls
| Variable | Cases (n=1,003) | Controls (n=1,303) | P a | ||
|---|---|---|---|---|---|
|
|
|
||||
| n | % | n | % | ||
| Age (years), mean (± SD) | 61.10 ± 12.17 | 61.40 ± 9.61 | 0.496 | ||
| Age (years) | 0.605 | ||||
| <61 | 451 | 44.97 | 600 | 46.05 | |
| ≥61 | 552 | 55.03 | 703 | 53.95 | |
| Sex | 0.867 | ||||
| Male | 620 | 61.81 | 801 | 61.47 | |
| Female | 383 | 38.19 | 502 | 38.53 | |
| Smoking status | 0.002 | ||||
| Never | 744 | 74.18 | 1038 | 79.66 | |
| Ever | 259 | 25.82 | 265 | 20.34 | |
| Alcohol use | <0.001 | ||||
| Never | 829 | 82.65 | 1,167 | 89.56 | |
| Ever | 174 | 17.35 | 136 | 10.44 | |
| BMI (kg/m2) | |||||
| <24 | 670 | 66.80 | 688 | 52.80 | <0.001 |
| ≥24 | 333 | 33.20 | 615 | 47.20 | |
| Site of tumor | |||||
| Colon cancer | 431 | 42.97 | |||
| Rectum cancer | 572 | 57.03 | |||
Two-sided χ2 test and student t-test;
Bold values are statistically significant (P<0.05).
Table 2.
Primary information for LEP rs2167270 G>A, rs7799039 A>G, LEPR rs6588147 G>A, rs1137100 G>A and rs1137101 G>A polymorphisms
| Genotyped SNPs | Chromosome | Chr Pos (NCBI Build 37) | Region | MAFa for Chinese in database | MAF in our controls (n=1,303) | P value for HWEb test in our controls | Genotyping method | Genotyping value (%) |
|---|---|---|---|---|---|---|---|---|
| LEP rs7799039 A>G | 7 | 127878783 | Promoter | 0.201 | 0.271 | 0.520 | SNPscan | 98.87 |
| LEP rs2167270 G>A | 7 | 127881349 | 5’UTR | 0.175 | 0.228 | 0.185 | SNPscan | 98.87 |
| LEPR rs1137100 G>A | 1 | 66036441 | Exon 4 | 0.169 | 0.155 | 0.852 | SNPscan | 98.87 |
| LEPR rs1137101 G>A | 1 | 66058513 | Exon 6 | 0.111 | 0.124 | 0.783 | SNPscan | 98.83 |
| LEPR rs6588147 G>A | 1 | 65935494 | Intron 2 | 0.150 | 0.155 | 0.028 | SNPscan | 98.87 |
MAF: minor allele frequency.
HWE: Hardy-Weinberg equilibrium.
Figure 1.
LEPR rs1137101 G>A SNPs, GG, AA, GA from top to bottom.
Figure 2.

LEPR rs2167270 G>A SNPs, GG, AA, GA from top to bottom.
Figure 3.
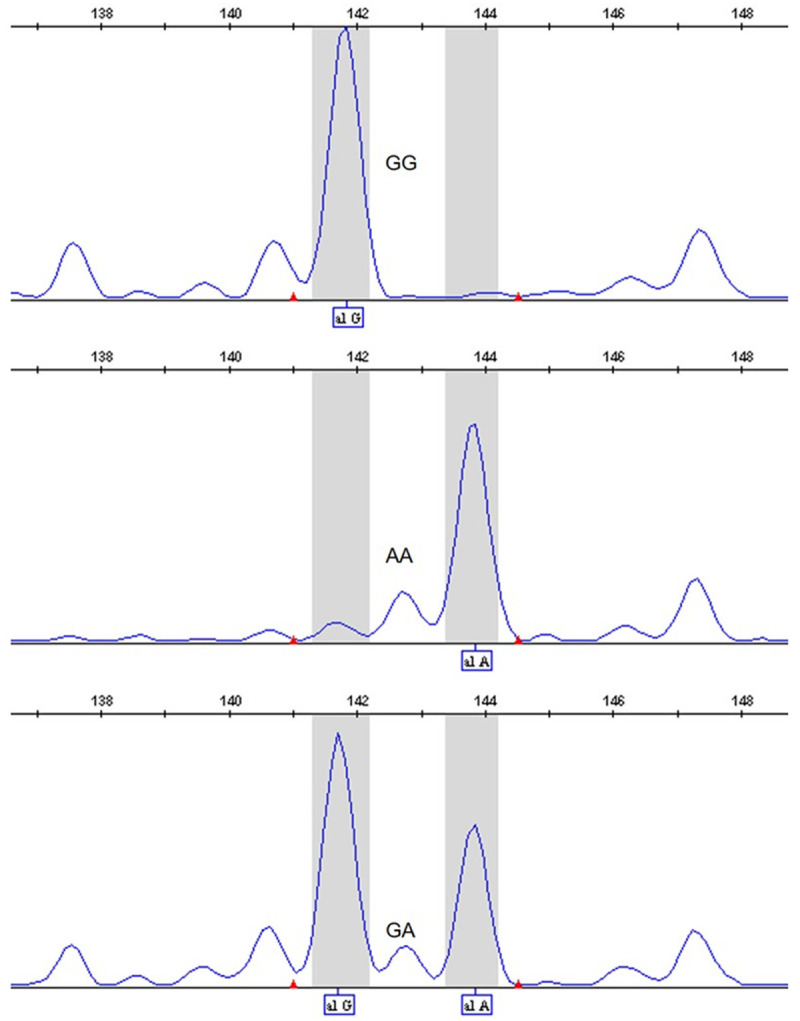
LEPR rs7799039 A>G SNPs, GG, AA, GA from top to bottom.
Figure 4.

LEPR rs6588147 G>A SNPs, GG, AA, GA from top to bottom.
Figure 5.

LEPR rs1137100 G>A SNPs, GG, AA, GA from top to bottom.
Figure 6.

Using the SNPscanTM genotyping method to obtain the genotypes of LEP and LEPR SNPs. the sequencing results of each of the SNPs. *; number of miss cases in Cases =23, **; number of miss cases in Controls =3.
Association of LEP and LEPR polymorphisms with the development of CRC
The occurrence of the genotypes of the LEPR rs6588147 locus were 735 (GG), 229 (GA) and 16 (AA) in the CRC cases and 917 (GG), 362 (GA) and 21 (AA) in controls. When we compared LEPR rs6588147 GA to GG, a significantly decreased occurence of the LEPR rs6588147 GA genotype was associated with the development of CRC (crude OR=0.77, 95% CI, 0.63-0.93, P=0.007). We also compared the LEPR rs6588147 GA/AA genotype to the GG genotype and found a protective role for the GA/AA genotype against the development of CRC (crude OR=0.80, 95% CI, 0.66-0.96, P=0.018). When we made adjustments for included risk factors (e.g. age, gender, drinking, BMI, and smoking), these associations were not changed (GA vs. GG: adjusted OR, 0.77; 95% CI, 0.63-0.93; P=0.007 and AA/GA vs. GG: adjusted OR, 0.79; 95% CI, 0.66-0.96; P=0.018; Table 3).
Table 3.
Logistic regression analyses of association between LEP rs2167270 G>A, rs7799039 A>G, LEPR rs6588147 G>A, rs1137100 G>A and rs1137101 G>A SNPs and risk of CRC
| Genotype | Cases (n=1,003) | Controls (n=1,303) | Crude OR (95% CI) | P | Adjusted ORa (95% CI) | P | ||
|---|---|---|---|---|---|---|---|---|
|
|
|
|||||||
| n | % | n | % | |||||
| LEP rs7799039 A>G | ||||||||
| AA | 521 | 53.16 | 686 | 52.77 | 1.00 | 1.00 | ||
| AG | 394 | 40.20 | 523 | 40.23 | 0.95 (0.80-1.13) | 0.594 | 0.96 (0.81-1.15) | 0.658 |
| GG | 65 | 6.63 | 91 | 7.00 | 0.91 (0.65-1.27) | 0.562 | 0.87 (0.62-1.23) | 0.432 |
| AG+GG | 459 | 46.84 | 614 | 47.23 | 0.98 (0.83-1.16) | 0.852 | 0.99 (0.83-1.17) | 0.872 |
| AA+AG | 915 | 93.37 | 1209 | 93.00 | 1.00 | 1.00 | ||
| GG | 65 | 6.63 | 91 | 7.00 | 0.94 (0.68-1.31) | 0.732 | 0.91 (0.65-1.27) | 0.565 |
| G allele | 524 | 26.73 | 705 | 27.12 | ||||
| LEP rs2167270 G>A | ||||||||
| GG | 589 | 60.10 | 767 | 59.00 | 1.00 | 1.00 | ||
| GA | 340 | 34.69 | 474 | 36.46 | 0.90 (0.76-1.08) | 0.251 | 0.91 (0.76-1.09) | 0.300 |
| AA | 51 | 5.20 | 59 | 4.54 | 1.09 (0.74-1.61) | 0.673 | 1.06 (0.71-1.57) | 0.787 |
| GA+AA | 391 | 39.90 | 533 | 41.00 | 0.96 (0.81-1.13) | 0.596 | 0.96 (0.81-1.14) | 0.641 |
| GG+GA | 929 | 94.80 | 1241 | 95.46 | 1.00 | 1.00 | ||
| AA | 51 | 5.20 | 59 | 4.54 | 1.16 (0.79-1.70) | 0.463 | 1.12 (0.76-1.66) | 0.574 |
| A allele | 442 | 22.55 | 592 | 22.77 | ||||
| LEPR rs6588147 G>A | ||||||||
| GG | 735 | 75.00 | 917 | 70.54 | 1.00 | 1.00 | ||
| GA | 229 | 23.37 | 362 | 27.85 | 0.77 (0.63-0.93) | 0.007 | 0.77 (0.63-0.93) | 0.007 |
| AA | 16 | 1.63 | 21 | 1.62 | 0.93 (0.48-1.79) | 0.816 | 0.89 (0.46-1.74) | 0.740 |
| GA + AA | 245 | 25.00 | 383 | 29.46 | 0.80 (0.66-0.96) | 0.018 | 0.79 (0.66-0.96) | 0.018 |
| GG+GA | 964 | 98.37 | 1279 | 98.38 | 1.00 | 1.00 | ||
| AA | 16 | 1.63 | 21 | 1.62 | 1.01 (0.53-1.95) | 0.974 | 0.98 (0.50-1.90) | 0.944 |
| A allele | 261 | 13.32 | 404 | 15.54 | ||||
| LEPR rs1137100 G>A | ||||||||
| GG | 667 | 68.06 | 914 | 70.91 | 1.00 | 1.00 | ||
| GA | 289 | 29.49 | 351 | 27.23 | 1.09 (0.91-1.32) | 0.338 | 1.09 (0.90-1.31) | 0.379 |
| AA | 24 | 2.45 | 35 | 1.86 | 0.91 (0.54-1.55) | 0.731 | 0.88 (0.52-1.50) | 0.642 |
| GA+AA | 313 | 31.94 | 375 | 29.09 | 1.11 (0.93-1.33) | 0.250 | 1.10 (0.92-1.32) | 0.293 |
| GG+GA | 956 | 97.55 | 1265 | 98.14 | 1.00 | 1.00 | ||
| AA | 24 | 2.45 | 35 | 1.86 | 0.91 (0.54-1.54) | 0.719 | 0.88 (0.52-1.50) | 0.638 |
| A allele | 337 | 17.19 | 399 | 15.48 | ||||
| LEPR rs1137101 G>A | ||||||||
| GG | 760 | 76.85 | 995 | 76.60 | 1.00 | 1.00 | ||
| GA | 205 | 20.73 | 285 | 21.94 | 0.92 (0.75-1.12) | 0.407 | 0.92 (0.75-1.13) | 0.435 |
| AA | 15 | 2.43 | 19 | 1.46 | 1.01 (0.51-2.00) | 0.983 | 1.01 (0.50-2.02) | 0.983 |
| GA+AA | 229 | 2.43 | 304 | 23.40 | 0.95 (0.78-1.15) | 0.593 | 0.95 (0.78-1.16) | 0.630 |
| GG+GA | 965 | 23.15 | 1280 | 98.54 | 1.00 | 1.00 | ||
| AA | 15 | 2.43 | 19 | 1.46 | 1.05 (0.53-2.07) | 0.894 | 1.05 (0.52-2.10) | 0.894 |
| A allele | 253 | 12.79 | 323 | 12.43 | ||||
Adjusted for age, sex, smoking status, alcohol use and BMI.
Bold values are statistically significant (P<0.05).
When we focused on the potential correlation of the rs2167270, rs7799039, rs1137100 and rs1137101 loci with the occurrence of CRC, we found a null association between them (Table 3).
Association of LEP and LEPR polymorphisms with the development of CRC in subgroup analysis
The LEP rs7799039 genotype frequency in subgroup analysis are shown in Table 4. No association of rs7799039 with the risk of CRC was found in any subgroup.
Table 4.
Stratified analyses between LEP rs7799039 A>G polymorphism and CRC risk by sex, age, smoking status and alcohol consumption
| Variable | LEP rs7799039 A>G (case/control)a | Adjusted ORb (95% CI); P | ||||||
|---|---|---|---|---|---|---|---|---|
|
|
|
|||||||
| AA | AG | GG | AA | AG | GG | AG/GG | GG vs. (AG/AA) | |
| Sex | ||||||||
| Male | 322/415 | 238/328 | 44/56 | 1.00 | 0.91 (0.73-1.14); P: 0.398 | 0.95 (0.62-1.46); P: 0.814 | 0.96 (0.77-1.19); P: 0.694 | 1.02 (0.67-1.54); P: 0.944 |
| Female | 199/271 | 156/195 | 21/35 | 1.00 | 1.02 (0.77-1.36); P: 0.871 | 0.73 (0.41-1.31); P: 0.294 | 1.01 (0.77-1.33); P: 0.960 | 0.74 (0.42-1.30); P: 0.295 |
| Age | ||||||||
| <61 | 229/329 | 182/228 | 32/41 | 1.00 | 1.16 (0.89-1.51); P: 0.266 | 1.11 (0.67-1.85); P: 0.678 | 1.19 (0.92-1.53); P: 0.183 | 1.06 (0.65-1.74); P: 0.810 |
| ≥61 | 292/357 | 212/295 | 33/50 | 1.00 | 0.83 (0.66-1.05); P: 0.128 | 0.71 (0.44-1.14); P: 0.158 | 0.85 (0.68-1.07); P: 0.174 | 0.79 (0.50-1.26); P: 0.321 |
| Smoking status | ||||||||
| Never | 391/548 | 291/414 | 46/73 | 1.00 | 0.96 (0.79-1.18); P: 0.723 | 0.87 (0.58-1.29); P: 0.478 | 0.98 (0.81-1.19); P: 0.873 | 0.90 (0.61-1.32); P: 0.585 |
| Ever | 130/138 | 103/109 | 19/18 | 1.00 | 0.96 (0.67-1.38); P: 0.830 | 0.92 (0.45-1.84); P: 0.803 | 1.01 (0.71-1.43); P: 0.974 | 0.96 (0.48-1.89); P: 0.899 |
| Alcohol consumption | ||||||||
| Never | 433/609 | 326/474 | 51/81 | 1.00 | 0.93 (0.77-1.12); P: 0.459 | 0.85 (0.58-1.24); P: 0.391 | 0.96 (0.80-1.15); P: 0.621 | 0.89 (0.62-1.29); P: 0.548 |
| Ever | 88/77 | 68/49 | 14/10 | 1.00 | 1.17 (0.72-1.90); P: 0.525 | 1.05 (0.43-2.53); P: 0.916 | 1.20 (0.76-1.90); P: 0.441 | 1.01 (0.43-2.38); P: 0.989 |
| BMI (kg/m2) | ||||||||
| <24 | 338/373 | 271/261 | 47/52 | 1.00 | 1.10 (0.88-1.38); P: 0.391 | 0.92 (0.61-1.41); P: 0.715 | 1.11 (0.90-1.38); P: 0.332 | 0.90 (0.60-1.37); P: 0.633 |
| ≥24 | 183/313 | 123/262 | 18/39 | 1.00 | 0.76 (0.58-1.01); P: 0.061 | 0.79 (0.44-1.43); P: 0.439 | 0.80 (0.61-1.06); P: 0.115 | 0.91 (0.51-1.63); P: 0.756 |
For LEP rs7799039 A>G, the genotyping was successful in 980 (97.71%) CRC cases, and 1,300 (99.77%) controls;
Adjusted for multiple comparisons [age, sex, BMI, smoking status and alcohol consumption (besides stratified factors accordingly)] in a logistic regression model.
Table 5 shows the LEP rs2167270 genotype frequency in subgroup analysis. When we adjusted the potential risk factors (e.g. age, gender, drinking, BMI and smoking), the association of LEP rs2167270 with a decreased risk of CRC was found in the ≥61 year old subgroup (GA vs. GG adjusted OR=0.78, 95% CI, 0.61-0.99, P=0.042).
Table 5.
Stratified analyses between LEP rs2167270 G>A polymorphism and CRC risk by sex, age, smoking status and alcohol consumption
| Variable | LEP rs2167270 G>A (case/control)a | Adjusted ORb (95% CI); P | ||||||
|---|---|---|---|---|---|---|---|---|
|
|
|
|||||||
| GG | GA | AA | GG | GA | AA | GA/AA | AA vs. (GA/GG) | |
| Sex | ||||||||
| Male | 362/467 | 207/294 | 35/38 | 1.00 | 0.88 (0.70-1.11); P: 0.274 | 1.13 (0.69-1.84); P: 0.624 | 0.95 (0.76-1.18); P: 0.634 | 1.21 (0.75-1.97); P: 0.429 |
| Female | 227/300 | 133/180 | 16/21 | 1.00 | 0.93 (0.70-1.25); P: 0.641 | 0.92 (0.46-1.82); P: 0.803 | 0.96 (0.72-1.26); P: 0.751 | 0.96 (0.49-1.88); P: 0.898 |
| Age | ||||||||
| <61 | 261/369 | 158/204 | 24/25 | 1.00 | 1.12 (0.86-1.47); P: 0.394 | 1.39 (0.76-2.53); P: 0.282 | 1.18 (0.91-1.53); P: 0.205 | 1.35 (0.75-2.44); P: 0.315 |
| ≥61 | 328/398 | 182/270 | 27/34 | 1.00 | 0.78 (0.61-0.99); P: 0.042 | 0.86 (0.50-1.46); P: 0.569 | 0.82 (0.65-1.04); P: 0.097 | 0.97 (0.57-1.64); P: 0.899 |
| Smoking status | ||||||||
| Never | 437/609 | 255/379 | 36/47 | 1.00 | 0.93 (0.76-1.14); P: 0.476 | 1.05 (0.67-1.66); P: 0.824 | 0.97 (0.80-1.19); P: 0.790 | 1.11 (0.70-1.74); P: 0.665 |
| Ever | 152/158 | 85/95 | 15/12 | 1.00 | 0.87 (0.60-1.26); P: 0.452 | 1.10 (0.49-2.44); P: 0.823 | 0.93 (0.65-1.34); P: 0.711 | 1.19 (0.54-2.62); P: 0.670 |
| Alcohol consumption | ||||||||
| Never | 489/685 | 282/425 | 39/54 | 1.00 | 0.91 (0.75-1.10); P: 0.325 | 0.97 (0.63-1.50); P: 0.891 | 0.95 (0.79-1.14); P: 0.565 | 1.03 (0.67-1.58); P: 0.901 |
| Ever | 100/82 | 58/49 | 12/5 | 1.00 | 0.96 (0.59-1.56); P: 0.857 | 1.78 (0.59-5.30); P: 0.304 | 1.07 (0.67-1.71); P: 0.768 | 1.85 (0.63-5.43); P: 0.265 |
| BMI (kg/m2) | ||||||||
| <24 | 390/ | 230/ | 36/34 | 1.00 | 0.98 (0.78-1.23); P: 0.852 | 1.06 (0.65-1.73); P: 0.819 | 1.02 (0.82-1.27); P: 0.860 | 1.09 (0.67-1.77); P: 0.729 |
| ≥24 | 199/354 | 110/235 | 15/25 | 1.00 | 0.81 (0.61-1.08); P: 0.144 | 1.05 (0.54-2.06); P: 0.879 | 0.87 (0.66-1.14); P: 0.310 | 1.17 (0.61-2.27); P: 0.633 |
For LEP rs2167270 G>A,the genotyping was successful in 980 (97.71%) CRC cases, and 1,300 (99.77%) controls;
Adjusted for multiple comparisons [age, sex, BMI, smoking status and alcohol consumption (besides stratified factors accordingly)] in a logistic regression model.
Bold value is statistically significant (P<0.05).
For LEPR rs1137100, the association of this SNP with an increased susceptibility of CRC was found in the BMI <24 kg/m2 subgroup (GA/AA vs. GG adjusted OR=1.29, 95% CI, 1.02-1.63, P=0.036, Table 6).
Table 6.
Stratified analyses between LEPR rs1137100 G>A polymorphism and CRC risk by sex, age, smoking status and alcohol consumption
| Variable | LEPR rs1137100 G>A (case/control)a | Adjusted ORb (95% CI); P | ||||||
|---|---|---|---|---|---|---|---|---|
|
|
|
|||||||
| GG | GA | AA | GG | GA | AA | GA/AA | AA vs. (GA/GG) | |
| Sex | ||||||||
| Male | 409/561 | 180/221 | 15/17 | 1.00 | 1.07 (0.85-1.36); P: 0.568 | 1.12 (0.54-2.30); P: 0.761 | 1.12 (0.89-1.41); P: 0.354 | 1.13 (0.55-2.31); P: 0.744 |
| Female | 258/353 | 109/130 | 9/18 | 1.00 | 1.09 (0.81-1.49); P: 0.570 | 0.76 (0.33-1.74); P: 0.509 | 1.07 (0.80-1.45); P: 0.617 | 0.75 (0.33-1.72); P: 0.495 |
| Age | ||||||||
| <61 | 310/425 | 127/162 | 6/11 | 1.00 | 1.04 (0.79-1.38); P: 0.782 | 0.77 (0.27-2.18); P: 0.623 | 1.05 (0.79-1.38); P: 0.745 | 0.77 (0.28-2.18); P: 0.628 |
| ≥61 | 357/489 | 162/189 | 18/24 | 1.00 | 1.11 (0.86-1.42); P: 0.437 | 1.04 (0.55-1.97); P: 0.897 | 1.14 (0.90-1.46); P: 0.284 | 1.04 (0.55-1.95); P: 0.907 |
| Smoking status | ||||||||
| Never | 496/730 | 216/272 | 16/33 | 1.00 | 1.14 (0.92-1.41); P: 0.229 | 0.69 (0.37-1.28); P: 0.235 | 1.12 (0.91-1.38); P: 0.274 | 0.68 (0.37-1.25); P: 0.214 |
| Ever | 171/184 | 73/79 | 8/2 | 1.00 | 0.94 (0.64-1.38); P: 0.739 | 4.20 (0.87-20.38); P: 0.075 | 1.06 (0.73-1.55); P: 0.768 | 4.43 (0.92-21.42); P: 0.064 |
| Alcohol consumption | ||||||||
| Never | 551/825 | 240/309 | 19/30 | 1.00 | 1.13 (0.92-1.38); P: 0.246 | 0.96 (0.53-1.73); P: 0.882 | 1.15 (0.94-1.40); P: 0.171 | 0.95 (0.52-1.71); P: 0.853 |
| Ever | 116/89 | 49/42 | 5/5 | 1.00 | 0.84 (0.51-1.39); P: 0.493 | 0.85 (0.23-3.09); P: 0.803 | 0.87 (0.53-1.41); P: 0.568 | 0.91 (0.25-3.28); P: 0.886 |
| BMI (kg/m2) | ||||||||
| <24 | 439/497 | 203/174 | 14/15 | 1.00 | 1.27 (1.00-1.62); P: 0.051 | 1.00 (0.47-2.10); P: 0.990 | 1.29 (1.02-1.63); P: 0.036 | 0.95 (0.45-1.99); P: 0.890 |
| ≥24 | 228/417 | 86/177 | 10/20 | 1.00 | 0.85 (0.63-1.15); P: 0.291 | 0.86 (0.39-1.90); P: 0.716 | 0.88 (0.66-1.18); P: 0.401 | 0.93 (0.42-2.03); P: 0.849 |
For LEPR rs1137100 G>A, the genotyping was successful in 980 (97.71%) CRC cases, and 1,300 (99.77%) controls;
Adjusted for multiple comparisons [age, sex, BMI, smoking status and alcohol consumption (besides stratified factors accordingly)] in a logistic regression model.
Bold value is statistically significant (P<0.05).
In subgroup analysis for LEPR rs6588147, we identified that this locus also decreased the susceptibility of CRC (male subgroup: GA vs. GG adjusted OR=0.69, 95% CI, 0.54-0.89, P=0.004 and GA/AA vs. GG adjusted OR=0.72, 95% CI, 0.57-0.92, P=0.010; <61 years old subgroup: GA vs. GG adjusted OR=0.68, 95% CI, 0.50-0.91, P=0.009 and GA/AA vs. GG adjusted OR=0.70, 95% CI, 0.53-0.94, P=0.016; never smoking subgroup: GA vs. GG adjusted OR=0.59, 95% CI, 0.39-0.89, P=0.012 and GA/AA vs. GG adjusted OR=0.64, 95% CI, 0.43-0.96, P=0.030 and never drinking subgroup: GA vs. GG adjusted OR=0.33, 95% CI, 0.19-0.57, P<0.001 and GA/AA vs. GG adjusted OR=0.37, 95% CI, 0.22-0.63, P<0.001, Table 7).
Table 7.
Stratified analyses between LEPR rs6588147 G>A polymorphism and CRC risk by sex, age, smoking status and alcohol consumption
| Variable | LEPR rs6588147 G>A (case/control)a | Adjusted ORb (95% CI); P | ||||||
|---|---|---|---|---|---|---|---|---|
|
|
|
|||||||
| GG | GA | AA | GG | GA | AA | GA/AA | AA vs. (GA/GG) | |
| Sex | ||||||||
| Male | 460/559 | 135/228 | 9/12 | 1.00 | 0.69 (0.54-0.89); P: 0.004 | 0.82 (0.34-1.98); P: 0.652 | 0.72 (0.57-0.92); P: 0.010 | 0.91 (0.38-2.22); P: 0.842 |
| Female | 275/358 | 94/134 | 7/9 | 1.00 | 0.87 (0.63-1.18); P: 0.365 | 1.05 (0.38-2.92); P: 0.928 | 0.89 (0.66-1.21); P: 0.474 | 1.10 (0.40-3.06); P: 0.850 |
| Age | ||||||||
| <61 | 339/421 | 96/166 | 8/11 | 1.00 | 0.68 (0.50-0.91); P: 0.009 | 0.91 (0.35-2.32); P: 0.838 | 0.70 (0.53-0.94); P: 0.016 | 1.01 (0.40-2.58); P: 0.982 |
| ≥61 | 396/496 | 131/196 | 8/10 | 1.00 | 0.82 (0.63-1.07); P: 0.140 | 0.85 (0.33-2.23); P: 0.747 | 0.85 (0.66-1.10); P: 0.225 | 0.92 (0.36-2.40); P: 0.869 |
| Smoking status | ||||||||
| Never | 539/732 | 179/286 | 10/17 | 1.00 | 0.83 (0.66-1.03); P: 0.089 | 0.80 (0.36-1.78); P: 0.589 | 0.85 (0.68-1.05); P: 0.130 | 0.86 (0.39-1.90); P: 0.704 |
| Ever | 196/185 | 50/76 | 6/4 | 1.00 | 0.59 (0.39-0.89); P: 0.012 | 1.16 (0.32-4.23); P: 0.826 | 0.64 (0.43-0.96); P: 0.030 | 1.36 (0.37-4.93); P: 0.644 |
| Alcohol consumption | ||||||||
| Never | 597/832 | 200/312 | 13/20 | 1.00 | 0.86 (0.70-1.06); P: 0.156 | 0.85 (0.41-1.73); P: 0.647 | 0.88 (0.72-1.08); P: 0.234 | 0.90 (0.44-1.83); P: 0.764 |
| Ever | 138/85 | 29/50 | 3/1 | 1.00 | 0.33 (0.19-0.57); P: <0.001 | 1.89 (0.19-19.06); P: 0.588 | 0.37 (0.22-0.63); P: <0.001 | 2.50 (0.25-25.07); P: 0.435 |
| BMI (kg/m2) | ||||||||
| <24 | 489/483 | 156/190 | 11/13 | 1.00 | 0.79 (0.62-1.02); P: 0.068 | 0.82 (0.36-1.86); P: 0.637 | 0.82 (0.64-1.04); P: 0.099 | 0.89 (0.39-2.01); P: 0.776 |
| ≥24 | 246/434 | 73/172 | 5/8 | 1.00 | 0.71 (0.52-0.98); P: 0.035 | 1.15 (0.37-3.60); P: 0.809 | 0.75 (0.55-1.03); P: 0.076 | 1.28 (0.41-3.98); P: 0.674 |
For LEPR rs6588147 G>A, the genotyping was successful in 980 (97.71%) CRC cases, and 1,300 (99.77%) controls;
Adjusted for multiple comparisons [age, sex, BMI, smoking status and alcohol consumption (besides stratified factors accordingly)] in a logistic regression model.
Bold values are statistically significant (P<0.05).
For LEPR rs1137101, the relationship of this polymorphism with a decreased susceptibility to CRC was found in the never drinking subgroup (GA vs. GG adjusted OR=0.47, 95% CI, 0.27-0.80, P=0.006 and GA/AA vs. GG adjusted OR=0.54, 95% CI, 0.32-0.90, P=0.019, Table 8).
Table 8.
Stratified analyses between LEPR rs1137101 G>A polymorphism and CRC risk by sex, age, smoking status and alcohol consumption
| Variable | LEPR rs1137101 G>A (case/control)a | Adjusted ORb (95% CI); P | ||||||
|---|---|---|---|---|---|---|---|---|
|
|
|
|||||||
| GG | GA | AA | GG | GA | AA | GA/AA | AA vs. (GA/GG) | |
| Sex | ||||||||
| Male | 467/608 | 127/183 | 10/7 | 1.00 | 0.87 (0.67-1.13); P: 0.304 | 1.74 (0.65-4.70); P: 0.272 | 0.93 (0.72-1.21); P: 0.598 | 1.85 (0.69-4.97); P: 0.226 |
| Female | 293/387 | 78/102 | 5/12 | 1.00 | 0.99 (0.70-1.38); P: 0.935 | 0.57 (0.19-1.65); P: 0.296 | 0.96 (0.69-1.33); P: 0.810 | 0.58 (0.20-1.68); P: 0.312 |
| Age | ||||||||
| <61 | 340/458 | 99/133 | 4/6 | 1.00 | 1.01 (0.75-1.37); P: 0.947 | 0.92 (0.25-3.42); P: 0.903 | 1.03 (0.76-1.38); P: 0.867 | 0.93 (0.25-3.45); P: 0.916 |
| ≥61 | 420/287 | 106/152 | 11/13 | 1.00 | 0.84 (0.63-1.10); P: 0.215 | 1.08 (0.47-2.45); P: 0.861 | 0.88 (0.67-1.16); P: 0.374 | 1.14 (0.50-2.60); P: 0.750 |
| Smoking status | ||||||||
| Never | 561/799 | 157/216 | 10/19 | 1.00 | 1.03 (0.81-1.30); P: 0.829 | 0.69 (0.31-1.52); P: 0.356 | 1.02 (0.81-1.29); P: 0.853 | 0.70 (0.32-1.54); P: 0.376 |
| Ever | 199/196 | 48/69 | 5/0 | 1.00 | 0.65 (0.42-0.99); P: 0.045 | - | 0.75(0.49-1.13); P: 0.165 | - |
| Alcohol consumption | ||||||||
| Never | 625/903 | 174/242 | 11/18 | 1.00 | 1.03 (0.83-1.29); P: 0.792 | 0.87 (0.40-1.86); P: 0.712 | 1.05 (0.84-1.30); P: 0.686 | 0.88 (0.41-1.89); P: 0.742 |
| Ever | 135/92 | 31/43 | 4/1 | 1.00 | 0.47 (0.27-0.80); P: 0.006 | 2.95 (0.32-27.37); P: 0.342 | 0.54 (0.32-0.90); P: 0.019 | 3.59 (0.39-33.19); P: 0.261 |
| BMI (kg/m2) | ||||||||
| <24 | 512/534 | 136/141 | 8/11 | 1.00 | 0.97 (0.74-1.27); P: 0.831 | 0.70 (0.28-1.78); P: 0.457 | 0.98 (0.75-1.26); P: 0.847 | 0.72 (0.29-1.82); P: 0.491 |
| ≥24 | 248/461 | 69/144 | 7/8 | 1.00 | 0.85 (0.61-1.18); P: 0.318 | 1.64 (0.58-4.60); P: 0.350 | 0.91 (0.67-1.26); P: 0.583 | 1.73 (0.62-4.86); P: 0.296 |
For LEPR rs1137101 G>A, the genotyping was successful in 980 (97.71%) CRC cases, and 1,299 (99.69%) controls;
Adjusted for multiple comparisons [age, sex, BMI, smoking status and alcohol consumption (besides stratified factors accordingly)] in a logistic regression model.
Bold values are statistically significant (P<0.05).
Discussion
Obesity/overweight is a contemporary common public health issue worldwide. A number of investigations have suggested that obesity and/or overweight may be associated with the occurrence of CRC [3,8]. Thus, any obesity/overweight related genes may also be implicated in the development and survival of CRC patients [9,11,12]. Here, we recruited 2,306 participants (1,003 CRC cases and 1,303 cancer-free controls) to assess the correlation between LEP/LEPR SNPs and the susceptibility of CRC. We found a significant association between the LEPR rs6588147 locus and the decreased risk of CRC. In subgroup analysis for LEPR rs6588147 and rs1137101 and LEP rs2167270, the association of these SNPs with the decreased risk of CRC was found in some subgroups. For example, we found that the LEPR rs1137100 locus might increase the susceptibility of CRC in the BMI <24 kg/m2 subgroup.
The rs6588147 site is an intron locus in the LEPR gene and Zhang et al. had reported that the LEPR rs6588147 A allele is implicated in the occurence of hepatocellular carcinoma [33]. Another study in a mixed population has also indicated that the presence of the rs6588147 A allele tended to decrease the risk of colon cancer [24]. However, Nyante et al. suggested that this locus might promote the occurrence of breast cancer in some subtypes [34]. In the current study the correlation of the rs6588147 A allele to the decreased risk of CRC was significant. In subgroup analysis we identified that this locus also decreased the susceptibility of CRC in male, <61 years, never smoking and never drinking subgroups. Few studies have explored the relationship of LEPR rs6588147 polymorphisms with the development of cancer. And the function of this locus was also unknown. In the future, the role of this locus should be further studied to explore the correlation to the development cancer. Additionally, a functional study should also be conducted.
Rs2167270 is located in the 5’-utr of the LEP gene and a 5’-utr SNP might affect the mRNA translation process. For example, it has been suggested that the rs2167270 locus in the LEP gene could be implicated in the development of diabetes in a post-transplant populations [35]. A previous investigaton indicated that the serum LEP level in individuals who carry the GA genotype of the LEP rs2167270 was higher than in those who carried with GG genotype [36]. In a more recent meta-analysis, Yang et al. found that LEP rs2167270 variants were associated with a decreased risk of cancer [37]. In this case-control study, we did not find any association between LEP rs2167270 and the overall risk of CRC. However, in subgroup analysis for LEP rs2167270, the association of this SNP with the decreased risk of CRC was found in the ≥61 years old subgroup, which was similar to the results from a meta-analysis [37]. The vital relationship between LEP rs2167270 and the risk of CRC should be more carefully considered.
The LEPR rs1137101 G/A (Arg223Gln), a missense SNP, has been widely investigated for its correlation between this locus and cancer. This SNP leads to a G→A variant in exon 6 and results in a Arg→Gln substitution in the extracellular region of the LEPR [38]. Recently, some case-control studies have reported that the rs1137101 A allele is a protective factor against cancer development [39,40]. In the current study, we found that the rs1137101 G>A SNP was associated with a decreased risk for CRC in the never drinking subgroup, a result consistent with the studies mentioned above.
The rs1137100 G/A SNP in the LEPR gene is a missense variant that might influence the LEPR structure and its function. In a meta-analysis, Shi et al. suggested that the rs1137100 A allele was a risk factor for gastric cancer [41]. In this study, we found that the rs1137100 A allele increased the risk of CRC in the BMI <24 kg/m2 subgroup as well. In controls, the MAF of rs1137100 (A allele) was 0.155, which was similar to the database.
Some limitations in this study should be addressed. Firstly, although the number of participants was relatively large, the sample size in certain subgroups was moderate. Thus, the power in these subgroups might be insufficient. Secondly, our study is designed as hospital-based and a potential bias cannot be ignored. Thirdly, we only foucus on the five risk factors (e.g. age, gender, BMI, smoking status and alcohol consumption). Other vital environmental carcinogen exposure factors were not considered. Finally, we only focused on five SNPs in the LEP/LEPR pathways and other functional SNPs should be considered in the future.
In conclusion, this study highlights that polymorphisms in the LEPR rs6588147, rs1137101 and LEP rs2167270 sites may decrease the risk of CRC. However, polymorphisms in the LEPR rs1137100 may increase the susceptibility of CRC. Further case-control studies with larger sample sizes should be conducted to valid our findings.
Acknowledgements
We appreciate all subjects who participated in this study. We wish to thank Dr. Yan Liu (Genesky Biotechnologies Inc., Shanghai, China) for technical support. This project was supported in part by the National Natural Science Foundation of China (Grant No. U1705282), Natural Science Foundation of Fujian Province (Grant No. 2017J01259, 2018J01267), Fujian provincial health and family planning research talent training program (Grant No. 2018-ZQN-13,2019-CX-4), Joint Funds for the innovation of science and Technology, Fujian province (Grant No. 2017Y9077), Fujian Provincial Science and Technology Department Planning Project (Grant No. 2018Y2003) and the National Clinical Key Specialty Construction Program.
Disclosure of conflict of interest
None.
References
- 1.Marcelino LF, Patricio ZM. The complexity of obesity and life after bariatric surgery: a public health issue. Cien Saude Colet. 2011;16:4767–4776. doi: 10.1590/s1413-81232011001300025. [DOI] [PubMed] [Google Scholar]
- 2.Mello MM. Obesity--personal choice or public health issue? Nat Clin Pract Endocrinol Metab. 2008;4:2–3. doi: 10.1038/ncpendmet0695. [DOI] [PubMed] [Google Scholar]
- 3.Hamaguchi M, Hashimoto Y, Obora A, Kojima T, Fukui M. Non-alcoholic fatty liver disease with obesity as an independent predictor for incident gastric and colorectal cancer: a population-based longitudinal study. BMJ Open Gastroenterol. 2019;6:e000295. doi: 10.1136/bmjgast-2019-000295. [DOI] [PMC free article] [PubMed] [Google Scholar]
- 4.Akay S, Urkan M, Balyemez U, Ersen M, Tasar M. Is visceral obesity associated with colorectal cancer? The first volumetric study using all CT slices. Diagn Interv Radiol. 2019;25:338–345. doi: 10.5152/dir.2019.18350. [DOI] [PMC free article] [PubMed] [Google Scholar]
- 5.Dong L, Ma L, Ma GH, Ren H. Genome-wide analysis reveals DNA methylation alterations in obesity associated with high risk of colorectal cancer. Sci Rep. 2019;9:5100. doi: 10.1038/s41598-019-41616-0. [DOI] [PMC free article] [PubMed] [Google Scholar]
- 6.Ahechu P, Zozaya G, Marti P, Hernandez-Lizoain JL, Baixauli J, Unamuno X, Fruhbeck G, Catalan V. NLRP3 inflammasome: a possible link between obesity-associated low-grade chronic inflammation and colorectal cancer development. Front Immunol. 2018;9:2918. doi: 10.3389/fimmu.2018.02918. [DOI] [PMC free article] [PubMed] [Google Scholar]
- 7.Cirillo F, Catellani C, Sartori C, Lazzeroni P, Amarri S, Street ME. Obesity, insulin resistance, and colorectal cancer: could miRNA dysregulation play a role? Int J Mol Sci. 2019;20 doi: 10.3390/ijms20122922. [DOI] [PMC free article] [PubMed] [Google Scholar]
- 8.Garcia H, Song M. Early-life obesity and adulthood colorectal cancer risk: a meta-analysis. Rev Panam Salud Publica. 2019;43:e3. doi: 10.26633/RPSP.2019.3. [DOI] [PMC free article] [PubMed] [Google Scholar]
- 9.Ayers D, Boughanem H, Macias-Gonzalez M. Epigenetic Influences in the obesity/colorectal cancer axis: a novel theragnostic avenue. J Oncol. 2019;2019:7406078. doi: 10.1155/2019/7406078. [DOI] [PMC free article] [PubMed] [Google Scholar]
- 10.Dong Y, Zhou J, Zhu Y, Luo L, He T, Hu H, Liu H, Zhang Y, Luo D, Xu S, Xu L, Liu J, Zhang J, Teng Z. Abdominal obesity and colorectal cancer risk: systematic review and meta-analysis of prospective studies. Biosci Rep. 2017;37 doi: 10.1042/BSR20170945. [DOI] [PMC free article] [PubMed] [Google Scholar]
- 11.Billy M, Sholihah H, Andanni K, Anggraeni MI, Siregar SM, Mirtha LT. Obesity as predictor of mortality of colorectal cancer: an evidence-based case report. Acta Med Indones. 2016;48:242–246. [PubMed] [Google Scholar]
- 12.Shah MS, Fogelman DR, Raghav KP, Heymach JV, Tran HT, Jiang ZQ, Kopetz S, Daniel CR. Joint prognostic effect of obesity and chronic systemic inflammation in patients with metastatic colorectal cancer. Cancer. 2015;121:2968–2975. doi: 10.1002/cncr.29440. [DOI] [PMC free article] [PubMed] [Google Scholar]
- 13.Viesti ACR, Salgado W Jr, Pretti da Cunha Tirapelli D, dos Santos JS. The expression of LEP, LEPR, IGF1 and IL10 in obesity and the relationship with microRNAs. PLoS One. 2014;9:e93512. doi: 10.1371/journal.pone.0093512. [DOI] [PMC free article] [PubMed] [Google Scholar]
- 14.Kucuk N, Orbak Z, Karakelloglu C, Akcay F. The effect of therapy on plasma ghrelin and leptin levels, and appetite in children with iron deficiency anemia. J Pediatr Endocrinol Metab. 2019;32:275–280. doi: 10.1515/jpem-2018-0352. [DOI] [PubMed] [Google Scholar]
- 15.Liu J, Yang X, Yu S, Zheng R. The leptin signaling. Adv Exp Med Biol. 2018;1090:123–144. doi: 10.1007/978-981-13-1286-1_7. [DOI] [PubMed] [Google Scholar]
- 16.Perez-Perez A, Vilarino-Garcia T, Fernandez-Riejos P, Martin-Gonzalez J, Segura-Egea JJ, Sanchez-Margalet V. Role of leptin as a link between metabolism and the immune system. Cytokine Growth Factor Rev. 2017;35:71–84. doi: 10.1016/j.cytogfr.2017.03.001. [DOI] [PubMed] [Google Scholar]
- 17.Bartucci M, Svensson S, Ricci-Vitiani L, Dattilo R, Biffoni M, Signore M, Ferla R, De Maria R, Surmacz E. Obesity hormone leptin induces growth and interferes with the cytotoxic effects of 5-fluorouracil in colorectal tumor stem cells. Endocr Relat Cancer. 2010;17:823–833. doi: 10.1677/ERC-10-0083. [DOI] [PubMed] [Google Scholar]
- 18.Ho GY, Wang T, Gunter MJ, Strickler HD, Cushman M, Kaplan RC, Wassertheil-Smoller S, Xue X, Rajpathak SN, Chlebowski RT, Vitolins MZ, Scherer PE, Rohan TE. Adipokines linking obesity with colorectal cancer risk in postmenopausal women. Cancer Res. 2012;72:3029–3037. doi: 10.1158/0008-5472.CAN-11-2771. [DOI] [PMC free article] [PubMed] [Google Scholar]
- 19.Song M, Zhang X, Wu K, Ogino S, Fuchs CS, Giovannucci EL, Chan AT. Plasma adiponectin and soluble leptin receptor and risk of colorectal cancer: a prospective study. Cancer Prev Res (Phila) 2013;6:875–885. doi: 10.1158/1940-6207.CAPR-13-0169. [DOI] [PMC free article] [PubMed] [Google Scholar]
- 20.Hassan NE, El-Masry SA, Zarouk W, El Banna RA, Mosaad RM, Al-Tohamy M, Salamah AR. Obesity phenotype in relation to gene polymorphism among samples of Egyptian children and their mothers. Genes Dis. 2018;5:150–157. doi: 10.1016/j.gendis.2017.12.004. [DOI] [PMC free article] [PubMed] [Google Scholar]
- 21.Nesrine Z, Haithem H, Imen B, Fadoua N, Asma O, Fadhel NM, Ali B. Leptin and Leptin receptor polymorphisms, plasma Leptin levels and obesity in Tunisian volunteers. Int J Exp Pathol. 2018;99:121–130. doi: 10.1111/iep.12271. [DOI] [PMC free article] [PubMed] [Google Scholar]
- 22.Dasgupta S, Salman M, Siddalingaiah LB, Lakshmi GL, Xaviour D, Sreenath J. Genetic variants in leptin: determinants of obesity and leptin levels in South Indian population. Adipocyte. 2015;4:135–140. doi: 10.4161/21623945.2014.975538. [DOI] [PMC free article] [PubMed] [Google Scholar]
- 23.Nock NL, Li L, Elston RC. Modeling genetic and environmental factors in biological systems using structural equation modeling: an application to energy balance. Proc Ohio Collab Conf Bioinform. 2009:3–8. doi: 10.1109/OCCBIO.2009.18. [DOI] [PMC free article] [PubMed] [Google Scholar]
- 24.Slattery ML, Wolff RK, Herrick J, Caan BJ, Potter JD. Leptin and leptin receptor genotypes and colon cancer: gene-gene and gene-lifestyle interactions. Int J Cancer. 2008;122:1611–1617. doi: 10.1002/ijc.23135. [DOI] [PMC free article] [PubMed] [Google Scholar]
- 25.Partida-Perez M, de la Luz Ayala-Madrigal M, Peregrina-Sandoval J, Macias-Gomez N, Moreno-Ortiz J, Leal-Ugarte E, Cardenas-Meza M, Centeno-Flores M, Maciel-Gutierrez V, Cabrales E, Cervantes-Ortiz S, Gutierrez-Angulo M. Association of LEP and ADIPOQ common variants with colorectal cancer in Mexican patients. Cancer Biomark. 2010;7:117–121. doi: 10.3233/CBM-2010-0154. [DOI] [PMC free article] [PubMed] [Google Scholar]
- 26.Tang W, Kang M, Liu C, Qiu H. Leptin rs7799039 (G2548A) polymorphism is associated with cancer risk: a meta-analysis involving 25,799 subjects. Onco Targets Ther. 2019;12:2879–2890. doi: 10.2147/OTT.S190093. [DOI] [PMC free article] [PubMed] [Google Scholar]
- 27.Vasku A, Vokurka J, Bienertova-Vasku J. Obesity-related genes variability in Czech patients with sporadic colorectal cancer: preliminary results. Int J Colorectal Dis. 2009;24:289–294. doi: 10.1007/s00384-008-0553-6. [DOI] [PubMed] [Google Scholar]
- 28.Qiu H, Cheng C, Wang Y, Kang M, Tang W, Chen S, Gu H, Liu C, Chen Y. Investigation of cyclin D1 rs9344 G>A polymorphism in colorectal cancer: a meta-analysis involving 13,642 subjects. Onco Targets Ther. 2016;9:6641–6650. doi: 10.2147/OTT.S116258. [DOI] [PMC free article] [PubMed] [Google Scholar]
- 29.Tang W, Chen Y, Chen S, Sun B, Gu H, Kang M. Programmed death-1 (PD-1) polymorphism is associated with gastric cardia adenocarcinoma. Int J Clin Exp Med. 2015;8:8086–8093. [PMC free article] [PubMed] [Google Scholar]
- 30.Yan P, Xia M, Gao F, Tang G, Zeng H, Yang S, Zhou H, Ding D, Gong L. Predictive role of miR-146a rs2910164 (C>G), miR-149 rs2292832 (T>C), miR-196a2 rs11614913 (T>C) and miR-499 rs3746444 (T>C) in the development of hepatocellular carcinoma. Int J Clin Exp Pathol. 2015;8:15177–15183. [PMC free article] [PubMed] [Google Scholar]
- 31.Tang W, Chen Y, Chen S, Sun B, Gu H, Kang M. Programmed death-1 (PD-1) polymorphism is associated with gastric cardia adenocarcinoma. Int J Clin Exp Med. 2015;8:8086–8093. [PMC free article] [PubMed] [Google Scholar]
- 32.Tang W, Wang Y, Chen S, Lin J, Chen B, Yu S, Chen Y, Gu H, Kang M. Investigation of cytotoxic T-lymphocyte antigen 4 polymorphisms in gastric cardia adenocarcinoma. Scand J Immunol. 2016;83:212–218. doi: 10.1111/sji.12409. [DOI] [PubMed] [Google Scholar]
- 33.Zhang S, Jiang J, Chen Z, Wang Y, Tang W, Liu C, Liu L, Chen Y. Investigation of LEP and LEPR polymorphisms with the risk of hepatocellular carcinoma: a case-control study in Eastern Chinese Han population. Onco Targets Ther. 2018;11:2083–2089. doi: 10.2147/OTT.S153931. [DOI] [PMC free article] [PubMed] [Google Scholar]
- 34.Nyante SJ, Gammon MD, Kaufman JS, Bensen JT, Lin DY, Barnholtz-Sloan JS, Hu Y, He Q, Luo J, Millikan RC. Common genetic variation in adiponectin, leptin, and leptin receptor and association with breast cancer subtypes. Breast Cancer Res Treat. 2011;129:593–606. doi: 10.1007/s10549-011-1517-z. [DOI] [PMC free article] [PubMed] [Google Scholar]
- 35.Romanowski M, Dziedziejko V, Maciejewska-Karlowska A, Sawczuk M, Safranow K, Domanski L, Pawlik A. Adiponectin and leptin gene polymorphisms in patients with post-transplant diabetes mellitus. Pharmacogenomics. 2015;16:1243–1251. doi: 10.2217/pgs.15.71. [DOI] [PubMed] [Google Scholar]
- 36.Marcello MA, Calixto AR, de Almeida JF, Martins MB, Cunha LL, Cavalari CA, Etchebehere EC, da Assumpcao LV, Geloneze B, Carvalho AL, Ward LS. Polymorphism in LEP and LEPR may modify leptin levels and represent risk factors for thyroid cancer. Int J Endocrinol. 2015;2015:173218. doi: 10.1155/2015/173218. [DOI] [PMC free article] [PubMed] [Google Scholar]
- 37.Yang J, Zhong Z, Tang W, Chen J. Leptin rs2167270 G > A (G19A) polymorphism may decrease the risk of cancer: A case-control study and meta-analysis involving 19 989 subjects. J Cell Biochem. 2019;120:10998–11007. doi: 10.1002/jcb.28378. [DOI] [PMC free article] [PubMed] [Google Scholar]
- 38.Gotoda T, Manning BS, Goldstone AP, Imrie H, Evans AL, Strosberg AD, McKeigue PM, Scott J, Aitman TJ. Leptin receptor gene variation and obesity: lack of association in a white British male population. Hum Mol Genet. 1997;6:869–876. doi: 10.1093/hmg/6.6.869. [DOI] [PubMed] [Google Scholar]
- 39.Mohammadzadeh G, Ghaffari MA, Bafandeh A, Hosseini SM. Effect of leptin receptor Q223R polymorphism on breast cancer risk. Iran J Basic Med Sci. 2014;17:588–594. [PMC free article] [PubMed] [Google Scholar]
- 40.Li Z, Yuan W, Ning S, Li J, Zhai W, Zhang S. Role of leptin receptor (LEPR) gene polymorphisms and haplotypes in susceptibility to hepatocellular carcinoma in subjects with chronic hepatitis B virus infection. Mol Diagn Ther. 2012;16:383–388. doi: 10.1007/s40291-012-0008-1. [DOI] [PubMed] [Google Scholar]
- 41.Shi H, Shu H, Huang C, Gong J, Yang Y, Liu R, Yang Y, Liu P. Association of LEPR K109R polymorphisms with cancer risk: a systematic review and pooled analysis. J BUON. 2014;19:847–854. [PubMed] [Google Scholar]