

Abstract
Acute myeloid leukemia (AML) is a malignant clonal disease that originates from hematopoietic stem cells. Because AML has a generally unsatisfactory long-term prognosis, new therapeutic options are required. To this end, we explored the effects of chidamide and decitabine alone or in combination on the AML cell lines THP-1, MV4-11, HL60, and Kasumi-1. Notably, the two drugs exhibited a synergistic effect against these cell lines. Similarly, we also found potential synergistic effects in primary cells of relapsed/refractory (r/r) AML. A transcriptome sequencing analysis performed to elucidate the underlying molecular mechanism revealed differentially expressed genes and regulatory pathways, particularly with regard to apoptosis, when comparing cells subjected to single and combination treatments. We identified PERP as a downstream target gene of the transcription factors P53 and P63, and it was expressed at considerably higher levels in combination-treated cells relative to monotherapy-treated cells. We further used a lentivirus-mediated small interfering RNA to inhibit the endogenous expression of PERP in AML cell lines and observed a significant increase in cell proliferation. Collectively, our results demonstrate, for the first time, the role of PERP in the response of AML to a combination drug regimen, providing a new potential treatment protocol and target in this context.
Keywords: Chidamide, decitabine, acute myeloid leukemia, apoptosis, PERP
Introduction
Acute myeloid leukemia (AML) is a heterogeneous clonal disease characterized by the loss of normal differentiation of hematopoietic progenitor cells. It often presents as a severe infection, bleeding, or organ infiltration [1]. The overall prognosis of AML remains poor [2], and long-term survival is only achieved by approximately 40% and 10% of younger and older patients, respectively. The poor survival outcome is primarily attributed to a high rate of relapse, even after the achievement of complete remission (CR) with standard chemotherapy or allogeneic stem cell transplantation [3]. An improved understanding of AML pathogenesis has led to the development of various targeted inhibitors and other novel drugs, and combinations of these molecularly-targeted drugs with standard chemotherapies have generally yielded higher response rates [4]. For example, Jonas and Pollyea reported that the combinations of hypomethylating agents and new drugs yielded better responses [5].
Chidamide (CS055), a novel oral histone deacetylase inhibitor (HDACI), selectively suppresses the activities of histone deacetylases 1, 2, 3, and 10. Many studies have investigated the therapeutic effects of chidamide for blood diseases and solid tumors [6,7], and in December 2014, the China Food and Drug Administration approved chidamide for the treatment of peripheral T-cell lymphoma [8]. Decitabine (Dacogen®, 5-aza-2’-deoxycytidine) is a widely used DNA methylation inhibitor. Although its anti-leukemic activity was first reported almost 40 years ago, decitabine was only recently approved as a first-line treatment for elderly (>65 years old) AML patients deemed ineligible for intensive chemotherapy [9]. Here, we focus on the therapeutic and potentially synergistic effects of chidamide plus decitabine against AML cells.
Materials and methods
Cell lines, primary tumor cells, and reagents
The AML cell lines THP-1, MV4-11, HL60, and Kasumi-1 were purchased from the American Type Culture Collection (Manassas, VA, USA). MV4-11 cells were cultured in Iscove’s Modified Dulbecco’s Media (Hyclone, Logan UT, USA), and all other lines were cultured in Roswell Park Memorial Institute-1640 medium (Hyclone). All cell culture media were supplemented with 10% fetal bovine serum (Gemini Bio-Products, Sacramento, CA, USA). All cell lines were cultured in a 95% humidity incubator at 37.5°C in an atmosphere of 5% CO2.
Primary AML cells were isolated from peripheral blood containing >50% blasts. These specimens were collected before chemotherapy. Chidamide was received as a gift from Chipscreen Biosciences Co., Ltd. (Shenzhen, China). Decitabine and puromycin 2HCl were obtained from Selleck Chemicals (Houston, TX, USA).
Cell viability assay
An MTT proliferation assay kit (Biosharp Life Sciences, Anhui, China) was used to measure the viability of cells exposed to 0.1-15 µM chidamide and 0.25-20 µM decitabine for 48 h. For combined experiments, the maximum drug concentrations were close to the 50% inhibitory concentration (IC50) values and then diluted in equal proportions. Cells were plated in 96-well plates at a concentration of 2 × 10⁵ cells/mL in 100 µL of a complete medium and treated with different doses of drugs for 48 h. Then, 20 µL of MTT reagent (5 mg/mL) was added to each well and incubated for 4 h at 37.5°C. Finally, the dissolving solution was added, and the optical density was measured at 570 nm the next day. The experiments were repeated in triplicate, and each sample was tested three times.
Flow cytometry analysis
The AML cell lines were incubated with chidamide and decitabine alone or in combination for 48 h. Then, apoptosis was measured using Alexa Fluor 647-conjugated annexin V and propidium iodide (PI) (4A Biotech Co., Ltd., Beijing, China), according to the manufacturer’s instructions. Briefly, the cells were harvested, washed twice with phosphate-buffered saline, and resuspended in 200 µL of binding buffer. Then, the cells were incubated with 2 µL Alexa Fluor 647-conjugated annexin V and 1 µL PI for 10 min. Apoptosis was analyzed using a Navios flow cytometer (Beckman Coulter, Brea CA, USA).
Western blots
The total proteins were extracted from each sample using a universal protein lysate/extraction reagents (Aidlab, Beijing, China) containing a protease inhibitor cocktail (Roche, Mannheim, Germany). The protein concentration was measured using a BCA Protein Assay Kit (Beyotime Biotechnology, Shanghai, China). Then, 40 µg of each protein sample was separated using sodium dodecyl sulfate-polyacrylamide gel electrophoresis (Bio-Rad, Hercules, CA, USA) and transferred to a polyvinylidene difluoride membrane (Millipore Corporation, Billerica, USA). Following blocking, primary antibodies specific for the following proteins were applied: cleaved caspases 3 and 9, caspase 8, BCL-2, BCL-XL, and phospho-P53 (Ser15) (p-P53) (Cell Signaling Technology, Danvers, MA, USA); PERP (Shanghai Abways Biotechnology Co., Ltd., Shanghai, China); AML-ETO (Santa Cruz Biotechnology, Dallas, TX, USA); MLL-AF4 (Bethyl Laboratories, Montgomery, TX, USA); GAPDH (Bioworld Technology, Louis Park, MN, USA); β-actin (4A Biotech); and β-tubulin (Sungene Biotech, Tianjin, China). After three washes with tris-buffered saline plus Tween-20, the membranes were incubated with appropriate secondary antibodies (ZSGB-Bio, Beijing, China). Finally, a chemiluminescent kit (Millipore Corporation, Billerica, USA) was used to visualize the reactive proteins. Conventional western blot protocols were used throughout [10].
ATP-based tumor chemosensitivity assay (ATP-TCA)
An ATP-TCA kit (Huzhou Hichuang Biotech Co., Ltd., Zhejiang, China) was used according to the provided instructions to evaluate cell viability by ATP chemiluminescence. This measured the tumor cell sensitivity to the anti-tumor drugs [11].
Gene expression profile generation and analysis
After a 48 h incubation with or without the aforementioned drugs, MV4-11 cells were harvested and stored in Trizol reagent (Molecular Research Center, Cincinnati, OH, USA) to isolate RNA, which was processed and sequenced by Novogene (Beijing, China) on a HiSeq device (Illumina, San Diego, CA, USA) to yield a transcriptome. Transcriptome sequencing (RNA-seq) libraries were constructed using the NEBNext Ultra RNA Library Prep Kit for Illumina (New England Biolabs, Ipswich, MA, USA). The RNA-seq reads were aligned to a reference genome to generate a precise junction read map using STAR RNA-Seq aligner software (version STAR_2.5.1b). The read numbers mapped to each gene were counted using HTSeq v0.6.0 software. Significant differences in expression were analyzed using DESeq2. Genes with absolute fold changes >0.5 and a Benjamini-Hochberg adjusted P-value <0.05 were validated further. clusterProfiler software was used to perform Gene Ontology and DO functional enrichment analyses as well as Kyoto Encyclopedia of Genes and Genomes (KEGG) and Reactome pathway enrichment analyses of differentially expressed gene (DEG) sets.
Quantitative reverse transcription-polymerase chain reaction (qRT-PCR) assays
The extracted total RNAs were reverse transcribed (Takara, Dalian, China) and subjected to qRT-PCR using Go Taq qPCR Master Mix (Promega, Shanghai, China), according to the manufacturer’s instructions. The cycling parameters used were 95°C for 2 min; followed by 40 cycles of 95°C for 15 seconds and 60°C for 1 min, and then 65°C to determine the dissociation curve. The relative expression levels of mRNA were calculated using the 2-ΔΔCt method [12]. GAPDH expression was used as an internal control for normalization. The primer sequences for PERP were 5’-AGATGCTTGTCTTCCTGAGAGTGAT-3’ (forward) and 5’-GATGTAAGTGACAGCAGGGTTGG-3’ (reverse), and those for GAPDH were 5’-CGCTGAGTACGTCGTGGAGTC-3’ (forward) and 5’-GCTGATGATCTTGAGGCTGTTGTC-3’ (reverse).
Lentivirus construction and infection
The process of RNA interference (RNAi) lentiviral packaging is roughly as follows: PERP-RNAi contains three specific constructs, encoding small interfering RNA (siRNA) designed to knock down PERP expression and a control RNAi lentiviral-based plasmid that includes a siRNA construct encoding a known scrambled sequence that does not result in specific degradation of any cellular mRNA. We selected lentiviral vector GV248, which contains a puromycin-resistance gene and a green fluorescent protein reporter gene. For lentiviral packaging, 293T cells were co-transfected with PERP siRNA or negative control siRNA and two helper plasmids. The supernatant containing packaged lentivirus from the cells was collected, concentrated by centrifugation, and purified by filtration. THP-1, MV4-11, and HL60 cells were infected with these three lentiviruses and the control lentivirus, according to the manufacturer’s protocol.
Mononuclear cell separation
Peripheral blood samples were collected from 35 AML patients (non-acute promyelocytic leukemia) and 20 healthy individuals. The peripheral blood mononuclear cells (PBMCs) were separated using Ficoll solution (TBD Science, Tianjin, China), according to the manufacturer’s protocol.
Statistical analysis
Data were expressed as the mean of several independent experiments ± standard deviation or standard error of the mean. The apoptosis rate of cells and the expression level of PERP mRNA were analyzed by t-tests, and the other results were analyzed using two-way analysis of variance (Prism 7.0; Graph Pad Inc., San Diego, CA, USA). Significant differences were considered at *P<0.05, **P<0.01, ***P<0.001, and ****P<0.0001. The IC50 was calculated using SPSS v26.0 software (IBM Corp., Armonk, NY, USA). Combination indices (CIs) were calculated using Calcusyn v2.0 (Biosoft, Cambridge, UK).
Results
Chidamide plus decitabine acted synergistically on AML cell lines
We first calculated the IC50 values for chidamide and decitabine alone when applied to AML cell lines for 48 h. The IC50 values were lower for chidamide in all four cell lines (Figure 1A). Chidamide plus decitabine inhibited AML cell proliferation in a concentration-dependent manner, and the combination had a stronger inhibitory effect than that of either drug alone (Figure 1B). Next, we calculated the CIs to determine whether the two-drug combination had a synergistic effect. The CIs are shown in Tables 1, 2, 3 and 4, and the fraction affected-CI plot is shown in Figure 1C. The CIs of all concentrations were <1 in all four cell lines, indicating that the two-drug combination had a synergistic effect on AML cells.
Figure 1.

Chidamide plus decitabine synergistically inhibits the proliferation of acute myeloid leukemia (AML) cell lines. A. The 50% inhibitory concentration (IC50) values in THP-1, MV4-11, HL60, and Kasumi-1 cells. After treating the AML cell lines with chidamide or decitabine for 48 h, an MTT assay was performed to determine the cell survival rate, and SPSS 26.0 software (IBM Corp., Armonk, NY, USA) was used to calculate the IC50 value in THP-1, MV4-11, HL60, and Kasumi-1 cells. B. Viability of AML cell lines determined by MTT assay after treatment with chidamide and decitabine alone or in combination for 48 h. Values represent means expressed as percentages compared with the untreated control. Error bars represent standard deviations. C. Combination indices (CIs) for the two drugs explored in the THP-1, MV4-11, HL60, and Kasumi-1 cell lines using Calcusyn 2.0 software (Biosoft, Cambridge, UK). The horizontal axis represents the inhibitory effect achieved when the two drugs are combined, and the vertical axis represents the CIs. A CI of <1, 1, or >1 indicates a synergistic, additive, or antagonistic effect, respectively. Abbreviations: chidamide (CH), decitabine (DE), chidamide plus decitabine (CH+DE), Fa-CI, fraction affected-combination index.
Table 1.
Combination index values of THP-1 acute myeloid leukemia cell line
| CH (µM) | DE (µM) | CI values |
|---|---|---|
| 0.3125 | 0.5 | 0.369 |
| 0.625 | 1 | 0.395 |
| 1.25 | 2 | 0.678 |
| 2.5 | 4 | 0.817 |
| 5 | 8 | 0.756 |
CH: chidamide; DE: decitabine; CI, combination index.
Table 2.
Combination index values of MV4-11 acute myeloid leukemia cell line
| CH (µM) | DE (µM) | CI values |
|---|---|---|
| 0.15625 | 0.15625 | 0.242 |
| 0.3125 | 0.15625 | 0.385 |
| 0.625 | 0.625 | 0.278 |
| 1.25 | 1.25 | 0.089 |
| 2.5 | 2.5 | 6.16e-011 |
CH: chidamide; DE: decitabine; CI, combination index.
Table 3.
Combination index values of HL60 acute myeloid leukemia cell line
| CH (µM) | DE (µM) | CI values |
|---|---|---|
| 0.125 | 0.5 | 0.275 |
| 0.25 | 1 | 0.431 |
| 0.5 | 2 | 0.570 |
| 1 | 4 | 0.803 |
| 2 | 8 | 0.902 |
CH: chidamide; DE: decitabine; CI, combination index.
Table 4.
Combination index values of Kasumi-1 acute myeloid leukemia cell line
| CH (µM) | DE (µM) | CI values |
|---|---|---|
| 0.05 | 0.5 | 0.623 |
| 0.1 | 1 | 0.672 |
| 0.2 | 2 | 0.652 |
| 0.4 | 4 | 0.628 |
| 0.8 | 8 | 0.625 |
CH: chidamide; DE: decitabine; CI, combination index.
Chidamide plus decitabine significantly induced apoptosis, inhibited the expression of AML fusion proteins, and upregulated p-P53 in AML cells
We performed flow cytometry analysis and western blot assays to determine the ability of the drugs to induce apoptosis in AML cells. Notably, treatment with chidamide plus decitabine induced higher rates of apoptosis than single treatment with either drug. Furthermore, chidamide alone and in combination induced a significantly higher apoptosis rate relative to the control (P<0.05; Figure 2A). The western blot assays showed that all AML cell lines exhibited increased levels of pro-apoptotic proteins and decreased levels of anti-apoptotic proteins in response to the combination treatment relative to the single-drug treatments (Figure 2B). We showed the original pictures of the western blot assays (Figures S1, S2, S3 and S4).
Figure 2.

Chidamide plus decitabine significantly induced apoptosis, inhibited the expression of fusion protein, and upregulated phospho-P53 (ser15) in acute myeloid leukemia (AML) cell lines. A. The percentage of apoptosis in AML cell lines treated with chidamide and decitabine alone or in combination for 48 h, as determined by flow cytometry. Data are presented as the mean ± standard deviation of two independent experiments. (t-tests, *P<0.05 and **P<0.01 vs. control). B. Western blot analysis of the levels of cleaved caspase-3, cleaved caspase-9, caspase-8, BCL-XL, and BCL-2 proteins in THP-1, MV4-11, HL60, and Kasumi-1 cells after exposure to chidamide and decitabine alone or in combination for 24 or 48 h. GAPDH or β-actin was used as the loading control. C, D. Western blot analysis of the effects of chidamide and decitabine on the levels of AML-specific fusion proteins. The MV4-11 cells were treated with the drugs for 48 h, and the Kasumi-1 cells were treated with the drugs for 72 h. E. Western blot analysis of the effect of chidamide and decitabine on the level of phosphorylated P53 (ser15) in cells after 16 h of treatment alone or in combination. GAPDH was used as the loading control. Abbreviations: chidamide (CH), decitabine (DE), chidamide plus decitabine (CH+DE).
We further examined the effects of both drugs on fusion proteins, which are expressed in some studied cell lines. Surprisingly, chidamide inhibited fusion proteins MLL-AF4 and AML-ETO, both alone and in combination with decitabine (Figure 2C and 2D). We showed the original pictures of the western blot assays (Figure S5). Given the importance of TP53 in the apoptotic pathway, we tested the effect of the drugs on p-P53 (ser15), and the results showed that chidamide plus decitabine upregulated TP53 in both TP53 mutant cells (MV4-11) and in TP53 wild-type cells (Kasumi-1) (Figure 2E). We showed the original pictures of the western blot assays (Figure S6).
Primary AML cells were more sensitive to combination drugs
We included five cases of relapsed/refractory (r/r) AML in an ATP-TCA experiment to explore the effects of the studied drugs on primary AML cells. Notably, the combination of chidamide plus decitabine exerted synergistic effects on cells in four cases (Figure 3A-D). The clinical features of the five r/r AML cases are listed in Table 5.
Figure 3.

Sensitivity of relapsed/refractory (r/r) primary acute myeloid leukemia (AML) cell lines to chidamide plus decitabine as detected by an ATP-based tumor chemosensitivity assay (ATP-TCA). A-D. Inhibition rate of primary cells of r/r AML cells by chidamide plus decitabine. Values represent as percentages compared with the untreated control. Error bars represent the coefficient of variation. Abbreviations: chidamide (CH), decitabine (DE), chidamide plus decitabine (CH+DE).
Table 5.
Clinical features of five patients with relapsed/refractory acute myeloid leukemia
| Clinical features | Patients | ||||
|---|---|---|---|---|---|
|
| |||||
| P1 | P2 | P3 | P4 | P5 | |
| Gender | Female | Male | Male | Female | Female |
| Age (years) | 61 | 71 | 73 | 50 | 72 |
| FAB AML classification | AML-M1 | AML-M2 | AML with myelodysplasia-related changes | AML-M2 | AML-M1 |
| Genetic mutation/fusion gene | FLT3-ITD+, NPM1+, TET2+ | AML1-ETO+, TET2+, ASXL1+ | TP53+ | TP53+ | AML1-ETO+ |
| Karyotype | 46,XX,i(7)(q10) | 46,XY,t(8;21)(q22;q22) | 44,XY,del(5)(q13q33),del(7)(q22),dic(9;13)(q34;p11),del(12)(q11),-13.dic(13;19)(p11;q13),-16,inc(cp20) | 45-47,XX,del(1)(p13). Del(3)(q12),+8,add(17)(p11),inc[cp20] | 46,XX,t(8;21)(q22;q22) |
| Chemotherapy regimen | Induction: IDA × 1 | Induction: DA × 1 | Induction: decitabine + CAG | Induction: D-HAG | Induction: DA |
| Consolidate: ID-MA × 4 | Consolidate: IDA, DA, ID-M-A | Reinduction: decitabine + arsenic acid + cytarabine | Reinduction: D + DA | No remission | |
| Relapse | Relapse | No remission | |||
| Reinduction: CLAG | Reinduction: Di-priming | BCL-2 inhibitor + decitabine | |||
FAB: French-American-British; AML, acute myeloid leukemia.
Gene expression analysis
We performed gene expression profiling to explore the mechanism underlying the efficacy of combination therapy. Principal component analysis revealed that 89.37% of the cumulative variance could be explained by three main components and demonstrated the experimental consistency and specificity of the therapeutic effect (Figure 4A). A hierarchical clustering heat map of the DEGs confirmed drug exposure-related differences in gene expression in the four MV4-11 cell subgroups (Figure 4B). A Venn diagram was plotted to show the overlap of the DEGs in each treatment group relative to the control (Figure 4C), and volcano maps of the DEGs were constructed to depict the upregulated and downregulated genes in response to combination treatment relative to single treatment (Figure 4D and 4E). A KEGG enrichment analysis indicated that combination therapy induced genetic changes in multiple pathways, including those involved in the cell cycle, spliceosome, and lysosome, and these differed strongly from the genetic changes induced by single therapies (Figure 4F and 4G). The DEG expression patterns included the significant (P<0.05) upregulation of some apoptosis-related genes, such as PERP, AVEN, and BCL2L11. Discrete changes in these gene pools likely provide a distinct molecular explanation for the synergistic effects of the drug combination in vitro.
Figure 4.

Gene expression analysis of MV4-11 cells. A. Principal component analysis (PCA) revealed obvious differences between treatments. B. A hierarchical clustering heat map of the differentially expressed genes (DEGs) shows the four MV4-11 cell line subgroups distinguished by treatment type. Each row and column in the matrix represents a gene and sample, respectively. The color bar indicates changes in the relative levels of gene expression, which were normalized by standard deviations (0= average expression level of a given gene). Red and blue indicate the upregulation and downregulation of genes in response to the drug treatments, respectively; a darker color indicates a more significant change. C. Venn diagram of the relationships among the genes induced by the three treatments. Overall, 5912 genes were regulated by all treatments, whereas 1222, 1065, and 1965 were affected by chidamide only, decitabine only, or a combination thereof, respectively. D, E. Volcano mapping analysis of the DEGs upregulated and downregulated by the drug combination versus monotherapy. Red and green depict upregulated and downregulated DEGs, respectively, in response to combination drug therapy. F, G. Scatter plot of Kyoto Encyclopedia of Genes and Genomes enrichment analysis. The dot size indicates the number of enriched genes in the indicated pathway. The dot color indicates the degree of difference in the enriched gene. Abbreviations: chidamide (CH), decitabine (DE), chidamide plus decitabine (CH+DE), CON, control, UP, upregulated, DOWN, downregulated.
Verification of RNA-seq results and lentivirus infection efficiency
The RNA-seq analysis revealed the significantly higher upregulation of PERP, a potential downstream target of P53 and P63, in response to combination treatment compared with the repose to a single treatment. Subsequent qRT-PCR (Figure 5A) and western blot (Figure 5B) findings confirmed the RNA-seq data. We showed the original pictures of the western blot assays (Figure S7).
Figure 5.

Verification of the transcriptome sequencing results and lentivirus infection efficiency in acute myeloid leukemia (AML) cell lines. (A) The levels of PERP mRNA levels were detected by quantitative reverse transcription-polymerase chain reaction (qRT-PCR) in drug-treated cells after 24 h. Data are presented as the mean ± standard error of the mean (SEM) of three independent experiments. GAPDH was used as an internal control. (B) PERP protein levels were detected by western blot after 24 h (THP-1, MV4-11, and HL60) or 48 h (Kasumi-1) of drug treatment. β-Actin was used as an internal control. PERP mRNA expression (C) and protein levels (D) in lentivirus-infected AML cell lines were detected using qRT-PCR and western blots, respectively. Data are presented as the mean ± SEM of three independent experiments. β-Actin or β-tubulin was used as an internal control. (t-tests, *P<0.05, **P<0.01, and ***P<0.001 vs. control). Abbreviations: chidamide (CH), decitabine (DE), chidamide plus decitabine (CH+DE).
We further explored the mechanism whereby chidamide and decitabine promote apoptosis and the role of PERP in AML cells by infecting THP-1, MV4-11, and HL60 cells with PERP-specific siRNA-encoding lentiviruses. Then, we used qRT-PCR and western blots to detect PERP mRNA (Figure 5C) and protein (Figure 5D), respectively. We showed the original pictures of the western blot assays (Figure S8).qRT-PCR demonstrated that PERP was most strongly knocked down by LV-PERP-RNAi-3 (66241-1; P<0.05), while PERP was undetectable by western blot in all infected cells. Thus, we selected LV-PERP-RNAi-3 (66241-1) for further experiments.
PERP downregulation strongly promoted proliferation and induced chemotherapeutic drug resistance in AML cells
Lentivirus-infected cells were subjected to an MTT assay to explore the role of PERP in AML cell proliferation. Notably, the AML cell lines infected with LV-PERP-RNAi-3 exhibited significantly increased proliferation rates relative to those infected with LV-SC-RNAi (control; Figure 6A). Next, we elucidated the role of PERP in response to combination drug treatment in stable lentivirus-infected cell lines. An MTT proliferation assay revealed that PERP knockdown was associated with significantly reduced toxicity in response to the combination treatment when compared with the control (scrambled siRNA) group (Figure 6B). Flow cytometry revealed that PERP knockdown attenuated drug-induced apoptosis (Figure 6C). Western blot revealed that PERP knockdown reduced the ability of the drugs to induce pro-apoptotic protein expression (Figure 6D). We showed the original pictures of the western blot assays (Figures S9 and S10). In summary, PERP knockdown strongly promoted proliferation and decreased the responsiveness of AML cells to the treatment with chidamide plus decitabine.
Figure 6.
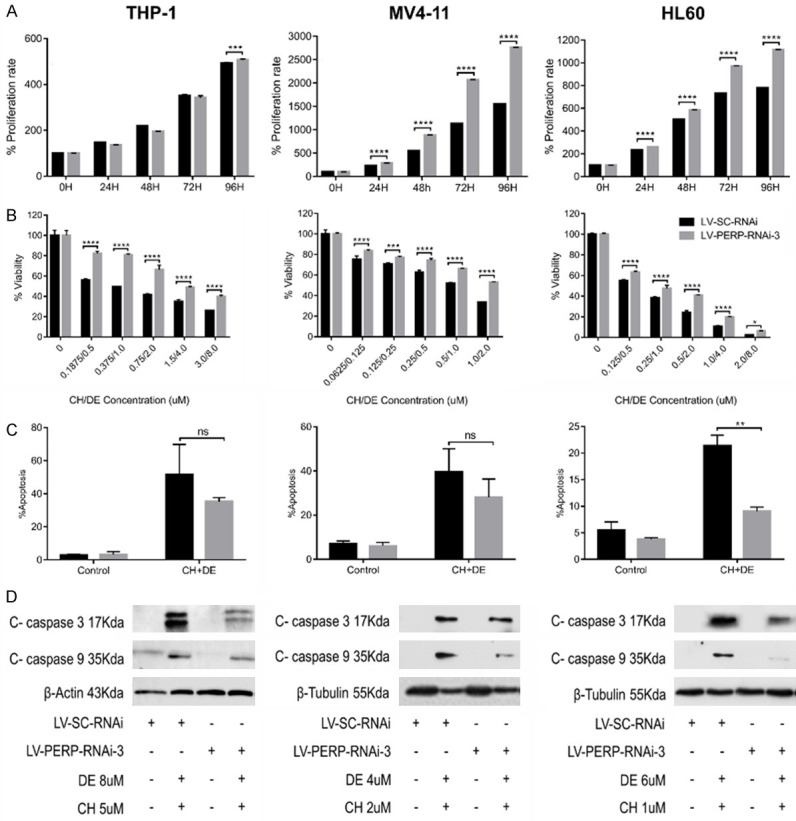
PERP knockdown promoted proliferation and induced resistance to combination drug therapy in acute myeloid leukemia (AML) cell lines. A. The effect of PERP knockdown on AML cell proliferation as detected by MTT assay. B. Histograms of MTT assay results demonstrate the negative effect of PERP knockdown on the synergistic effects of combination therapy. Values represent means expressed as percentages compared with the control. Error bars represent standard deviations (SDs) (analysis of variance [ANOVA], *P<0.05, ***P<0.01, and ****P<0.0001 vs. the LV-SC-RNAi group). C. Flow cytometry analysis of the effect of PERP knockdown on the drug-induced apoptosis of AML cells. Data are presented as the mean ± SD of two independent experiments. (ANOVA, ns: not significant, **P<0.01 vs. the LV-SC-RNAi group). D. Western blot analysis of the effect of PERP knockdown on the drug-induced expression of pro-apoptotic proteins. β-Actin or β-tubulin was used as the loading control.
Primary AML cells exhibit reduced PERP expression relative to normal PBMCs
A qRT-PCR analysis of isolated PBMCs from 35 AML patients and 20 healthy individuals confirmed the significantly lower levels of PERP mRNA in the samples from the AML patients (Figure 7).
Figure 7.
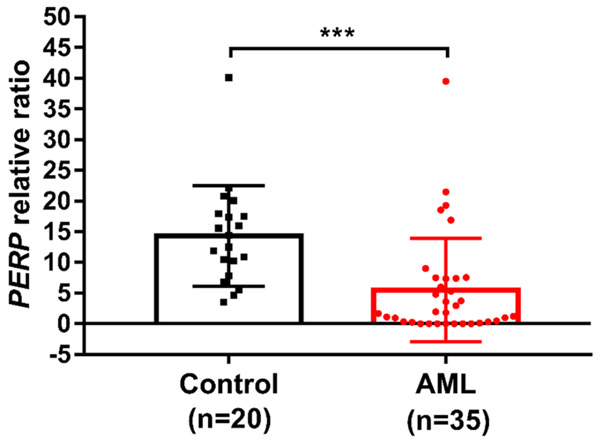
Primary acute myeloid leukemia (AML) cells exhibit reduced PERP expression relative to normal peripheral blood mononuclear cells (PBMCs). PERP mRNA expression in PBMCs from AML patients and healthy human controls detected by quantitative reverse transcription-polymerase chain reaction (qRT-PCR). Data are presented as the average relative expression levels from three independent experiments versus a single control. GAPDH expression was used as the internal control. (t-test, ***P<0.001 vs. the control group).
Discussion
Because AML is a biologically and clinically heterogeneous disease [13], the resultant limited treatment selectivity is associated with very high rates of r/r disease after standard chemotherapy. R/r AML is associated with a dismal prognosis, with 3-year overall survival rates of ≤10% [14,15]. Accordingly, new and effective treatments are a matter of urgency.
Previous reports have described the great potential of chidamide for the treatment of hematological diseases [16,17]. Accordingly, we explored the effects of chidamide and decitabine alone or in combination on AML cells. Furthermore, an exploration of drug toxicity confirmed the potential efficacy of chidamide, and experiments that combined the drugs revealed a significant synergistic effect. Specifically, this synergistic effect was observed in both AML cell lines and primary r/r AML cells in an ATP-TCA. Our findings are consistent with previous reports of the combined efficacy of HDACIs with other drugs for AML therapy [18,19]. For example, the combination of pracinostat, an oral HDACI, plus azacitidine is well tolerated and effective as a first-line regimen for older patients with AML who cannot tolerate intensive therapy [20].
MLL leukemia is characterized by repeated translocations of MLL alleles with various other chromosomes [21], and the presence of significant MLL rearrangement in a case of AML is an independent poor prognostic factor [22]. HDACIs were shown to exert robust anti-leukemia responses in a mouse model of t(8;21) AML [23], and we previously demonstrated that chidamide-based chemotherapy could induce complete remission (CR) in r/r MLL-AF9-rearranged AML [24]. Consistent with these earlier findings, we showed herein that chidamide, either alone or in combination with decitabine, significantly inhibited the expression of AML-ETO and MLL fusion genes. This HDACI may, therefore, be an alternative AML treatment option.
Our RNA-seq analysis of the potential synergistic mechanisms exploited by chidamide plus decitabine revealed the effects of this combination on a wide range of genes enriched in pathways involved in apoptosis and the cell cycle. Similarly, the synergistic effect of decitabine plus an HDACI on genome-wide expression in U937 cells was revealed by researchers [25]. Although the transcriptome may be affected by variations in AML cell lines and HDACI subtypes, the data strongly support a synergic effect between these inhibitors and other drugs in the treatment of AML.
Our RNA-seq analysis identified the upregulated expression of PERP, which encodes a protein involved in the apoptotic pathway. Traditionally, PERP is known as an apoptosis-associated target of P53 [26] and is considered a member of the PMP-22/gas3 family, with involvement in TP53-dependent apoptosis in various cell types [27]. These early researches are consistent with our detection of upregulation of p-P53 (ser15) by chidamide plus decitabine in MV4-11 and Kasumi-1 cell lines. However, some scholars believe that PERP is also targeted by P63. For instance, Ihrie et al. (2005) believed that PERP was regulated by P63 and thus played an important role in epithelial integrity and homeostasis [28]. This earlier observation may explain why we detected PERP expression in HL60 (TP53-deficient) but not in Kasumi-1 cells (TP53 wild-type). Our results may suggest that the combination of chidamide plus decitabine induces AML cell apoptosis by upregulating PERP independently of the TP53 status and that the underlying process may be closely related to a downstream target of P53 or may even bypass the classical P53 pathway (e.g., P63) [29]. Although PERP downregulation is considered essential for the oncogenic transformation of breast epithelial cells [30], no previous report has discussed the role of PERP in AML. Therefore, our study demonstrates, for the first time, that chidamide plus decitabine can upregulate PERP expression in AML cell lines and that PERP knockdown can promote AML cell proliferation while reducing drug cytotoxicity and inhibiting apoptosis. We further verified our findings by comparing the expression of PERP in PBMCs from AML patients and healthy controls. We observed that the expression level of PERP in AML samples and from open data base are lower, which may suggest that the low expression level of PERP is related to the development and drug resistance of AML.
We note that our study was limited by the use of AML cell lines. Consequently, the biological and genetic heterogeneity of primary AML cells remains unexplored per se. Although we observed enrichment in some metabolic and immune-related pathways that had been previously reported [31-33], we did not explore the potential connections between AML and immunity or metabolism.
In conclusion, our study demonstrates the synergistic pro-apoptotic effects of chidamide plus decitabine on AML cells, and it provides the first evidence indicating the active involvement of PERP in this cellular response. Our results show that detecting the expression level of PERP can predict the therapeutic effect of dual epigenetic drugs on AML. Although this work requires further functional validation and signaling pathway exploration, our findings demonstrate the potential usefulness of combined decitabine plus chidamide as a treatment for AML.
Acknowledgements
We gratefully acknowledge the Laboratory of Hematology, West China Hospital, Sichuan University. Experimental research funding was received from the National Natural Science Foundation of China (81470327) and the Sichuan Provincial Academic and Technical Leadership Support Funding Project (2018RZ0137).
Disclosure of conflict of interest
None.
Supporting Information
References
- 1.Short NJ, Rytting ME, Cortes JE. Acute myeloid leukaemia. Lancet. 2018;392:593–606. doi: 10.1016/S0140-6736(18)31041-9. [DOI] [PMC free article] [PubMed] [Google Scholar]
- 2.Ofran Y, Tallman MS, Rowe JM. How I treat acute myeloid leukemia presenting with preexisting comorbidities. Blood. 2016;128:488–496. doi: 10.1182/blood-2016-01-635060. [DOI] [PMC free article] [PubMed] [Google Scholar]
- 3.Shlush LI, Mitchell A, Heisler L, Abelson S, Ng SWK, Trotman-Grant A, Medeiros JJF, Rao-Bhatia A, Jaciw-Zurakowsky I, Marke R, McLeod JL, Doedens M, Bader G, Voisin V, Xu C, McPherson JD, Hudson TJ, Wang JCY, Minden MD, Dick JE. Tracing the origins of relapse in acute myeloid leukaemia to stem cells. Nature. 2017;547:104–108. doi: 10.1038/nature22993. [DOI] [PubMed] [Google Scholar]
- 4.Kayser S, Levis MJ. Advances in targeted therapy for acute myeloid leukaemia. Br J Haematol. 2018;180:484–500. doi: 10.1111/bjh.15032. [DOI] [PMC free article] [PubMed] [Google Scholar]
- 5.Jonas BA, Pollyea DA. How we use venetoclax with hypomethylating agents for the treatment of newly diagnosed patients with acute myeloid leukemia. Leukemia. 2019;33:2795–2804. doi: 10.1038/s41375-019-0612-8. [DOI] [PubMed] [Google Scholar]
- 6.Liu L, Chen B, Qin S, Li S, He X, Qiu S, Zhao W, Zhao H. A novel histone deacetylase inhibitor chidamide induces apoptosis of human colon cancer cells. Biochem Biophys Res Commun. 2010;392:190–195. doi: 10.1016/j.bbrc.2010.01.011. [DOI] [PubMed] [Google Scholar]
- 7.Wu YF, Ou CC, Chien PJ, Chang HY, Ko JL, Wang BY. Chidamide-induced ROS accumulation and miR-129-3p-dependent cell cycle arrest in non-small lung cancer cells. Phytomedicine. 2019;56:94–102. doi: 10.1016/j.phymed.2018.09.218. [DOI] [PubMed] [Google Scholar]
- 8.Lu X, Ning Z, Li Z, Cao H, Wang X. Development of chidamide for peripheral T-cell lymphoma, the first orphan drug approved in China. Intractable Rare Dis Res. 2016;5:185–191. doi: 10.5582/irdr.2016.01024. [DOI] [PMC free article] [PubMed] [Google Scholar]
- 9.Hackanson B, Daskalakis M. Decitabine. Recent Results Cancer Res. 2014;201:269–297. doi: 10.1007/978-3-642-54490-3_18. [DOI] [PubMed] [Google Scholar]
- 10.Mahmood T, Yang PC. Western blot: technique, theory, and trouble shooting. N Am J Med Sci. 2012;4:429–434. doi: 10.4103/1947-2714.100998. [DOI] [PMC free article] [PubMed] [Google Scholar]
- 11.Andreotti PE, Cree IA, Kurbacher CM, Hartmann DM, Linder D, Harel G, Gleiberman I, Caruso PA, Ricks SH, Untch M, Sartori C. Chemosensitivity testing of human tumors using a microplate adenosine triphosphate luminescence assay: clinical correlation for cisplatin resistance of ovarian carcinoma. Cancer Res. 1995;55:5276–5282. [PubMed] [Google Scholar]
- 12.Livak KJ, Schmittgen TD. Analysis of relative gene expression data using real-time quantitative PCR and the 2(-Delta Delta C(T)) Method. Methods. 2001;25:402–408. doi: 10.1006/meth.2001.1262. [DOI] [PubMed] [Google Scholar]
- 13.De Kouchkovsky I, Abdul-Hay M. Acute myeloid leukemia: a comprehensive review and 2016 update. Blood Cancer J. 2016;6:e441. doi: 10.1038/bcj.2016.50. [DOI] [PMC free article] [PubMed] [Google Scholar]
- 14.Dohner H, Weisdorf DJ, Bloomfield CD. Acute myeloid leukemia. N Engl J Med. 2015;373:1136–1152. doi: 10.1056/NEJMra1406184. [DOI] [PubMed] [Google Scholar]
- 15.Rowe JM, Tallman MS. How I treat acute myeloid leukemia. Blood. 2010;116:3147–3156. doi: 10.1182/blood-2010-05-260117. [DOI] [PubMed] [Google Scholar]
- 16.He J, Chen Q, Gu H, Chen J, Zhang E, Guo X, Huang X, Yan H, He D, Yang Y, Zhao Y, Wang G, He H, Yi Q, Cai Z. Therapeutic effects of the novel subtype-selective histone deacetylase inhibitor chidamide on myeloma-associated bone disease. Haematologica. 2018;103:1369–1379. doi: 10.3324/haematol.2017.181172. [DOI] [PMC free article] [PubMed] [Google Scholar]
- 17.Shi Y, Dong M, Hong X, Zhang W, Feng J, Zhu J, Yu L, Ke X, Huang H, Shen Z, Fan Y, Li W, Zhao X, Qi J, Huang H, Zhou D, Ning Z, Lu X. Results from a multicenter, open-label, pivotal phase II study of chidamide in relapsed or refractory peripheral T-cell lymphoma. Ann Oncol. 2015;26:1766–1771. doi: 10.1093/annonc/mdv237. [DOI] [PubMed] [Google Scholar]
- 18.Fiskus W, Sharma S, Saha S, Shah B, Devaraj SG, Sun B, Horrigan S, Leveque C, Zu Y, Iyer S, Bhalla KN. Pre-clinical efficacy of combined therapy with novel beta-catenin antagonist BC2059 and histone deacetylase inhibitor against AML cells. Leukemia. 2015;29:1267–1278. doi: 10.1038/leu.2014.340. [DOI] [PMC free article] [PubMed] [Google Scholar]
- 19.Fiskus W, Sharma S, Shah B, Portier BP, Devaraj SG, Liu K, Iyer SP, Bearss D, Bhalla KN. Highly effective combination of LSD1 (KDM1A) antagonist and pan-histone deacetylase inhibitor against human AML cells. Leukemia. 2014;28:2155–2164. doi: 10.1038/leu.2014.119. [DOI] [PMC free article] [PubMed] [Google Scholar]
- 20.Garcia-Manero G, Abaza Y, Takahashi K. Pracinostat plus azacitidine in older patients with newly diagnosed acute myeloid leukemia: results of a phase 2 study. Blood Adv. 2019;3:508–518. doi: 10.1182/bloodadvances.2018027409. [DOI] [PMC free article] [PubMed] [Google Scholar]
- 21.Mohan M, Lin C, Guest E, Shilatifard A. Licensed to elongate: a molecular mechanism for MLL-based leukaemogenesis. Nat Rev Cancer. 2010;10:721–728. doi: 10.1038/nrc2915. [DOI] [PubMed] [Google Scholar]
- 22.Balgobind BV, Raimondi SC, Harbott J, Zimmermann M, Alonzo TA, Auvrignon A, Beverloo HB, Chang M, Creutzig U, Dworzak MN, Forestier E, Gibson B, Hasle H, Harrison CJ, Heerema NA, Kaspers GJ, Leszl A, Litvinko N, Nigro LL, Morimoto A, Perot C, Pieters R, Reinhardt D, Rubnitz JE, Smith FO, Stary J, Stasevich I, Strehl S, Taga T, Tomizawa D, Webb D, Zemanova Z, Zwaan CM, van den Heuvel-Eibrink MM. Novel prognostic subgroups in childhood 11q23/MLL-rearranged acute myeloid leukemia: results of an international retrospective study. Blood. 2009;114:2489–2496. doi: 10.1182/blood-2009-04-215152. [DOI] [PMC free article] [PubMed] [Google Scholar]
- 23.Bots M, Verbrugge I, Martin BP, Salmon JM, Ghisi M, Baker A, Stanley K, Shortt J, Ossenkoppele GJ, Zuber J, Rappaport AR, Atadja P, Lowe SW, Johnstone RW. Differentiation therapy for the treatment of t(8;21) acute myeloid leukemia using histone deacetylase inhibitors. Blood. 2014;123:1341–1352. doi: 10.1182/blood-2013-03-488114. [DOI] [PMC free article] [PubMed] [Google Scholar]
- 24.Lun Y, Yang JJ, Wu Y. Complete molecular remission in relapsed and refractory acute myeloid leukaemia with MLL-AF9 treated with chidamide-based chemotherapy. J Clin Pharm Ther. 2017;42:786–789. doi: 10.1111/jcpt.12577. [DOI] [PubMed] [Google Scholar]
- 25.Blagitko-Dorfs N, Schlosser P. Combination treatment of acute myeloid leukemia cells with DNMT and HDAC inhibitors: predominant synergistic gene downregulation associated with gene body demethylation. Leukemia. 2019;33:945–956. doi: 10.1038/s41375-018-0293-8. [DOI] [PubMed] [Google Scholar]
- 26.Attardi LD, Reczek EE, Cosmas C, Demicco EG, McCurrach ME, Lowe SW, Jacks T. PERP, an apoptosis-associated target of p53, is a novel member of the PMP-22/gas3 family. Genes Dev. 2000;14:704–718. [PMC free article] [PubMed] [Google Scholar]
- 27.Ihrie RA, Reczek E, Horner JS, Khachatrian L, Sage J, Jacks T, Attardi LD. Perp is a mediator of p53-dependent apoptosis in diverse cell types. Curr Biol. 2003;13:1985–1990. doi: 10.1016/j.cub.2003.10.055. [DOI] [PubMed] [Google Scholar]
- 28.Ihrie RA, Marques MR, Nguyen BT, Horner JS, Papazoglu C, Bronson RT, Mills AA, Attardi LD. Perp is a p63-regulated gene essential for epithelial integrity. Cell. 2005;120:843–856. doi: 10.1016/j.cell.2005.01.008. [DOI] [PubMed] [Google Scholar]
- 29.Awais R, Spiller DG, White MR, Paraoan L. P63 is required beside p53 for PERP-mediated apoptosis in uveal melanoma. Br J Cancer. 2016;115:983–992. doi: 10.1038/bjc.2016.269. [DOI] [PMC free article] [PubMed] [Google Scholar]
- 30.Khan IA, Yoo BH, Masson O, Baron S, Corkery D, Dellaire G, Attardi LD, Rosen KV. ErbB2-dependent downregulation of a pro-apoptotic protein Perp is required for oncogenic transformation of breast epithelial cells. Oncogene. 2016;35:5759–5769. doi: 10.1038/onc.2016.109. [DOI] [PubMed] [Google Scholar]
- 31.Gao J, Cheng Y, Hao H, Yin Y, Xue J, Zhang Q, Li L, Liu J, Xie Z, Yu S, Li B, Han W, Mu Y. Decitabine assists umbilical cord-derived mesenchymal stem cells in improving glucose homeostasis by modulating macrophage polarization in type 2 diabetic mice. Stem Cell Res Ther. 2019;10:259. doi: 10.1186/s13287-019-1338-2. [DOI] [PMC free article] [PubMed] [Google Scholar]
- 32.Krishnadas DK, Shusterman S, Bai F, Diller L, Sullivan JE, Cheerva AC, George RE, Lucas KG. A phase I trial combining decitabine/dendritic cell vaccine targeting MAGE-A1, MAGE-A3 and NY-ESO-1 for children with relapsed or therapy-refractory neuroblastoma and sarcoma. Cancer Immunol Immunother. 2015;64:1251–1260. doi: 10.1007/s00262-015-1731-3. [DOI] [PMC free article] [PubMed] [Google Scholar]
- 33.Zhao HY, Ma YH, Li DQ, Sun T, Li LZ, Li P, Liu XG, Zhou H, Hou Y, Liu Y, Han PP, Zhao YJ, Jing FM, Peng J, Hou M. Low-dose chidamide restores immune tolerance in ITP in mice and humans. Blood. 2019;133:730–742. doi: 10.1182/blood-2018-05-847624. [DOI] [PubMed] [Google Scholar]
Associated Data
This section collects any data citations, data availability statements, or supplementary materials included in this article.