Abstract
Background: This study tested the hypothesis that combined histone methyltransferase G9a inhibitor (i.e., UNC0638) and erythropoietin (EPO) was superior to either one alone for protecting myocardium from acute myocardial infarction (AMI) damage. Methods and results: Adult-male SD rats (n=30) were equally categorized into group 1 (sham-operated control), group 2 (AMI), group 3 (AMI-EPO/1000 IU/kg, I.M./3 h after AMI), group 4 (AMI- UNC0638/5 mg/kg I.P./3 h after AMI) and group 5 [AMI-UNC0638-EPO 3 h after AMI] treatment. Animals were euthanized at day 21 after AMI induction. By day 21, left-ventricular-ejection-fraction (LVEF) was highest in group 1, lowest in group 2, significantly higher in group 5 than in groups 3 and 4, but no difference between the latter two groups (all P<0.0001). The protein expressions of inflammatory (MMP-2/MM-9), fibrotic (fibronectin/Smad3/TGF-ß), apoptotic/DNA-damaged (caspas-3/PARP/γ-H2AX), cell-stress response (HIF-1α/p-Akt/p-mTOR) and autophagic (beclin-1/ratio of LC3B-II to LC3B-I) biomarkers exhibited an opposite pattern, whereas the protein expressions of endothelial integrity (CD31/vWF) and anti-oxidant (SIRT1/SIRT3) exhibited an identical pattern of LVEF among the five groups (all P<0.0001). The protein expressions (SDF-1α/VEGF/CXCR4) and cellular expressions (C-kit/CD31+//Sca-1/CD31+//KDR/CD34+) of angiogenesis biomarkers were significantly progressively increased from groups 1 to 5 (all P<0.0001). The infarction/fibrotic areas, myocyte size and number of G9a cells exhibited an opposite pattern, whereas the small-vessel density displayed an identical trend of LVEF among the groups (all P<0.0001). Flow cytometric analysis showed cellular levels of inflammation (Ly6G+/MPO+/CD11b/c+), oxidative-stress (DCFDA+) and apoptosis (early+/late+) exhibited an opposite pattern to LVEF among the groups (all P<0.0001). Conclusion: EPO-BIX01294 effectively protected myocardium against AMI-induced damage.
Keywords: Acute myocardial infarction, histone methyltransferase, G9a inhibitor, oxidative stress, inflammation, fibrosis, apoptosis
Introduction
Cardiovascular disease (CVD) remains a remains a major health issue which affects more than 23 million people worldwide and also serves as a main cause of death [1]. Previous studies have revealed that acute myocardial infarction (AMI), resulting from acute coronary artery occlusion that usually causes billions of cardiac cells damage [2] is one of the major contributors of CVD. Mammalian heart has a lower capacity of regeneration and the dead cells are always replaced by a fibrotic scar after the injury, resulting in heart failure (HF)/pump failure and sudden death. Therefore, to develop a new modality with safety and efficacy [3,4] is of utmost importance to physicians and patients.
It is well recognized that CVD is a complex pathophysiological feature affected by both genetic and environmental factors. Although some investigators have tried to unfold the mystery lurking behind the complexity and heterogeneity of CVD/AMI [5,6], these efforts remain regrettably short of fully elucidating the complex cardiovascular events in human being. Interestingly, growing evidences have verified that genetic mutations could contribute to the multiple pathologies of HF through structure alternation, i.e., the function of proteins responsible for various cellular activities [7]. Epigenetics is defined as the changes in gene expression which cannot be explained by changes in DNA sequence [8-10], but rather induced by the alterations associated with packaging and/or translation of genetic information [11]. The main alterations in epigenetics included chromatin remodeling (ATP-dependent), histone modification, DNA methylation, and RNA-based mechanisms. Among these epigenetic changes, histone modifications could cause the remodeling of chromatin and then induce the activation/inactivation of gene expression. Various studies have revealed that histone modification participates in various disease developments [12]. Each histone has an amino-terminal tail, which protrudes from the surface of the nucleosome, and participates to various post-transcriptional modifications [12-14]. These modifications lead to the chromatin’s conformation changes and further causing the altered gene expression [15] which depend on whether DNA becomes accessible or inaccessible for transcription.
Prior studies demonstrated that histone methylations are lysine methylations, i.e., histone H3 lysine 4 (H3K4), H3K9, H3K27, H3K36, H3K79 and H4K20 [16]. Previous study indicated that differential methylation patterns for H3K4 and H3K9 occur in the vicinity of various gene clusters of failing human hearts [17], suggesting a potential role of epigenetic markers in HF [16,18]. However, there is only limited information about the function of histone methylation in heart diseases. Previous studies indicated that G9a is correlated with metastasis, drug resistance, and stemness-associated genes in different types of cancer [9,19-21]. Additionally, the G9a has also been found to be upregulated in various types of human cancer cells [22] and in different situation of animal ischemic reperfusion [23]. Of interest is that inhibition of G9a ameliorates methylglyoxal-induced peritoneal fibrosis [24], attenuates renal fibrosis, retains klotho expression [25] and regulates the autophagy in cells [26,27], as well as causes bone marrow mesenchymal stem cells to exhibit a cardio competent phenotype [28]. Additionally, stress-induced Brg1-G9a-Dnmt3 has been elucidated to play an essential role for cardiac hypertrophy and dysfunction [29], whereas inhibition of histone methyltransferases SUV39H1 and G9a could lead to the effect of neuroprotection [30]. The above studies raise the hypothesis that manipulation of G9a may be a novel candidate of therapeutic impact in CVD [31-33], including in the setting of AMI.
Erythropoietin (EPO) is well recognized as a hypoxia-induced hormone, mainly produced in kidneys. EPO was originally used for treating anemic patients of various etiologies, especially in uremic patients. Interestingly, evidences have shown that EPO protected the heart against ischemic myocardial damage [34-37] mainly through anti-ischemic action, anti-apoptotic processes [34,35], neovascularization, mobilization of endothelial progenitor cells (EPCs)/angiogenesis [38-41], anti-inflammatory/anti-fibrotic [38,42] and anti-oxidant [43,44] effects. The aforementioned issues raised our hypothesis that combined EPO and G9a inhibitor might offer additional benefit than either one alone for protecting the myocardium against AMI-induced injury.
Materials and methods
Ethics
All animal procedures were approved by the Institute of Animal Care and Use Committee at Kaohsiung Chang Gung Memorial Hospital (No. 2017092704) and performed according to the care and use of laboratory animals guidelines. Animals were kept in an Association for Assessment and Accreditation of Laboratory Animal Care International (AAALAC) approved animal facility in our hospital.
Animal grouping
Pathogen-free, adult male Sprague Dawley rats (n=30) weighing 325-350 g (Charles River Technology, BioLASCO, Taiwan) were categorized into group 1 (sham-operated control), group 2 (AMI), group 3 [AMI + EPO (1000 IU/kg) by intramuscular injection 3 h after AMI induction], group 4 [AMI + UNC0638 (Sigma) (5 mg/kg) by intraperitoneal administration 3 h after AMI induction)] and group 5 (AMI + UNC0638 + EPO), respectively. Both the dosages of EPO and UNC0638 (i.e., a G9a inhibitor) were based on our previous report [45] and other previous reports [25,46], respectively with some modification.
Animal model of AMI induction
The procedures of AMI induction were followed with our previous studies [47,48]. In brief, all rats were anesthetized and exposed the heart via a left thoracotomy under sterile conditions. Sham-operated rats (SC) received the thoracotomy only, while other groups were induced AMI by left coronary artery ligation. Regional myocardial ischemia was evaluated by rapid color change from pinkish to dull reddish over the anterior surface of the LV and rapid development of akinesia and dilatation in the ischemic region. After the procedure, the thoracotomy wound was closed and all rats recovered from anesthesia in a portable animal intensive care unit (ThermoCare®) for 24 h.
Functional assessment by echocardiography
In each experimental group, transthoracic echocardiography was performed through the Vevo 2100 (Visualsonics, Toronto, Ontario, Canada) prior to and at day 60 after different treatments. The M-mode standard two-dimensional (2D) left parasternal long axis echocardiographic examination was conducted. Left ventricular internal dimensions, included left ventricular end-systolic diameter (LVESd) and left ventricular end-diastolic diameter (LVEDd), were measured at mitral valve and papillary levels of the left ventricle at least three consecutive cardiac cycles. Left ventricular ejection fraction (LVEF) was evaluated as follows: LVEF (%) = [(LVEDd3-LVESd3)/LVEDd3] × 100%.
Cell lines
H9C2 cells (Bioresource Collection and Research Center, Taiwan) were maintained in MEM medium supplemented with 10% fetal bovine serum, 2 mM L-glutamine, 0.1 mM non-essential amino acids, 0.1 mM sodium pyruvate, 100 U/ml penicillin G and 100 µg/ml streptomycin.
Western blotting
In brief, cells were sonicated in protein lysis buffer (M-PERTM mammalian protein extraction buffer, Thermo Scientific, Rockford, IL, USA) and cellular debris were removed by centrifugation. Extracted proteins were separated by sodium dodecyl sulfate polyacrylamide gel electrophoresis, transferred to a nitrocellulose membrane, and immunoblotted with the indicated [Caspase 3, PARP, p-Smad3, G9a, belclin 1, LC3B-I/II, SDF-1α, Akt, p-Akt, mTOR, p-mTOR, PI3K and γ-H2AX (Cell Signaling); Bax, TGF-ß, SIRT1, SIRT3, HIF-1α, fibronectin, MMP-2, MMP-9, VEGF, CXCR4, CD31, and vWF (Abcam); NOX-1 and NOX-2 (Sigma); and Actin (Millipore)] antibodies.
Histopathological quantification of LV myocardial fibrosis and infarct area
Briefly, the infarct area and fibrosis of LV myocardium were identified by hematoxylin and eosin (H & E) and Masson’s trichrome staining, respectively. Image Tool 3 (University of Texas, Health Science Center, San Antonio, UTHSCSA; Image Tool for Windows, Version 3.0, USA) was used to calculate the integrated area (µm2) of infarct area and fibrosis on each section. The method of mean integrated area (µm2) of fibrosis in LV myocardium in each groups were same with our previous study [49]. In addition, the small blood vessels were performed with α-SMA by immunohistochemisty (IHC) staining. The small vessel densities in left ventricular infarct area were also be calculated.
Oxidative stress reaction in in vitro study
Oxidative stress reaction evaluation was conducted by the Oxyblot Oxidized Protein Detection Kit (Chemicon). DNPH derivatization was carried out according to the manufacturer’s instructions. One-dimensional electrophoresis was carried out on 12% SDS/polyacrylamide gel after DNPH derivatization. Proteins were transferred to nitrocellulose membranes, which were then incubated with primary and secondary antibodies at room temperature.
Flow cytometric analysis for examining early and late cell apoptosis
Cell apoptosis were determined through the double staining of annexin V and propidium iodide (PI) by flow cytometry. Additionally, the flow cytometric analysis for intracellular oxidative stress (i.e., using DCFDA dye staining) was also performed in in vitro study.
Statistical analysis
Quantitative data were expressed as mean ± standard deviation (SD). Statistical analysis was performed by ANOVA followed by Bonferroni multiple comparison post hoc test. Statistical analysis was performed using SAS statistical software for Windows version 8.2 (SAS institute, Cary, NC, USA). Probability value of less than 0.05 is considered as statistically significant.
Results
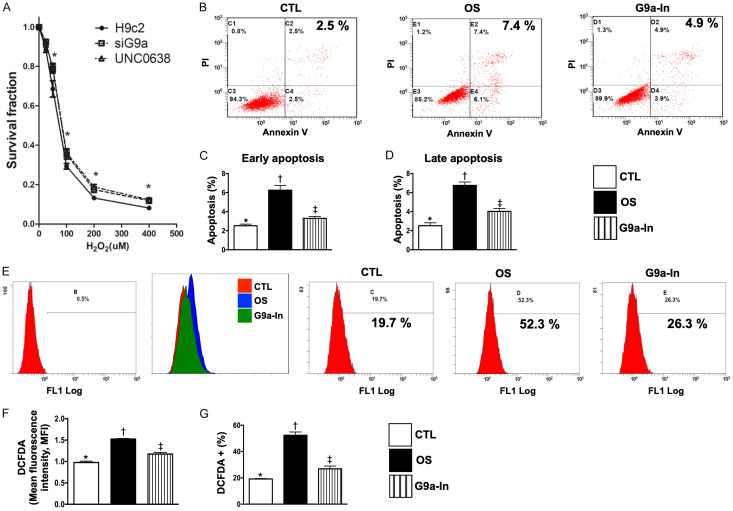
Cell survival rate and flow cytometric analysis for clarifying the therapeutic impact of G9a-In (UNC0638) on protecting the H9C2 cells against H2O2-indcued apoptosis and oxidative stress (Figure 1)
Figure 1.
Protective effects of G9a inhibitor and si-G9a on survival rate of H9C2 cells undergoing the H2O2 treatment, and flow cytometric analysis for clarifying the therapeutic impact of G9a inhibitor on protecting H9C2 cells against H2O2-indcued apoptosis and oxidative stress. A. Illustrating the survival rate of H9C2 underwent the stepwise-increased H2O2 concentration. The results showed that si-G9a (i.e., siG9a) and UNC0638 (G9a inhibitor, G9a-In) therapy significantly improved the H9C2 survival rate, * vs. H9c2 only, P<0.005. B. Illustrating annexin-V/PI analysis by flow cytometry of H9C2 cells treated with 100 µM H2O2 for 4 h and pretreated with 1.0 μM G9a inhibitor for 3 h. Analytical results of H9C2 apoptosis: C. For early apoptosis: * vs. other groups with different symbols (†, ‡), P<0.0001; D. For late apoptosis * vs. other groups with different symbols (†, ‡), P<0.0001. E. Illustrating oxidative stress fluorescent intensity (i.e., stained by DCFDA) by flow cytometry of H9C2 cells treated with 100 µM H2O2 for 4 h and pretreated with 1.0 μM G9a inhibitor for 3 h. Analytical results of fluorescent intensity: F. Expression of mean fluorescent intensity (MIF), * vs. other groups with different symbols (†, ‡), P<0.001; G. Expression of DCFDA (%), * vs. other groups with different symbols (†, ‡), P<0.0001. DCFDA = Cell-free 2’,7’-dichloroflurescin diacetate. All statistical analyses were performed by one-way ANOVA, followed by Bonferroni multiple comparison post hoc test (n=4 for each group). Symbols (*, †, ‡) indicate significance (at 0.05 level). CTL = control group; OS = oxidative stress; G9a-In = G9a inhibitor (i.e., UNCO638).
To verify the role of G9a in regulating the cytotoxicity in cardiomyocyte cells, we first evaluated the cytotoxicity induced by H2O2 (i.e., a potent oxidative stress substance) in parental, G9a-depleted and pretreated with G9a inhibitor (UNC0638) (G9a-In) in H9C2 cells. Our results indicated that knockdown of G9a or pretreated with G9a-In significantly reduce the cytotoxicity in H9C2 cells (Figure 1A). Next, we conducted the flow cytometric analysis and the results demonstrated that, as compared with controls (CTL), early (annexin V+/PI-) and late (annexin V+/PI+) apoptosis of H9C2 cells at 4 h were significantly increased in oxidative stress (OS) (i.e., treated by H2O2) (Figure 1B-D). On the contrary, these parameters were significantly reduced by G9a-In treatment (Figure 1B-D). In addition, the flow cytometric analysis revealed that the intracellular oxidative stress (i.e., stained by DCFDA dye) was significantly increased in OS than in CTL but decreased in G9a-In (Figure 1E-G). These findings, on addition to identifying the G9a played a crucial role on regulating H2O2-indcued cytotoxicity, highlight that inhibition of G9a effectively protected the H9C2 cells against the H2O2-elicted oxidative stress/free radical damage.
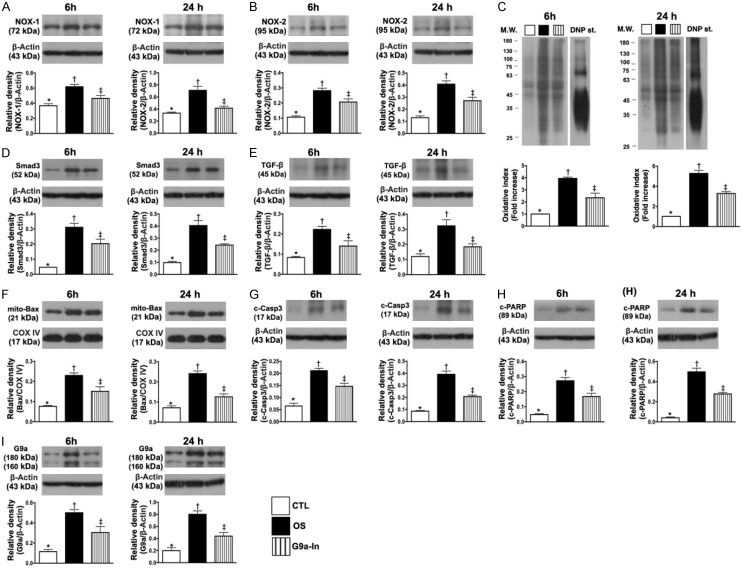
In vitro study to verify the therapeutic impact of G9a-In (UNC0638) on suppressing the H2O2-induced oxidative stress, apoptosis and fibrosis of H9C2 cells (Figure 2)
Figure 2.
In vitro study to verify the therapeutic impact of G9a inhibitor (UNC0638) on inhibiting the H2O2-induced oxidative stress, apoptosis and fibrosis of H9C2 cells. A. Protein expression of NOX-1, at 6 h: * vs. other groups with different symbols (†, ‡), P<0.005; at 24 h: * vs. other groups with different symbols (†, ‡), P<0.001. B. Protein expression of NOX-2, at 6 h: * vs. other groups with different symbols (†, ‡), P<0.001; at 24 h: * vs. other groups with different symbols (†, ‡), P<0.001. C. Oxidized protein expression, at 6 h: *vs. other groups with different symbols (†, ‡), P<0.0001; at 24 h, *vs. other groups with different symbols (†, ‡), P<0.0001. (Note: left and right lines shown on the upper panel represent protein molecular weight marker and control oxidized molecular protein standard, respectively). M.W. = molecular weight; DNP = 1-3 dinitrophenylhydrazone. D. Protein expression of Smad3, at 6 h: * vs. other groups with different symbols (†, ‡), P<0.0001; at 24 h: * vs. other groups with different symbols (†, ‡), P<0.0001. E. Protein expression of transforming growth factor (TGF)-ß, at 6 h: * vs. other groups with different symbols (†, ‡), P<0.005; at 24 h: * vs. other groups with different symbols (†, ‡), P<0.005. F. Protein expression of mitochondrial (Mito)-Bax, at 6 h: * vs. other groups with different symbols (†, ‡), P<0.001; at 24 h: * vs. other groups with different symbols (†, ‡), P<0.0001. G. Protein expression of cleaved caspase 3 (c-Csp-3), at 6 h: * vs. other groups with different symbols (†, ‡), P<0.001; at 24 h: * vs. other groups with different symbols (†, ‡), P<0.0001. H. Protein expression of c-PARP, at 6 h: * vs. other groups with different symbols (†, ‡), P<0.0001; at 24 h: * vs. other groups with different symbols (†, ‡), P<0.0001. I. Protein expression of G9a, at 6 h, * vs. other groups with different symbols (†, ‡), P<0.005; at 24 h: * vs. other groups with different symbols (†, ‡), P<0.001. (n=4 for each group). CTL = control group; OS = oxidative stress; G9a-In = G9a inhibitor.
To verify whether G9a-In treatment would protect H9C2 cells against H2O2 damage, the experimental study was categorized into (1) H9C2 in culture medium (control group: CTL), (2) H9C2 + H2O2 (100 µM) (OS) and (3) H9C2 + H2O2 + G9a-In (1.0 µM) (G9a-In), groups and cells were cultured for two time intervals (i.e., 6 h and 24 h), respectively.
In vitro, the protein expressions of NOX-1, NOX-2 (Figure 2A, 2B) and oxidized protein (Figure 2C) in H9C2, three indicators of oxidative stress, were significantly increased in OS than in CTL and G9a-In, and significantly increased in G9a-In than in OS at time intervals of 6 and 24 h cell culturing.
We further conducted the Western blotting for time intervals of 6 and 24 h cell culturing, and the results demonstrated that the protein expressions of Smad3 and TGF-ß (Figure 2D, 2E), two indices of fibrosis, and the protein expressions of mitochondrial Bax, cleaved caspase 3 and cleaved PARP (Figure 2F-H), three apoptotic biomarkers, were also significantly increased in OS than in CTL and G9a-In and significantly increased in G9a-In than in CTL.
Furthermore, we conducted the Western blotting for verifying the G9a protein level at the time intervals of 6 and 24 h cell culturing. The results showed that this protein expression was significantly increased in OS than in CTL that was remarkably suppressed by G9a-In treatment at these two time points (Figure 2I).
Combination of G9a inhibitor and EPO reduced the circulatory levels of inflammatory biomarkers and enhanced the circulating numbers of endothelial progenitor cells by day 3 after AMI induction (Figure 3)
Figure 3.
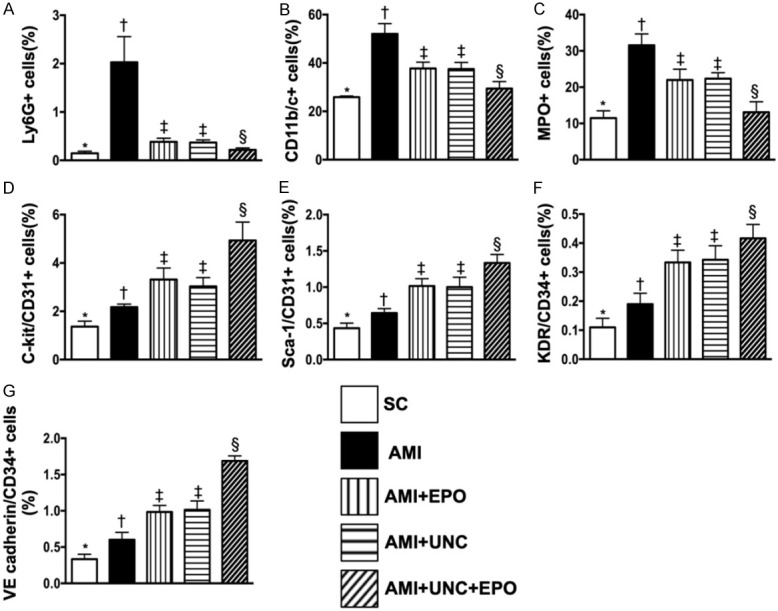
Flow cytometric analyses of circulatory levels of inflammatory biomarkers and endothelial progenitor cells by day 3 after AMI induction. A. Circulatory level of Ly6G+ cells, * vs. other groups with different symbols (†, ‡, §), P<0.0001. B. Circulatory level of CD11b/c+ cells, * vs. other groups with different symbols (†, ‡, §), P<0.0001. C. Circulatory level of myeloperoxidase (MPO)+ cells, * vs. other groups with different symbols (†, ‡, §), P<0.0001. D. Circulatory number of C-kit/CD31+ cells, * vs. other groups with different symbols (†, ‡, §), P<0.0001. E. Circulatory number of Sca-1/CD31+ cells, * vs. other groups with different symbols (†, ‡, §), P<0.0001. F. Circulatory number of KDR/CD34+ cells, * vs. other groups with different symbols (†, ‡, §), P<0.0001. G. Circulatory number of VE cadherin/CD34+ cells, * vs. other groups with different symbols (†, ‡, §), P<0.0001. (n=6 for each group). SC = sham-operated control; AMI = acute myocardial infarction; EPO = erythropoietin; UNC = UNC0638, a G9a inhibitor.
By day 3 after AMI induction, flow cytometric analysis demonstrated that the circulating levels of Ly6G+, CD11b/c+ and MPO+ cells, three indicators of inflammation, were highest in group 2 (i.e., AMI only), lowest in group 1 (sham-operated control), significantly higher in groups 3 (AMI + EPO) and 4 (AMI + G9a-In) than in group 5 (AMI + G9a-In + EPO), but no difference in groups 3 and 4 (Figure 3A-C). Additionally, this analysis showed that the circulating level of endothelial progenitor cells (i.e., with surface makers as: C-kit/CD31+, Sca-1/CD31+, KDR/CD34+, VE cadherin/CD34+) was significantly progressively increased from groups 1 to 5, suggesting an intrinsic response to ischemic stimulation and upregulated by EPO-G9a-In treatment (Figure 3D-G).
Combination of G9a inhibitor and EPO restored the LVEF and reduced the infarct area by day 21 after AMI induction (Figure 4)
Figure 4.
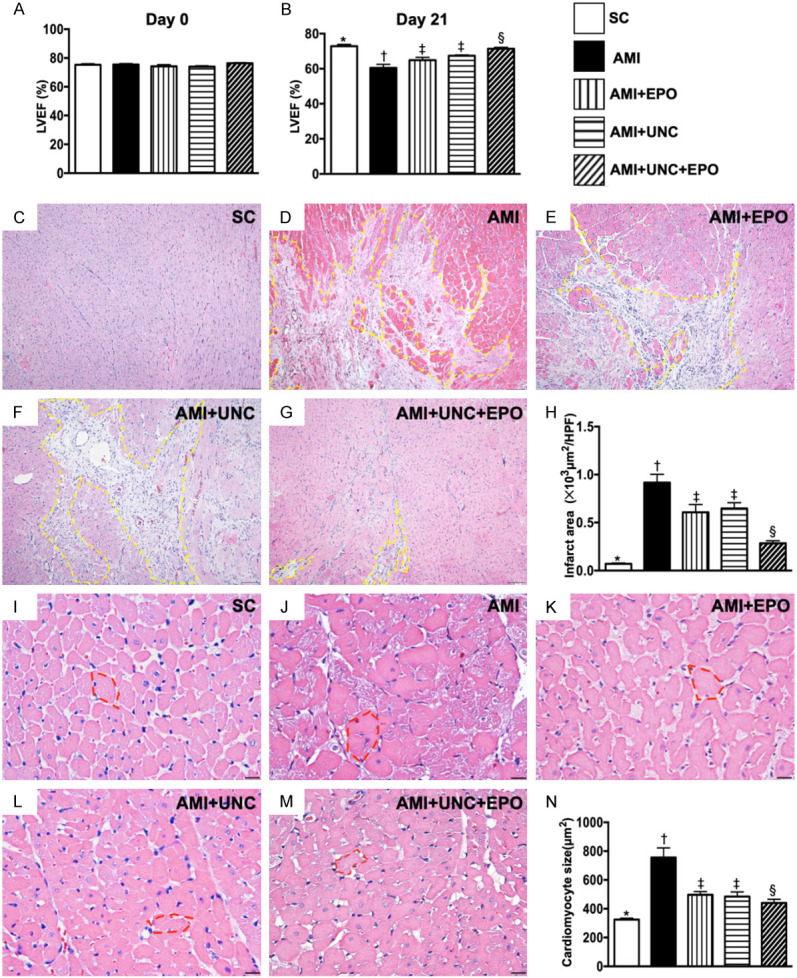
The LVEF and infarct area by day 21 after AMI induction. A. The baseline left ventricular ejection fraction (LVEF), P>0.5. B. The LVEF at day 21, * vs. other groups with different symbols (†, ‡, §), P<0.001. C-G. H.E. stain microscopic finding (100 ×) for identification of LV infarction area (yellow dotted line). H. Analytical result of infarct area, * vs. other groups with different symbols (†, ‡, §), P<0.0001. Scale bars in right lower corner represent 100 µm. I-M. Illustrating the H.E., stain of microscopic finding (400 ×) for identification of cardiomyocyte size (red circle). N. Analytical result of cardiomyocyte size, * vs. other groups with different symbols (†, ‡, §), P<0.0001. Scale bars in right lower corner represent 20 µm. (n=6 for each group). SC = sham-operated control; AMI = acute myocardial infarction; EPO = erythropoietin; UNC = UNC0638, a G9a inhibitor.
The baseline of LVEF was no difference among the five groups. However, by day 21 after AMI induction, we found that LVEF was highest in group 1 and lowest in group 2. After different treatments, the LVEF in group 5 was highest in group 3 to 5 (Figure 4A, 4B). On the other hand, the infarct area of left ventricle exhibited an opposite pattern of LVEF among the five groups (Figure 4C-H). Furthermore, the cardiomyocyte size displayed similar pattern of infarct area among the five groups (Figure 4I-N).
Combination of G9a inhibitor and EPO supressed the fibrotic area and inhibited the G9a expression in LV infarct area by day 21 after AMI induction (Figure 5)
Figure 5.
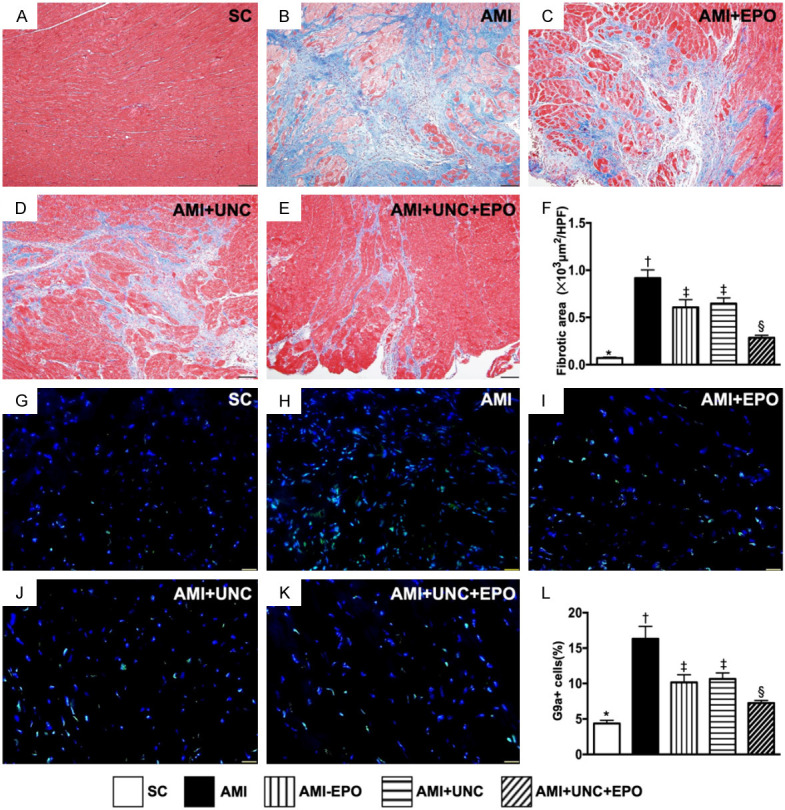
Fibrotic area and cellular expression of G9a in LV infarct area by day 21 after AMI induction. A-E. Illustrating the Masson’s trichrome stain microscopic finding (100 ×) for identification of fibrotic area (blue color). F. Analytical result of fibrotic area, * vs. other groups with different symbols (†, ‡, §), P<0.0001. Scale bars in right lower corner represent 100 µm. G-K. Illustrating the immunofluorescent microscopic finding (400 ×) for identification of the cellular expression of G9a (green color). L. Analytical result of number of G9a+ cells, * vs. other groups with different symbols (†, ‡, §), P<0.0001. Scale bars in right lower corner represent 20 µm. (n=6 for each group). SC = sham-operated control; AMI = acute myocardial infarction; EPO = erythropoietin; UNC = UNC0638, a G9a inhibitor.
The Masson’s trichrome stain demonstrated that the LV infarct area was highest in group 2, lowest in group 1 and significantly increased in groups 3 and 4 than in group 5 (Figure 5A-F). Additionally, IF staining revealed that the cellular expression of G9a in LV infarct area was same to that of fibrotic area among the five groups (Figure 5G-L).
Combination of G9a inhibitor and EPO promoted angiogenesis in LV myocardium by day 21 after AMI induction (Figure 6)
Figure 6.
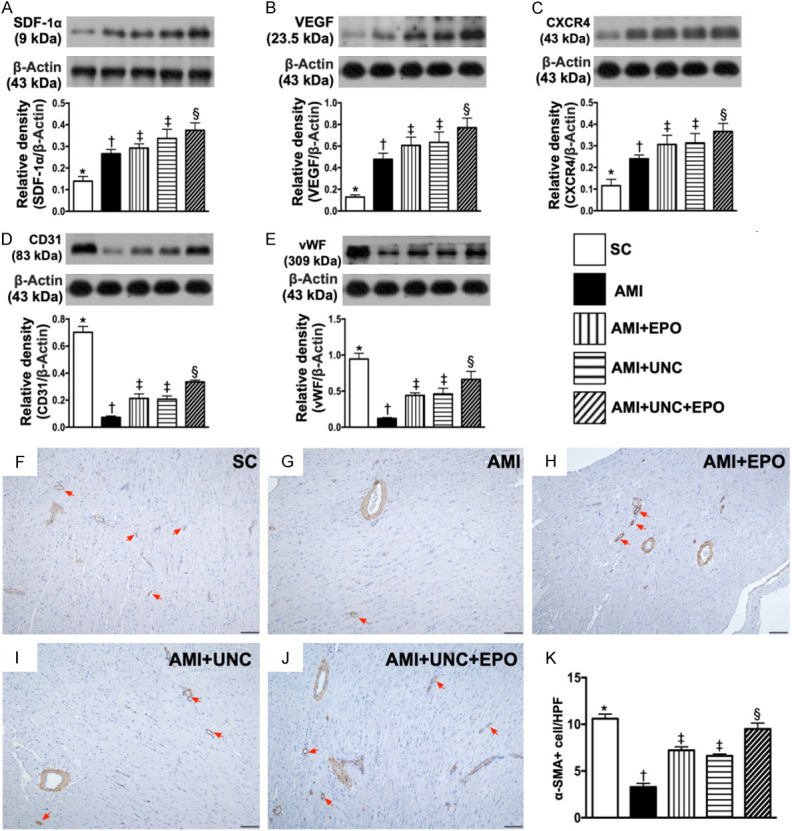
Angiogenesis in LV myocardium by day 21 after AMI induction. A. Protein expressions of stromal cell-derived factor (SDF)-1α, * vs. other groups with different symbols (†, ‡, §), P<0.0001. B. Protein expression of vascular endothelial growth factor (VEGF), * vs. other groups with different symbols (†, ‡, §), P<0.0001. C. Protein expression of CXCR4, * vs. other groups with different symbols (†, ‡, §), P<0.0001. D. Protein expression of CD31, * vs. other groups with different symbols (†, ‡, §), P<0.0001. E. Protein expression of vascular von Willebrand factor (vWF), * vs. other groups with different symbols (†, ‡, §), P<0.0001. F-J. Illustrating the positively stain α-SMA (100 ×) for identification of small vessel density (red color). K. Analytical result of number of small vessels (≤ 25 µM), * vs. other groups with different symbols (†, ‡, §), P<0.0001. (n=6 for each group). SC = sham-operated control; AMI = acute myocardial infarction; EPO = erythropoietin; UNC = UNC0638, a G9a inhibitor.
The protein expressions of SDF-1α, VEFG and CXCR4, three indices of angiogenesis factors, were significantly progressively increased from groups 1 to 5, highlighting an intrinsic response to ischemic stress and further being augmented by EPO-Ga9-In treatment (Figure 6A-C). On the other hand, the protein expressions of CD31 and vWF, two indicators of endothelial functional integrity, were highest in group 1 and lowest in group 2, significantly higher in group 5 than in groups 3 and 4, but both revealed no difference between these latter two groups (Figure 6D, 6E). Additionally, the number of small vessels in LV infarct area exhibited an identical pattern of CD31 among the five groups (Figure 6F-K).
Combination of G9a inhibitor and EPO decreased apoptotic, fibrotic, and DNA-damage protein expressions by day 21 after AMI induction (Figure 7)
Figure 7.
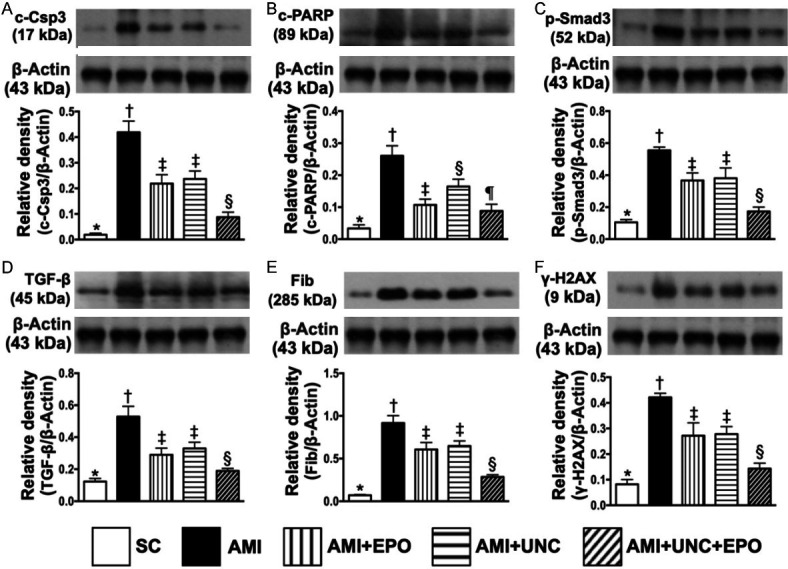
Protein expressions of apoptotic, fibrotic and DNA-damage biomarkers by day 21 after AMI induction. A. Protein expression of cleaved caspase 3 (c-Csp3), * vs. other groups with different symbols (†, ‡, §), P<0.0001. B. Protein expression of cleaved poly (ADP-ribose) polymerase (PARP), * vs. other groups with different symbols (†, ‡, §, ¶), P<0.0001. C. Protein expression of phosphorylated (p)-Samd3, * vs. other groups with different symbols (†, ‡, §), P<0.0001. D. Protein expression of transforming growth factor (TGF)-β, * vs. other groups with different symbols (†, ‡, §), P<0.0001. E. Protein expression of fibronectin (Fib), * vs. other groups with different symbols (†, ‡, §), P<0.0001. F. Protein expression of γ-H2AX, * vs. other groups with different symbols (†, ‡, §), P<0.000. (n=6 for each group). SC = sham-operated control; AMI = acute myocardial infarction; EPO = erythropoietin; UNC = UNC0638, a G9a inhibitor.
The protein expressions of cleaved caspase 3 and cleaved PARP, two indicators of apoptosis, were highest in group 2, lowest in group 1, significantly higher in groups 3 and 4 than in group 5, but no difference between groups 3 and 4 in cleaved caspase 3, whereas significantly higher in group 4 than in group in cleaved PARP (Figure 7A, 7B). Additionally, protein expressions of Samd3, TGF-ß and fibronectin, three indicators of fibrotic biomarkers, expressed an identical pattern of apoptosis among the five groups (Figure 7C-E). Furthermore, the protein expression of γ-H2AX, an indicator of DNA-damage marker, also exhibited an identical pattern of apoptosis among the five groups.
Combination of G9a inhibitor and EPO suppressed protein expressions of inflammatory, anti-oxidative-stress, anti-ischemic biomarkers and G9a by day 21 after AMI induction (Figure 8)
Figure 8.
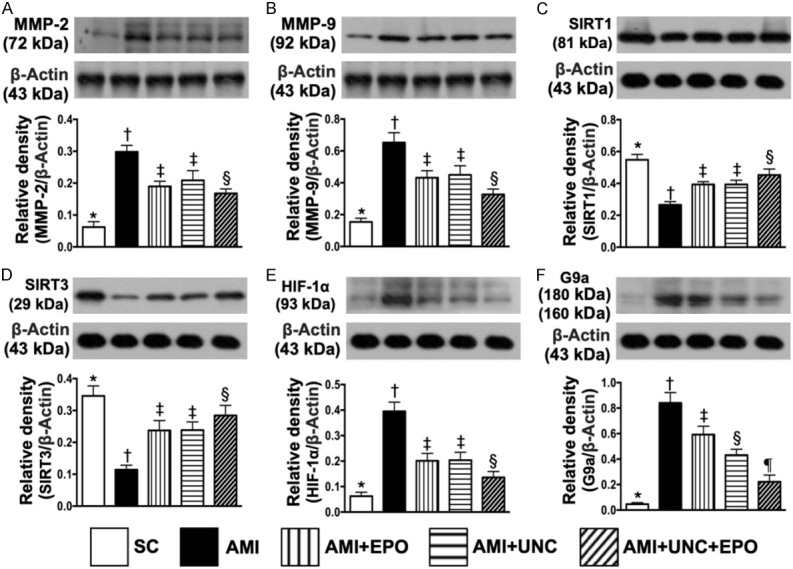
Protein expressions of inflammatory, anti-oxidative-stress, anti-ischemic biomarkers and G9a by day 21 after AMI induction. A. Protein expression of matrix metalloproteinase (MMP)-2, * vs. other groups with different symbols (†, ‡, §), P<0.0001. B. Protein expression of MMP-9, * vs. other groups with different symbols (†, ‡, §), P<0.0001. C. Protein expression of SIRT1, * vs. other groups with different symbols (†, ‡, §), P<0.001. D. Protein expression of SIRT3, * vs. other groups with different symbols (†, ‡, §), P<0.001. E. Protein expression of hypoxia induced factor (HIF)-1α, * vs. other groups with different symbols (†, ‡, §), P<0.0001. F. Protein expression of G9a, * vs. other groups with different symbols (†, ‡, §, ¶), P<0.0001. (n=6 for each group). SC = sham-operated control; AMI = acute myocardial infarction; EPO = erythropoietin; UNC = UNC0638, a G9a inhibitor.
The protein expressions of MMP-2 and MMP-9, two indicators of inflammation, were highest in group 2, lowest in group 1, significantly higher in groups 3 and 4 than in group 5, but both showed no difference between groups 3 and 4 (Figure 8A, 8B). Additionally, the protein expressions of SIRT1 and SIRT3, two indicators of anti-oxidant, displayed an opposite pattern of inflammation among the five groups (Figure 8C, 8D). Furthermore, the protein expression of HIF-1α, an indicator of angiogenesis factor, was highest in group 2 and lowest in group 1, significantly lower in group 5 than in groups 3 and 4, but no difference between groups 3 and 4, implying an intrinsic response to ischemic stress supressed by EPO-G9a inhibitor (Figure 8E). Moreover, the protein expression of G9a was lowest in group 1, highest in group 2, significantly lower in group 5 than groups 3 and 4 and significantly lower in group 4 than in group 3 (Figure 8F).
Combination of G9a inhibitor and EPO ameliorated the autophagy and cell-stress signaling by day 21 after AMI induction (Figure 9)
Figure 9.
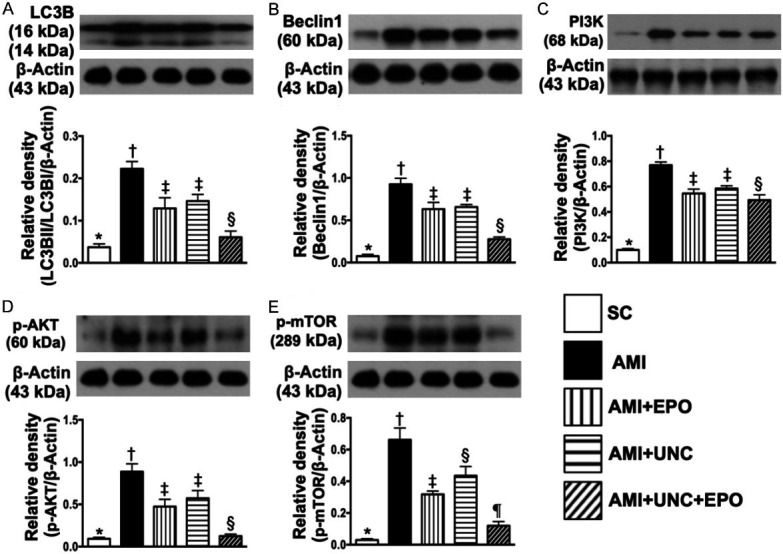
Protein expressions of autophagy and cell-stress signaling by day 21 after AMI induction. A. Protein expression of ratio of LC3BII/LC3BI, * vs. other groups with different symbols (†, ‡, §), P<0.0001. B. Protein expression of beclin-1, * vs. other groups with different symbols (†, ‡, §), P<0.0001. C. Protein expression of PI3K, * vs. other groups with different symbols (†, ‡, §), P<0.0001. D. Protein expression of phosphorylated (p)-AKT, * vs. other groups with different symbols (†, ‡, §), P<0.0001. E. Protein expression of p-mTOR, * vs. other groups with different symbols (†, ‡, §), P<0.0001. (n=6 for each group). SC = sham-operated control; AMI = acute myocardial infarction; EPO = erythropoietin; UNC = UNC0638, a G9a inhibitor.
The protein expression of ratio of LC3BII/LC3BI, an indicator of autophagy, was highest in group 2, lowest in group 1, significantly higher in groups 3 and 4 than in group 5, but no difference was observed between groups 3 and 4 (Figure 9A). Additionally, the protein expression of beclin1, a central role in autophagy in response to cell stress for a process of programmed cell survival, exhibited an identical pattern of autophagy (Figure 9B). The protein expressions of PI3K, phosphorylated (p)-AKT and p-mTOR, the signaling pathway of cell survival, were highest in group 2, lowest in group 1, significantly higher in group 4 than in groups 3 and 5, and significantly higher in group 3 than in group 5, highlighting a cellular intrinsic response to ischemic stress was attenuated by EPO-G9a-In treatment (Figure 9C-E).
Discussion
This study which investigated the therapeutic impact of EPO-G9a inhibitor on protecting the heart from AMI injury yielded several important preclinical implications. First, in vitro study demonstrated that G9a inhibitor effectively protected the H9C2 cells against H2O2 (i.e., oxidative stress) induced damage. Second, in vivo, as compared with SC animals, numerous molecular-cellular perturbations were elicited in AMI animals. These molecular-cellular perturbations further damaged the myocardium and ultimately caused LVEF deterioration. However, these phenomena were remarkably reversed by either EPO or G9a inhibitor and further remarkably reversed by combined EPO-G9a inhibitor therapy in AMI animals.
Currently, to the best of our knowledge, no report addressing the therapeutic impact of G9a inhibitor on protecting the heart from AMI. The novel finding in the present study was that by the end of study period (i.e., at day 21 after AMI induction), the LVEF was significantly preserved by either G9a inhibitor or EPO as compared to the AMI only that was further significantly further preserved in combined EPO and G9a inhibitor treatment, highlighting that G9a inhibitor treatment may potentially act as a complementary modality for AMI patients with and without reperfusion therapy.
Intriguingly, previous studies have revealed that inhibition of G9a ameliorates methylglyoxal-induced peritoneal fibrosis [24], attenuates renal fibrosis and regulate autophagy in cells [26,27] and leads to neuroprotection induced by cerebral ischemia [30]. In addition, EPO improved ischemia-related organ dysfunction via anti-inflammatory, anti-fibrotic [38,42] and antioxidant [43,44] effects. An essential finding in this in vitro study was that H2O2 treatment significantly upregulated the cellular apoptotic, oxidative-stress and fibrotic biomarkers as well as G9a protein expression in H9C2. However, these parameters were remarkably downregulated after receiving the G9a inhibitor treatment. In vivo, as compared with the SC group, the myocardial damage score, fibrotic area, apoptotic and DNA-damaged biomarkers, autophagy, cardiomyocyte size, inflammatory reaction and oxidative stress as well as the protein expression of G9a were substantially increased in AMI animals. Importantly, these biomarkers strongly associated with the deterioration in ischemia-related organ dysfunction [45,47,48] were significantly suppressed by either EPO or G9a inhibitor treatment and further significantly reduced by the combination of EPO and G9a inhibitor treatment. In this way, our findings, in addition to extending those of previous studies [24,26,27,38,42-44], could partially explain why the LVEF was greatly improved by EPO-G9a inhibitor treatment.
Interestingly, our previous study has clearly identified a strong association between activated MAPK (ERK 2, p38) and Akt, i.e., called “cell stress response signaling” pathways and deterioration of heart function after AMI [50]. A principal finding in the present study was that PI3K/p-AKT/m-TOR and HIF-1α (i.e., intrinsic stress signaling pathway) were found to markedly elevate in AMI animals. Our finding was consistent with those of our previous study [50]. Of distinctive finding is that this stress response signaling was eminently suppressed by either EPO or G9a inhibitor and furthermore obviously suppressed by combined EPO-G9a treatment. Our findings could at least in part explain why the LVEF in AMI animals was significantly improved after receiving EPO-G9a treatment.
Link between enhancing angiogenesis and improving LVEF in setting of ischemic cardiomyopathy has been well recognized by previous studies [47,48,51]. Additionally, our previous study has also demonstrated that EPO therapy notably enhanced circulating level of endothelial progenitor cells in patients after ischemic stroke [52]. Other study also indicated that G9a inhibitor could enhance more stem cell population to regenerate new myocytes for cardiac repair [53]. One important finding in the present study was that the cellular and molecular levels of angiogenesis biomarkers were significantly increased in AMI animals after receiving EPO or G9a inhibitor therapy and even more significantly increased in those AMI animals after receiving combined EPO-G9a inhibitor therapy. Our findings, in addition to being comparable with those of previous studies [46-48,52], once again explained why the LVEF was preserved by EPO or G9a inhibitor therapy and furthermore preserved by combined EPO-G9a inhibitor therapy in AMI animals.
This study also has limitations. First, the study period was relatively short. So, the long-term outcome and LVEF after EPO-G9a inhibitor treatment remain unclear. Second, despite extended works were performed in in vitro and in vivo studies, the exactly underlying mechanism of G9a inhibition and the combination of G9a inhibitor and EPO treatments for improving the heart function is still not fully verified and needs further study.
Conclusions
Overall, our study indicated that G9a plays an important role in AMI induced heart failure. In addition, the combination of EPO and G9a inhibitor treatment effectively preserved the LV architecture and functional integrity in AMI rat mainly through the downregulating of several factors included inflammatory reaction, oxidative stress, fibrosis, apoptosis and cell stress response signaling and upregulating the angiogenic and antioxidant effects.
Acknowledgements
This study was supported by a program grant from Chang Gung Memorial Hospital, Chang Gung University (Grant number: CMRPG8G1141) and a program grant from Kaohsiung Medical University Hospital (KMUH108-8R37).
Disclosure of conflict of interest
None.
References
- 1.Bui AL, Horwich TB, Fonarow GC. Epidemiology and risk profile of heart failure. Nat Rev Cardiol. 2011;8:30–41. doi: 10.1038/nrcardio.2010.165. [DOI] [PMC free article] [PubMed] [Google Scholar]
- 2.Laflamme MA, Murry CE. Regenerating the heart. Nat Biotechnol. 2005;23:845–856. doi: 10.1038/nbt1117. [DOI] [PubMed] [Google Scholar]
- 3.Lee MS, Lee FY, Chen YL, Sung PH, Chiang HJ, Chen KH, Huang TH, Chen YL, Chiang JY, Yin TC, Chang HW, Yip HK. Investigated the safety of intra-renal arterial transfusion of autologous CD34+ cells and time courses of creatinine levels, endothelial dysfunction biomarkers and micro-RNAs in chronic kidney disease patients-phase I clinical trial. Oncotarget. 2017;8:17750–17762. doi: 10.18632/oncotarget.14831. [DOI] [PMC free article] [PubMed] [Google Scholar]
- 4.Sung PH, Chiang HJ, Wallace CG, Yang CC, Chen YT, Chen KH, Chen CH, Shao PL, Chen YL, Chua S, Chai HT, Chen YL, Huang TH, Yip HK, Lee MS. Exendin-4-assisted adipose derived mesenchymal stem cell therapy protects renal function against co-existing acute kidney ischemia-reperfusion injury and severe sepsis syndrome in rat. Am J Transl Res. 2017;9:3167–3183. [PMC free article] [PubMed] [Google Scholar]
- 5.Abi Khalil C, Roussel R, Mohammedi K, Danchin N, Marre M. Cause-specific mortality in diabetes: recent changes in trend mortality. Eur J Prev Cardiol. 2012;19:374–381. doi: 10.1177/1741826711409324. [DOI] [PubMed] [Google Scholar]
- 6.Cohen JB, Cohen DL. Cardiovascular and renal effects of weight reduction in obesity and the metabolic syndrome. Curr Hypertens Rep. 2015;17:34. doi: 10.1007/s11906-015-0544-2. [DOI] [PMC free article] [PubMed] [Google Scholar]
- 7.Creemers EE, Wilde AA, Pinto YM. Heart failure: advances through genomics. Nat Rev Genet. 2011;12:357–362. doi: 10.1038/nrg2983. [DOI] [PubMed] [Google Scholar]
- 8.Egger G, Liang G, Aparicio A, Jones PA. Epigenetics in human disease and prospects for epigenetic therapy. Nature. 2004;429:457–463. doi: 10.1038/nature02625. [DOI] [PubMed] [Google Scholar]
- 9.Baxter E, Windloch K, Gannon F, Lee JS. Epigenetic regulation in cancer progression. Cell Biosci. 2014;4:45. doi: 10.1186/2045-3701-4-45. [DOI] [PMC free article] [PubMed] [Google Scholar]
- 10.Callinan PA, Feinberg AP. The emerging science of epigenomics. Hum Mol Genet. 2006;15 Spec No 1:R95–101. doi: 10.1093/hmg/ddl095. [DOI] [PubMed] [Google Scholar]
- 11.Bird A. Perceptions of epigenetics. Nature. 2007;447:396–398. doi: 10.1038/nature05913. [DOI] [PubMed] [Google Scholar]
- 12.Handy DE, Castro R, Loscalzo J. Epigenetic modifications: basic mechanisms and role in cardiovascular disease. Circulation. 2011;123:2145–2156. doi: 10.1161/CIRCULATIONAHA.110.956839. [DOI] [PMC free article] [PubMed] [Google Scholar]
- 13.Duygu B, Poels EM, da Costa Martins PA. Genetics and epigenetics of arrhythmia and heart failure. Front Genet. 2013;4:219. doi: 10.3389/fgene.2013.00219. [DOI] [PMC free article] [PubMed] [Google Scholar]
- 14.Jenuwein T, Allis CD. Translating the histone code. Science. 2001;293:1074–1080. doi: 10.1126/science.1063127. [DOI] [PubMed] [Google Scholar]
- 15.Margueron R, Reinberg D. Chromatin structure and the inheritance of epigenetic information. Nat Rev Genet. 2010;11:285–296. doi: 10.1038/nrg2752. [DOI] [PMC free article] [PubMed] [Google Scholar]
- 16.Martin C, Zhang Y. The diverse functions of histone lysine methylation. Nat Rev Mol Cell Biol. 2005;6:838–849. doi: 10.1038/nrm1761. [DOI] [PubMed] [Google Scholar]
- 17.Kaneda R, Takada S, Yamashita Y, Choi YL, Nonaka-Sarukawa M, Soda M, Misawa Y, Isomura T, Shimada K, Mano H. Genome-wide histone methylation profile for heart failure. Genes Cells. 2009;14:69–77. doi: 10.1111/j.1365-2443.2008.01252.x. [DOI] [PubMed] [Google Scholar]
- 18.Shi Y, Whetstine JR. Dynamic regulation of histone lysine methylation by demethylases. Mol Cell. 2007;25:1–14. doi: 10.1016/j.molcel.2006.12.010. [DOI] [PubMed] [Google Scholar]
- 19.Luo CW, Wang JY, Hung WC, Peng G, Tsai YL, Chang TM, Chai CY, Lin CH, Pan MR. G9a governs colon cancer stem cell phenotype and chemoradioresistance through PP2A-RPA axis-mediated DNA damage response. Radiother Oncol. 2017;124:395–402. doi: 10.1016/j.radonc.2017.03.002. [DOI] [PubMed] [Google Scholar]
- 20.Yin HL, Wu CC, Lin CH, Chai CY, Hou MF, Chang SJ, Tsai HP, Hung WC, Pan MR, Luo CW. beta1 integrin as a prognostic and predictive marker in triple-negative breast cancer. Int J Mol Sci. 2016;17:1432. doi: 10.3390/ijms17091432. [DOI] [PMC free article] [PubMed] [Google Scholar]
- 21.Tsai YP, Wu KJ. Epigenetic regulation of hypoxia-responsive gene expression: focusing on chromatin and DNA modifications. Int J Cancer. 2014;134:249–256. doi: 10.1002/ijc.28190. [DOI] [PubMed] [Google Scholar]
- 22.Huang J, Berger SL. The emerging field of dynamic lysine methylation of non-histone proteins. Curr Opin Genet Dev. 2008;18:152–158. doi: 10.1016/j.gde.2008.01.012. [DOI] [PubMed] [Google Scholar]
- 23.Das M, Das S, Lekli I, Das DK. Caveolin induces cardioprotection through epigenetic regulation. J Cell Mol Med. 2012;16:888–895. doi: 10.1111/j.1582-4934.2011.01372.x. [DOI] [PMC free article] [PubMed] [Google Scholar]
- 24.Maeda K, Doi S, Nakashima A, Nagai T, Irifuku T, Ueno T, Masaki T. Inhibition of H3K9 methyltransferase G9a ameliorates methylglyoxal-induced peritoneal fibrosis. PLoS One. 2017;12:e0173706. doi: 10.1371/journal.pone.0173706. [DOI] [PMC free article] [PubMed] [Google Scholar]
- 25.Irifuku T, Doi S, Sasaki K, Doi T, Nakashima A, Ueno T, Yamada K, Arihiro K, Kohno N, Masaki T. Inhibition of H3K9 histone methyltransferase G9a attenuates renal fibrosis and retains klotho expression. Kidney Int. 2016;89:147–157. doi: 10.1038/ki.2015.291. [DOI] [PubMed] [Google Scholar]
- 26.Artal-Martinez de Narvajas A, Gomez TS, Zhang JS, Mann AO, Taoda Y, Gorman JA, Herreros-Villanueva M, Gress TM, Ellenrieder V, Bujanda L, Kim DH, Kozikowski AP, Koenig A, Billadeau DD. Epigenetic regulation of autophagy by the methyltransferase G9a. Mol Cell Biol. 2013;33:3983–3993. doi: 10.1128/MCB.00813-13. [DOI] [PMC free article] [PubMed] [Google Scholar]
- 27.Li F, Zeng J, Gao Y, Guan Z, Ma Z, Shi Q, Du C, Jia J, Xu S, Wang X, Chang L, He D, Guo P. G9a inhibition induces autophagic cell death via AMPK/mTOR pathway in bladder transitional cell carcinoma. PLoS One. 2015;10:e0138390. doi: 10.1371/journal.pone.0138390. [DOI] [PMC free article] [PubMed] [Google Scholar]
- 28.Yang J, Kaur K, Edwards JG, Eisenberg CA, Eisenberg LM. Inhibition of histone methyltransferase, histone deacetylase, and beta-catenin synergistically enhance the cardiac potential of bone marrow cells. Stem Cells Int. 2017;2017:3464953. doi: 10.1155/2017/3464953. [DOI] [PMC free article] [PubMed] [Google Scholar]
- 29.Han P, Li W, Yang J, Shang C, Lin CH, Cheng W, Hang CT, Cheng HL, Chen CH, Wong J, Xiong Y, Zhao M, Drakos SG, Ghetti A, Li DY, Bernstein D, Chen HS, Quertermous T, Chang CP. Epigenetic response to environmental stress: assembly of BRG1-G9a/GLP-DNMT3 repressive chromatin complex on Myh6 promoter in pathologically stressed hearts. Biochim Biophys Acta. 2016;1863:1772–1781. doi: 10.1016/j.bbamcr.2016.03.002. [DOI] [PMC free article] [PubMed] [Google Scholar]
- 30.Schweizer S, Harms C, Lerch H, Flynn J, Hecht J, Yildirim F, Meisel A, Marschenz S. Inhibition of histone methyltransferases SUV39H1 and G9a leads to neuroprotection in an in vitro model of cerebral ischemia. J Cereb Blood Flow Metab. 2015;35:1640–1647. doi: 10.1038/jcbfm.2015.99. [DOI] [PMC free article] [PubMed] [Google Scholar]
- 31.Chen G, Wang X, Zhang Y, Ru X, Zhou L, Tian Y. H3K9 histone methyltransferase G9a ameliorates dilated cardiomyopathy via the downregulation of cell adhesion molecules. Mol Med Rep. 2015;11:3872–3879. doi: 10.3892/mmr.2015.3218. [DOI] [PubMed] [Google Scholar]
- 32.Gidlof O, Johnstone AL, Bader K, Khomtchouk BB, O’Reilly JJ, Celik S, Van Booven DJ, Wahlestedt C, Metzler B, Erlinge D. Ischemic preconditioning confers epigenetic repression of mtor and induction of autophagy through G9a-dependent H3K9 dimethylation. J Am Heart Assoc. 2016;5:e004076. doi: 10.1161/JAHA.116.004076. [DOI] [PMC free article] [PubMed] [Google Scholar]
- 33.Papait R, Serio S, Pagiatakis C, Rusconi F, Carullo P, Mazzola M, Salvarani N, Miragoli M, Condorelli G. Histone methyltransferase G9a is required for cardiomyocyte homeostasis and hypertrophy. Circulation. 2017;136:1233–1246. doi: 10.1161/CIRCULATIONAHA.117.028561. [DOI] [PubMed] [Google Scholar]
- 34.Calvillo L, Latini R, Kajstura J, Leri A, Anversa P, Ghezzi P, Salio M, Cerami A, Brines M. Recombinant human erythropoietin protects the myocardium from ischemia-reperfusion injury and promotes beneficial remodeling. Proc Natl Acad Sci U S A. 2003;100:4802–4806. doi: 10.1073/pnas.0630444100. [DOI] [PMC free article] [PubMed] [Google Scholar]
- 35.Hirata A, Minamino T, Asanuma H, Fujita M, Wakeno M, Myoishi M, Tsukamoto O, Okada K, Koyama H, Komamura K, Takashima S, Shinozaki Y, Mori H, Shiraga M, Kitakaze M, Hori M. Erythropoietin enhances neovascularization of ischemic myocardium and improves left ventricular dysfunction after myocardial infarction in dogs. J Am Coll Cardiol. 2006;48:176–184. doi: 10.1016/j.jacc.2006.04.008. [DOI] [PubMed] [Google Scholar]
- 36.Moon C, Krawczyk M, Ahn D, Ahmet I, Paik D, Lakatta EG, Talan MI. Erythropoietin reduces myocardial infarction and left ventricular functional decline after coronary artery ligation in rats. Proc Natl Acad Sci U S A. 2003;100:11612–11617. doi: 10.1073/pnas.1930406100. [DOI] [PMC free article] [PubMed] [Google Scholar]
- 37.Tramontano AF, Muniyappa R, Black AD, Blendea MC, Cohen I, Deng L, Sowers JR, Cutaia MV, El-Sherif N. Erythropoietin protects cardiac myocytes from hypoxia-induced apoptosis through an Akt-dependent pathway. Biochem Biophys Res Commun. 2003;308:990–994. doi: 10.1016/s0006-291x(03)01503-1. [DOI] [PubMed] [Google Scholar]
- 38.Brines ML, Ghezzi P, Keenan S, Agnello D, de Lanerolle NC, Cerami C, Itri LM, Cerami A. Erythropoietin crosses the blood-brain barrier to protect against experimental brain injury. Proc Natl Acad Sci U S A. 2000;97:10526–10531. doi: 10.1073/pnas.97.19.10526. [DOI] [PMC free article] [PubMed] [Google Scholar]
- 39.Lin JS, Chen YS, Chiang HS, Ma MC. Hypoxic preconditioning protects rat hearts against ischaemia-reperfusion injury: role of erythropoietin on progenitor cell mobilization. J Physiol. 2008;586:5757–5769. doi: 10.1113/jphysiol.2008.160887. [DOI] [PMC free article] [PubMed] [Google Scholar]
- 40.Lipsic E, van der Meer P, Henning RH, Suurmeijer AJ, Boddeus KM, van Veldhuisen DJ, van Gilst WH, Schoemaker RG. Timing of erythropoietin treatment for cardioprotection in ischemia/reperfusion. J Cardiovasc Pharmacol. 2004;44:473–479. doi: 10.1097/01.fjc.0000140209.04675.c3. [DOI] [PubMed] [Google Scholar]
- 41.van der Meer P, Voors AA, Lipsic E, van Gilst WH, van Veldhuisen DJ. Erythropoietin in cardiovascular diseases. Eur Heart J. 2004;25:285–291. doi: 10.1016/j.ehj.2003.11.017. [DOI] [PubMed] [Google Scholar]
- 42.Villa P, Bigini P, Mennini T, Agnello D, Laragione T, Cagnotto A, Viviani B, Marinovich M, Cerami A, Coleman TR, Brines M, Ghezzi P. Erythropoietin selectively attenuates cytokine production and inflammation in cerebral ischemia by targeting neuronal apoptosis. J Exp Med. 2003;198:971–975. doi: 10.1084/jem.20021067. [DOI] [PMC free article] [PubMed] [Google Scholar]
- 43.Digicaylioglu M, Lipton SA. Erythropoietin-mediated neuroprotection involves cross-talk between Jak2 and NF-kappaB signalling cascades. Nature. 2001;412:641–647. doi: 10.1038/35088074. [DOI] [PubMed] [Google Scholar]
- 44.Kawakami M, Sekiguchi M, Sato K, Kozaki S, Takahashi M. Erythropoietin receptor-mediated inhibition of exocytotic glutamate release confers neuroprotection during chemical ischemia. J Biol Chem. 2001;276:39469–39475. doi: 10.1074/jbc.M105832200. [DOI] [PubMed] [Google Scholar]
- 45.Yuen CM, Sun CK, Lin YC, Chang LT, Kao YH, Yen CH, Chen YL, Tsai TH, Chua S, Shao PL, Leu S, Yip HK. Combination of cyclosporine and erythropoietin improves brain infarct size and neurological function in rats after ischemic stroke. J Transl Med. 2011;9:141. doi: 10.1186/1479-5876-9-141. [DOI] [PMC free article] [PubMed] [Google Scholar]
- 46.Kaur K, Yang J, Edwards JG, Eisenberg CA, Eisenberg LM. G9a histone methyltransferase inhibitor BIX01294 promotes expansion of adult cardiac progenitor cells without changing their phenotype or differentiation potential. Cell Prolif. 2016;49:373–385. doi: 10.1111/cpr.12255. [DOI] [PMC free article] [PubMed] [Google Scholar]
- 47.Sun CK, Zhen YY, Leu S, Tsai TH, Chang LT, Sheu JJ, Chen YL, Chua S, Chai HT, Lu HI, Chang HW, Lee FY, Yip HK. Direct implantation versus platelet-rich fibrin-embedded adipose-derived mesenchymal stem cells in treating rat acute myocardial infarction. Int J Cardiol. 2014;173:410–423. doi: 10.1016/j.ijcard.2014.03.015. [DOI] [PubMed] [Google Scholar]
- 48.Yip HK, Chang LT, Wu CJ, Sheu JJ, Youssef AA, Pei SN, Lee FY, Sun CK. Autologous bone marrow-derived mononuclear cell therapy prevents the damage of viable myocardium and improves rat heart function following acute anterior myocardial infarction. Circ J. 2008;72:1336–1345. doi: 10.1253/circj.72.1336. [DOI] [PubMed] [Google Scholar]
- 49.Chua S, Lee FY, Tsai TH, Sheu JJ, Leu S, Sun CK, Chen YL, Chang HW, Chai HT, Liu CF, Lu HI, Yip HK. Inhibition of dipeptidyl peptidase-IV enzyme activity protects against myocardial ischemia-reperfusion injury in rats. J Transl Med. 2014;12:357. doi: 10.1186/s12967-014-0357-0. [DOI] [PMC free article] [PubMed] [Google Scholar]
- 50.Yang CH, Sheu JJ, Tsai TH, Chua S, Chang LT, Chang HW, Lee FY, Chen YL, Chung SY, Sun CK, Leu S, Yen CH, Yip HK. Effect of tacrolimus on myocardial infarction is associated with inflammation, ROS, MAP kinase and Akt pathways in mini-pigs. J Atheroscler Thromb. 2013;20:9–22. doi: 10.5551/jat.14316. [DOI] [PubMed] [Google Scholar]
- 51.Lee FY, Chen YL, Sung PH, Ma MC, Pei SN, Wu CJ, Yang CH, Fu M, Ko SF, Leu S, Yip HK. Intracoronary transfusion of circulation-derived CD34+ cells improves left ventricular function in patients with end-stage diffuse coronary artery disease unsuitable for coronary intervention. Crit Care Med. 2015;43:2117–2132. doi: 10.1097/CCM.0000000000001138. [DOI] [PubMed] [Google Scholar]
- 52.Yip HK, Tsai TH, Lin HS, Chen SF, Sun CK, Leu S, Yuen CM, Tan TY, Lan MY, Liou CW, Lu CH, Chang WN. Effect of erythropoietin on level of circulating endothelial progenitor cells and outcome in patients after acute ischemic stroke. Crit Care. 2011;15:R40. doi: 10.1186/cc10002. [DOI] [PMC free article] [PubMed] [Google Scholar]
- 53.Yang J, Kaur K, Ong LL, Eisenberg CA, Eisenberg LM. Inhibition of G9a histone methyltransferase converts bone marrow mesenchymal stem cells to cardiac competent progenitors. Stem Cells Int. 2015;2015:270428. doi: 10.1155/2015/270428. [DOI] [PMC free article] [PubMed] [Google Scholar]


