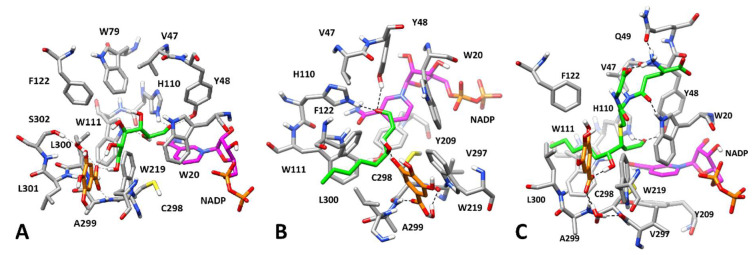
Figure 7.
Minimized average structures of AKR1B1 in complexes with GA and different substrates. In each Panel, GA is shown in orange, the portion of the cofactor adjacent to the ligand binding site is shown in magenta, and the substrate is shown in green. Relevant protein residues (shown in grey) are indicated. For all components, oxygen atoms are in red, sulfur atoms in yellow, nitrogen atoms in blue, while phosphorous atoms of the cofactor are shown in orange. Panel (A): AKR1B1 in complex with GA and L-idose; Panel (B): AKR1B1 in complex with GA and HNE; Panel (C): AKR1B1 in complex with GA and GSHNE.

