Abstract
In this paper, we describe an electrochemical sensing platform—ElectroSens—for the detection of Zn based on self-assembled polyelectrolyte multilayers on the carbon fiber (CF) electrode surface. The CF-extended surface facilitates the usage of a small volume electrochemical cell (1 mL) without stirring. This approach allows making a low-cost three-electrode platform. Working electrode modification with layer-by-layer assembly of polyethyleneimine (PEI), poly(sodium 4-styrenesulfonate) (PSS), and mercury nitrate layers eliminates solution toxicity and provides stable stripping voltammetry measurements. The stable, robust, sustainable, and even reusable Ag/AgCl reference electrode consists of adsorbed 32 PEI-KCl/PSS-KCl bilayers on the CF/silver paste separated from the outer solution by a polyvinyl chloride membrane. The polyelectrolyte-based sensor interface prevents adsorption of protein molecules from biological liquids on the CF surface that leads to a sensitivity increase of up to 2.2 μA/M for Zn2+ detection and provides a low limit of detection of 4.6 × 10⁻⁸ M. The linear range for Zn detection is 1 × 10⁻⁷ to 1 × 10⁻⁵ M. A portable potentiostat connected via wireless to a smartphone with an android-based software is also provided. The ElectroSens demonstrates reproducibility and repeatability of data for the detection of Zn in blood and urine without the digestion step.
Introduction
Deficiency of vitamins and minerals (trace elements) is a severe global health problem, partly because of logistical difficulties in assessing the state of trace elements in a population.1 Zinc is an essential trace element (micronutrient) which plays an essential role in human physiology. Inorganic cofactors in biological systems, more precisely Zn(II) metal ions, are the most widespread in mechanisms of diverse functions of proteins and their complexes.2 The pathological effects of zinc deficiency include the occurrence of skin lesions, growth retardation, impaired immune function, and impaired healing. In epidemiological situations, a quick assessment of the state of the human immune system is required. Determining the zinc content is more easy to carry out than an immune analysis because the cost of such a rapid test is lower. Such a rapid test will allow an assessment of the immune status in those cases when it is impossible to provide the population with the necessary test systems, for example, as in the case of COVID-19.3
Stripping voltammetry (SV) analysis is a powerful and straightforward tool for continuous monitoring of trace target metal species.4−6 The determination of zinc in biological samples is usually carried out by the method of anodic SV (ASV). As working electrodes (WEs), carbon,7 copper,8,9 bismuth,10 and glassy carbon modified with mercury salts are used. Despite the advantages of precipitating heavy metals in the mercury amalgam, this method is rarely used because of the toxicity of mercury.11 Electrodes are modified with mercury salts using polyelectrolytes (PEs) soluble in organic solvents, which not only lead to the high saturation of PEs with mercury ions but also lead to toxic waste, which does not comply with the principles of “green chemistry” and does not allow scaling such processes. Water-soluble PE assemblies12−14 also have the ability to be saturated with oppositely charged ions15 and are also able to hold them despite thermodynamic equilibrium. The use of water-soluble PEs as a method for immobilizing mercury salts on the surface of a WE will allow scaling the process of electrode modification.16 Pulsed electroanalytical methods, such as differential-pulse ASV11 and square-wave ASV (SWASV),5,17 are used for reducing the noise-to-signal ratio and increasing the resolution of the anodic peaks.
For zinc detection by the method of ASV in biological fluids, various methods of sample preparation and signal acquisition are used. Deproteinization of samples by sodium ethylenediaminetetraacetate (EDTA) was proposed by Zakharchuk et al.18 Such a method has the advantage of eliminating the matrix effect of biological molecules and breaking up zinc from complexes. The Metexchange solution (ESA Inc.), which is a mixture made up of chromium chloride (1.07 wt %), calcium acetate (1.43 wt %), and mercuric ions, was used for Zn detection by stripping it on the Bi electrode.19 Screen-printed modified electrodes without sample preparation for the Zn SV detection in sweat20 are demonstrated.
Carbon fiber (CF)21,22 is an outstanding class of carbon materials, with carbon atoms bonded together into crystals that are aligned parallel to the long axis of the fiber. Aligning the crystals gives the fiber a high strength to volume ratio. Fibrous materials are widely used in the field of electrochemistry and composite materials because of their carrier mobility, electrical conductivity, environmental stability, excellent mechanical properties, low weight, and high-temperature resistance, as well as the possibility of production at low cost. Conductive fiber fabrics provide an excellent class of substrates for the development of wearable sensors,23,24 as they will be in constant contact with the skin.25,26
We propose an electroanalytical platform—ElectroSens (Figure 1)—for zinc detection based on a CF electrode modified with water-soluble PEs [polyethyleneimine (PEI) and poly(sodium 4-styrenesulfonate) (PSS)] and mercury nitrate, as well as a cheap and stable Ag/AgCl reference electrode (RE) based on the CF and the adsorbed layers of PEs. Such a platform is prospective for a wide range of analyses (Figure S1); however, the biggest issues are robustness and sustainability as well as assay cost. Here, we solve all the issues.
Figure 1.
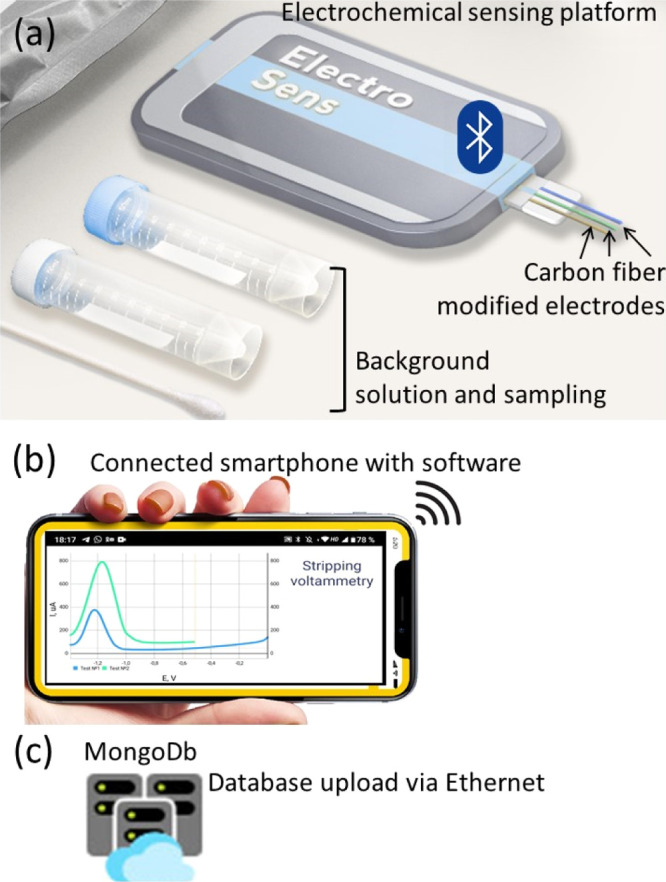
Electrochemical platform for the Zn detection in blood and urine consists of an electrochemical sensing platform (a three CF electrode-based system, sample pretreatment kit, and a potentiostat) (a), software for the smartphone (b), and data storage cloud system (c) (see also Supporting Information for self-written software and video example of its application during analysis).
Results and Discussion
The electroanalytical system for SWASV Zn detection comprises a three CF electrode-based system, sample pretreatment kit, a potentiostat (Figure 1a), software for the smartphone (Figure 1b), and a cloud database (Figure 1c). The potentiostat sends the data to the smartphone by Bluetooth for data processing, and then data are collected in the MongoDB cloud database.
The electrochemical sensing platform is a three-electrode system connected to a minipotentiostat (Figure 2a,b) and a kit for pretreatment. For the steady heavy metal deposition on the WE, mercury salts were used for the electrode modification.27 At the deposition stage, mercury ions reduce to the metallic mercury and other heavy metal deposits form a solution in the amalgam. Because of the toxicity of mercury, the bismuth and copper WEs are used in modern sensors for heavy metal detection. Nevertheless, mercury-modified electrodes have advantages over these two metals. For example, copper and bismuth have a smaller working voltage window than mercury. Electroconductive polymers were used for electrode modification by mercury salts. A disadvantage of such a method is using organic solvents for the modifier preparation. We propose to use the water-soluble PEs for the electrode modification with mercury salts.28 Modification with PE multilayers (Figure 2e) for the mercury immobilization (Figure 2c) is applied for the WE. The CF surface has the ability to adsorb PEI and PSS because of the specific chemical or Van der Waals interactions.29
Figure 2.
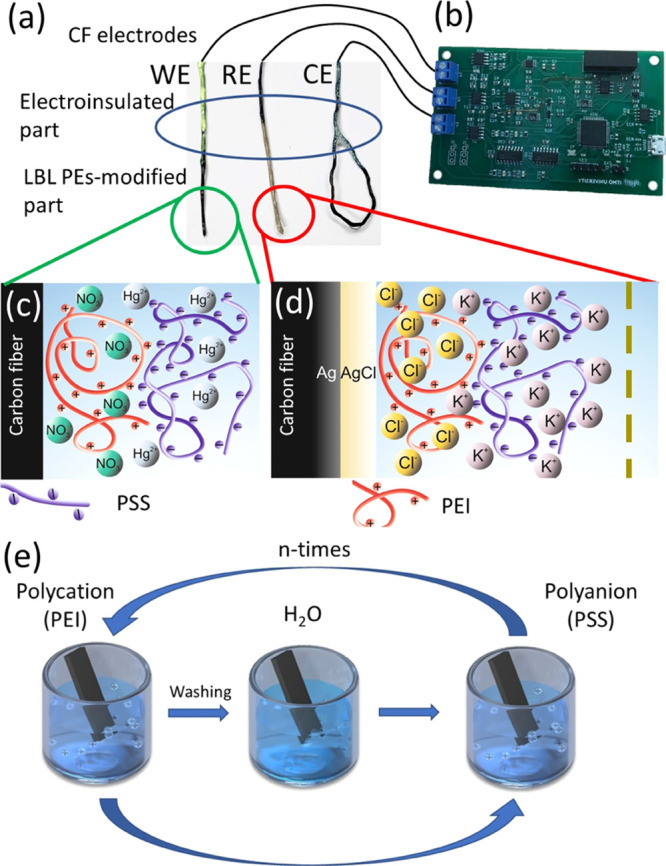
Electrochemical platform setup: an insulated CF WE, an RE, and a CE (a), connected to the minipotentiostat (b). Scheme of the WE (c) and RE (d) modification using LbL assembly of PEs.
Mercury is able to form amino complexes with organic molecules. PEI was used as a complexing agent. PEI exhibits a high degree of surface affinity. As a counterion, a strong PSS PE was used. This allows the formation of a well-studied PEI/PSS complex.30 The PEI/PSS complex facilitates the diffusion of heavy metal ions but at the same time prevents the protein surface from blocking the electrode surface, which causes the damping of the analytical signal.31,32 The layer-by-layer (LbL) assembly method for the deposition of PEs is widely used in the fabrication of biosensors because of its ability to selectively hold and pass various ions through multilayers.33 PE multilayers also have the potential to be used for the stable RE construction (Figure 2d). For reference electrode construction, PEI/PSS multilayers were placed between the CF/Ag paste/AgCl interface and the PVC membrane (Figure 2d). Potassium chloride addition into the PE layers leads to a pseudointernal solution.16 PEI,34 as a positively charged PE, prevents diffusion of potassium ions from the inner solution to outer media. This pseudointernal electrode solution coupled with the CF/Ag paste/AgCl interface forms an ion-to-electron transfer system. This approach enables us to produce a low-cost miniaturized RE.
For the simulation of 3 M KCl internal solution in the RE, we vary the concentrations of KCl in the PE containing deposition solutions (Figure 3a) and a number of (PEI/PSS) bilayers (Figure 3b). The number of PEI/PSS bilayers varies from 4 to 32. The concentration of KCl in the PE deposition solutions varies from 0.1 to 1 M (Figure 3a). The electrode modified with eight bilayers of PEI/PSS in 1 M KCl solution demonstrates stable electrode potential values. We use this RE modification: CF/Ag paste/AgCl/(PEI/PSS)8, 1 M KCl, for the electroanalytical measurements. Stability measurements during storage require 7 days of conditioning time and demonstrate stable electrode potential values (vs the commercial Ag/AgCl RE) for the proposed miniaturized RE. A 3 M KCl solution was used for storageand conditioning of the RE.
Figure 3.
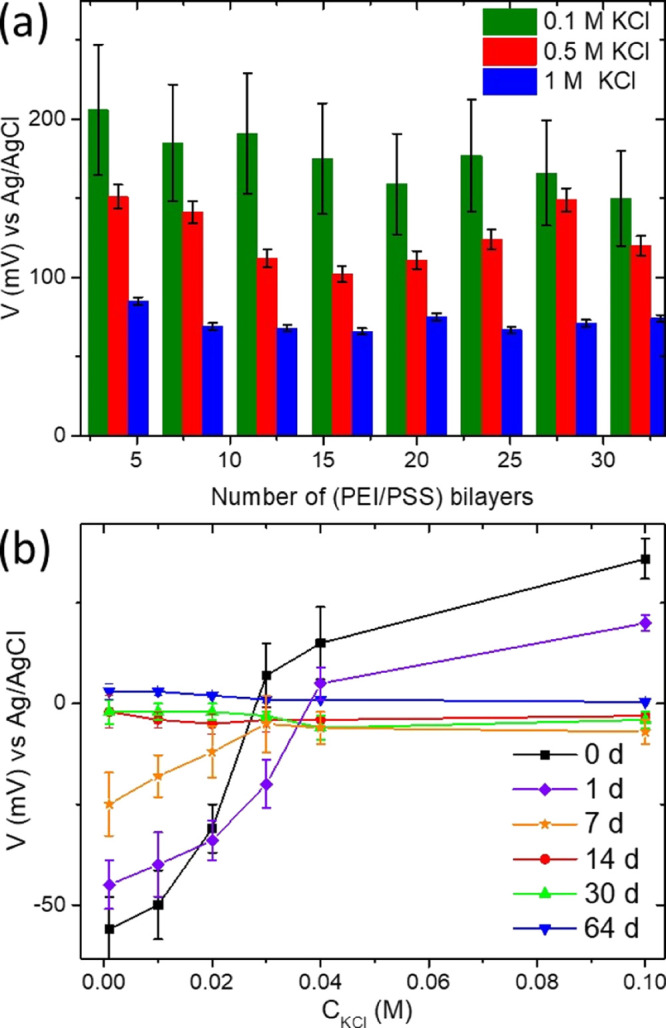
RE signal vs the commercial Ag/AgCl RE for the different PE layers deposited in 0.1, 0.5, and 1 M KCl (a). RE signal recorded vs the commercial Ag/AgCl electrode during storage in 3 M KCl (b).
Modification of the working CF electrode by PEs and mercury salt provides a thin layer of amalgam. Water-soluble PEs, which are used for the electrode modification, have the ability to form a complex with mercury ions. PEI was used for removing mercury from wastewaters by mercury(II) complexation with PEI amino groups.35 Interaction of PSS with Hg2+ is caused by a strong polyanion–cation complexation.36 We consider two options for LBL deposition of PEs with mercury salt. The first case is the mutual deposition of PEs and mercury nitrate: (PEI(Hg(NO3)2)/PSS(Hg(NO3)2))n. The second option is the separate deposition of each layer: (PEI/Hg2+/PSS/Hg2+)n.
We evaluate both of these cases by scanning electron microscopy (SEM) (Figure 4) and quartz-crystal microbalance (QCM) methods (Figure 5). Figure 4a,b shows the SEM images of the bare CF surface. A commercially produced CF has an average diameter of CF equal to 5 μm. We can observe the changes at the modified CF surface that are formed by LBL deposition with one PEI/PSS bilayer (Figure 4c,d). The CF surface after LBL deposition is fully covered by PEs. The SWASV Zn detection has no influence on the CF-modified surface (Figure 4e,f).
Figure 4.
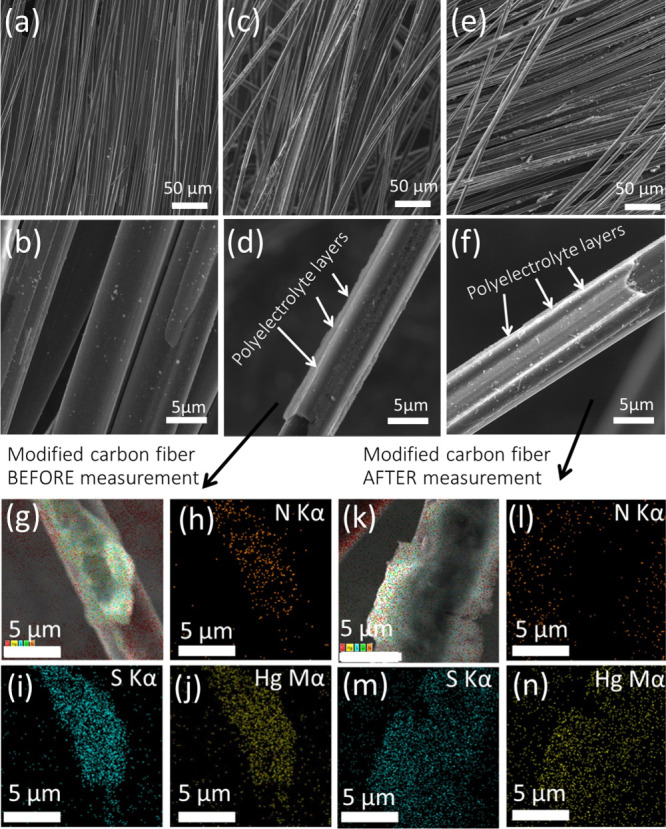
SEM images of the CF electrode (a,b), PEs–Hg2+-modified CF electrode (c,d), and modified CF after electrochemical measurements (e,f). Mapped EDX spectra of the PEs–Hg2+-modified CF electrode after modification (g) and separate mapped EDX spectra of nitrogen (h), sulfur (i), and mercury (j). EDX spectra obtained after electrochemical measurements of the modified CF electrode (k) and mixed EDX spectra of nitrogen (l), sulfur (m), and mercury (n).
Figure 5.
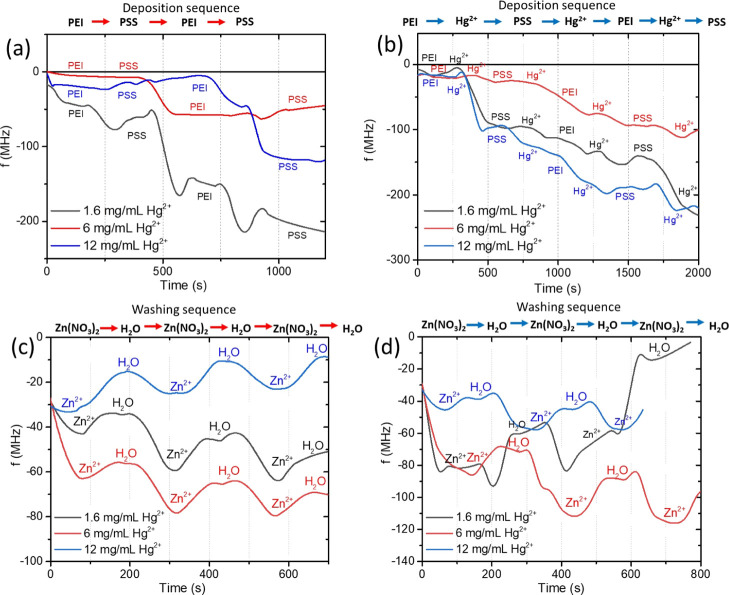
Results of QCM measurements for the adsorbed PE layers by two schemes: (PEI(Hg(NO3)2)/PSS(Hg(NO3)2))2 (a) and (PEI/Hg2+/PSS/Hg2+)2 (b). Mercury erosion from PE layers carried out using zinc nitrate and DI water for the (PEI(Hg(NO3)2)/PSS(Hg(NO3)2))2 (c) and (PEI/Hg2+/PSS/Hg2+)2 (d) layers.
This was confirmed using the mapped energy-dispersive X-ray (EDX) elemental spectra (Figure 4g,k). The presence of nitrogen before measurements (Figure 4h) demonstrates the adsorption of PEI on the CF surface as well as the presence of sulfur proves strong adsorption of PSS (Figure 4i). The mapped EDX spectrum of mercury shows uniform codeposition of the mercury nitrate together with PEs (Figure 4j).
The CF surface after LBL deposition isfully covered by PEs, which was confirmed using the mapped EDX elemental spectra (Figure 4g,k). The presence of nitrogen before measurements (Figure 4h) demonstrates the adsorption of PEI on the CF surface as well as the presence of sulfur proves strong adsorption of PSS (Figure 4i).
The mapped EDX spectrum of mercury shows uniform codeposition of mercury nitrate together with PEs (Figure 4j). Post-SWASV Zn detection using the mapped EDX spectrum demonstrates that signals from sulfur (Figure 4m) and mercury (Figure 4n) remain the same. In Figure 4l, we can observe a decrease in the nitrogen signal caused by its complexation with metallic mercury. Full coverage of the CF by PEs and the uniform mercury distribution prove the formation of a thick film on the CF surface. Such a modificationfacilitates the surface deposition for heavy metal SWASV determination. PE adsorption, together with mercury salt, was proved by QCM measurements. Except for the first and third harmonics, which had high noise levels, the higher harmonics overlapping with each other involve normalized changes in the frequency for the fifth harmonic versus time. The normalization was obtained by dividing the change in frequency by its harmonic number. Figure 5a shows the deposition of PEI and PSS, together with mercury nitrate. Serial deposition of PEs with different mercury nitrate concentrations is shown in Figure 5a.
The deposition of the two bilayers of PEs with 1.6 mg/mL of mercury(II) (Figure 5a) leads to a shift of about 200 MHz. Lower frequency changes are observed for the deposition of two bilayers with 6 to 12 mg/mL mercury(II) solution (Figure 5a). An unstable behavior of the adsorbed layers with 1.6 to 12 mg/mL Hg2+ explains PE complexation with others and breaks away from the surface. This PE complexation depends on the salt concentration in the adsorbed PE layers.37,38
In spite of a lower frequency shift (about 100 MHz), PE layer adsorption with 6 mg/mL Hg2+ exhibits a stable frequency signal and a plateau after second bilayer deposition, which is evidence of full surface coverage. The scheme of separate PE layers and mercury deposition controlled by QCM is shown in Figure 5b. Separate deposition leads to the frequency signal stabilization caused by the absence of interaction of mercury ions with PEs in the solution before deposition. Two bilayers ((PEI/Hg2+/PSS/Hg2+)2) reach the same frequency value as for the PE layers deposited together with mercury salt. We observe no significant changes in the scheme of deposition, excluding unnecessary additional LBL steps. Strong PE complexation with mercury is proved and shown in Figure 5c,d. For this purpose, we wash the twotypes of adsorbed layers subsequently with zinc nitrate and deionized (DI) water. The layers deposited with1.6 to 12 mg/mL demonstrate an unstable behavior and the removal of the adsorbed layers caused a change in the total ionic strength of the adsorbed PE layers.38,39 The stable behavior of the PE layers deposited with 6 mg/mL Hg2+ explains the charge compensation between the surface, PEs, and mercury(II).40 For the SWASV Zn detection, deposition of the two PE bilayer with 6 mg/mL Hg2+ is appropriate.
Electrochemical behavior of different deposited PEs–Hg2+ bilayers on the GF electrode investigated by SWASV in the acetate buffer solution (pH 3.6) is shown in Figure S3. Conditions for SWASV pretreatment are 60 s of cleaning at −1.4 V and 60 s of deposition at −1.5 V. Anodic square-wave sweep is from −1.5 to 0.6 V with a 50 mV amplitude and a 50 Hz frequency. The frequency value and amplitude correspond to those reported in previous works.10,17 A reduction in capacitive currents caused by the oxidation of impurities in real blood and urine samples was observed under the proposed square-wave sweep conditions. We observe the mercury anodic dissolution peak at about 0.4 V for both types of PEs–Hg2+ bilayers. The Hg2+ peak current value for the CF/(PEI/Hg2+/PSS/Hg2+)2 is equal to 257 μA. For the CF/(PEI(Hg2+)/PSS(Hg2+))2, this peak magnitude is equal to 453 μA. Zn addition to the background solution till 1 × 10⁻⁵ M concentration leads to the appearance of a Zn anodic peak at −1.0 V. We observe slightly decreasing mercury peak current at 0.4 V in the case of CF/(PEI/Hg2+/PSS/Hg2+)2 deposition after Zn addition. Greater peak current of mercury for the CF/(PEI(Hg2+)/PSS(Hg2+))2 modification than for CF/(PEI(Hg2+)/PSS(Hg2+))2 LBL adsorption indicates the amount of immobilized mercury in the PE layers. For the SWASV Zn detection, the CF/(PEI(Hg2+)/PSS(Hg2+))2 is a convenient method because of the high amount of immobilized mercury and absence of mercury removal from the PE layers. The CF is a micrometer-sized electrode, and therefore, the semispherical diffusion mechanism is realized in the electrochemical cell. Because of this fact, we realize the electroanalysis of Zn without stirring.
The primary parameter for SWASV Zn analysis is the deposition time for the electrochemical pretreatment. We set all SWASV parameters described above, excluding potential sweep. Potential sweep is from −1.5 to 0.0 V for the regular mercury film surface on the CF electrode. Deposition time varies from 30 to 300 s (Figure 6a). The Zn concentration in the electrochemical cell is 1 × 10⁻⁵ M. The plateau of the Zn peak area (inset Figure 6a) appears at 240 s.
Figure 6.
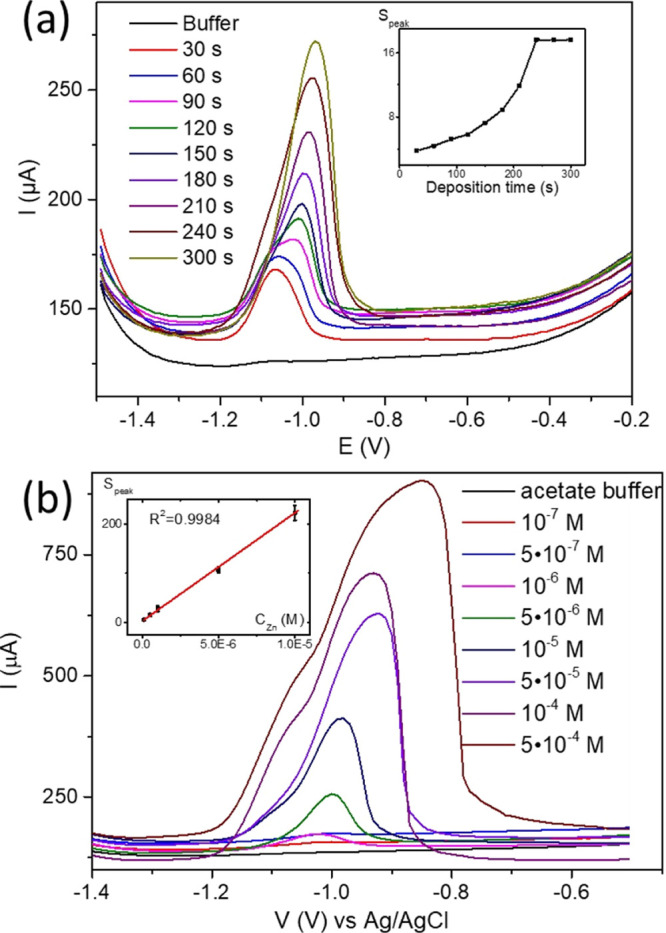
SWASV Zn deposition time dependence for the CF/(PEI(Hg2+)/PSS(Hg2+))2 electrode (a) and SWAS voltammograms (b) and calibration curve (inset b).
Nevertheless, we observe the plateau at 60 s (inset Figure 6a). For obtaining the calibration curve, we set the deposition time to be 60 s. In Figure 6b, SWAS voltammograms for the Zn concentration range from 1 × 10⁻⁷ to 5 × 10⁻⁴ M are presented. The calibration curve is shown in the inset of Figure 6b.
The linear range for the proposed sensor is equal to 1 × 10⁻⁷ to 1 × 10⁻⁵ M (R2 = 0.9986). Sensitivity is found to be 2.2 ± 0.3 μA/M. The limit of detection is 4.6 × 10⁻⁸ M. The detection limit is estimated by adding three times the standard deviation of the blank signal to its mean value. The concentration of zinc in the blood and urine samples depends on a large number of parameters: age, gender, diet, health status, and so forth. The zinc content in the urine sample can reach 10 μM41 and in the blood sample 1 μM.42 We used the modified pretreatment technique reported by Zakharchuk et al.18 for blood and urine samples. This method does not include sample digestion. Zn2+ extraction is achieved by the addition of 40 μL of 0.1 M EDTA to 100 μL of blood or urine and mixing for 1 h at room temperature (Figure 7). Then, 40 μL of 1 M NaCl and 20 μL 1 M HCl are added to the mixture. The obtained mixture is left for 30 min at room temperature. For the SWASV measurements, 800 μL of acetate buffer solution is added. The deposition time for the samples of blood and urine is increased up to 90 s. Figure 7 depicts the pretreatment process and SWAS voltammograms for the detection of Zn2+ in blood and urine samples. The standard addition of Zn2+ realizes the Zn2+ evaluation in blood and urine. The reference Zn assay in blood and urine is carried out by inductively coupled plasma–mass spectrometry (ICP MS) heavy metal analysis. Each sample was measured three times. Based on the data obtained, the standard deviation was estimated. The comparison results are shown in Table 1.
Figure 7.
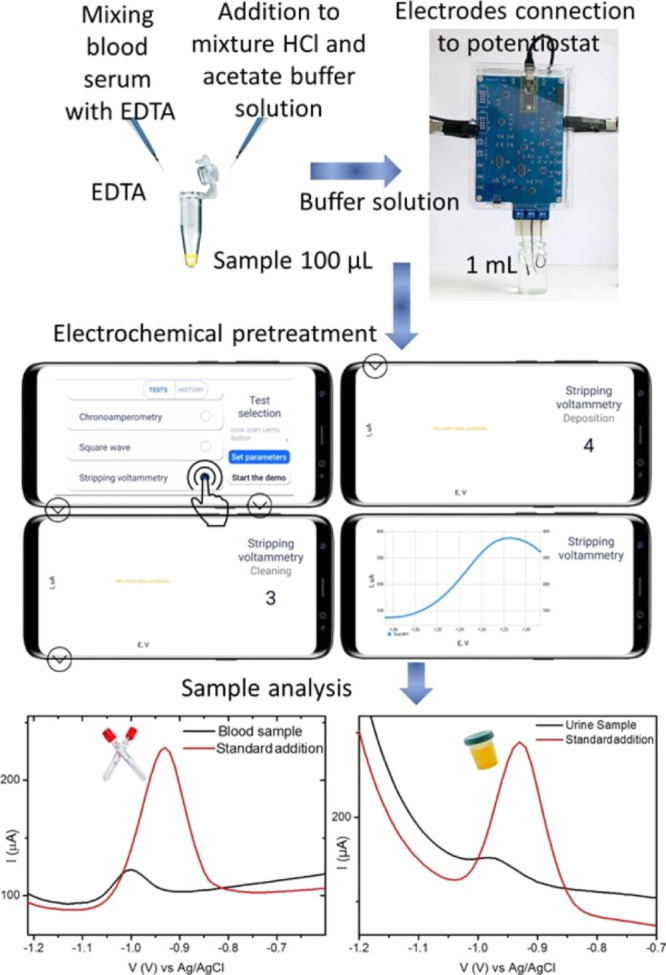
Scheme of electroanalysis of Zn2+ in blood and urine with the proposed sensing platform.
Table 1. Calculation Results for the Zn2+ Detection in the Real Samples.
| sample | ICP–MS (ppm) (n = 3, p = 0.95) | SWASV (ppm) (n = 3, p = 0.95) |
|---|---|---|
| urine | 0.6 ± 0.1 | 0.5 ± 0.2 |
| blood | 6.4 ± 2.1 | 5.9 ± 2.9 |
The standard deviations of the results obtained by the proposed method are in good agreement with the standard deviations of the results obtained by the ICP MS method. The estimated results presented in Table 1 demonstrate the possibility of accurate detection of Zn2+ in blood and urine without the digestion step. This together with the proposed minipotentiostat and software is advantageous for the point-of-care analysis.
Conclusions
To summarize, the goal of this study was to describe an easy-to-produce electrochemical platform that can be integrated into the point-of-care analysis. The three-electrode cell consisting of a modified WE with (PEI(Hg2+)/PSS(Hg2+))2 layers and a reference CF/Ag paste/AgCl/(PEI(KCl)/PSS(KCl))8 electrode allows to determine the zinc(II) concentration in blood and urine samples. We propose together with a minipotentiostat and a software program an electroanalytical system for continuous monitoring of a wide range of analytes. LbL assembly was efficiently used for the application. Finally, the bioassay could becarried out using undiluted human blood and urine with no digestion or a long-time pretreatment process.
Experimental Section
Chemicals and Materials
CFs with 450 g/m2 of area density were produced by M-Carbo (Minsk, Belarus). PEI (MW ∼ 750 000, 50% (w/v) solution), poly(sodium 4-styrenesulfonate) (PSS, MW ∼ 1 000 000), sodium chloride, and zinc nitrate hexahydrate were purchased from Sigma-Aldrich (USA). 2-Nitrophnyl octyl ether (o-NPOE) and high-molecular-weight poly(vinyl chloride) (PVC) were purchased from Sigma-Aldrich. Hydrochloric acid (HCl) and potassium chloride (KCl) were obtained from Fluka. Tetrahydrofuran solution (THF, 45% in H2O) was provided by Sigma-Aldrich. Silver conductive glue (Kontakt, Keller) and nail polish were purchased from local stores. HCl and KCl solutions were prepared using DI water. Acetic acid, hydrochloric acid, and sodium acetate were acquired from LenReactiv (Russia). Mercury nitrate monohydrate was purchased from Kubancvetmet (Russia). Sodium ethylenediaminetetraacetate (EDTA) was purchased from Helicon (Russia). All solutions were prepared using DI water (>18.0 MΩ cm, Milli-Q gradient system, Millipore, Burlington, MA).
Scanning Electron Microscopy
The morphology of the CF electrodes was studied using a scanning electron microscope (Tescan Vega-3, Czech Republic).
QCM Measurements
Gold sensors (5 MHz, Au-coated) were purchased from Shenzhen RenLux Crystal Co., Ltd. (China). Sensors were cleaned with Piranha solution before each measurement. QCM measurements were carried out on a Gamry Potentiostat (Gamry Instruments, USA) using flow modules. PE solutions were flowed into the modules at 10 rpm using a Heildolph 5101 peristaltic pump. For QCM experiments, PE solutions were prepared at a concentration of 2 mg/mL. LbL assembly was tracked for three different Hg(NO3)2 concentrations: 1.6, 6, and 12 mg/mL. PEs were alternately deposited on the gold sensor. Between the adsorption steps (5 min), the sensor was rinsed with deionized water (2 min). In other experiments, PEs were deposited with aqueous solutions (2 mg/mL). Between the adsorption steps, the sensor was rinsed with Hg(NO3)2 (2 min). Swelling experiments on Zn(NO3)2 were carried out using the following procedure: salt solution (0.1 M in H2O/acetate buffer 90:10) was flown for 1 min through the modules, after rinsing with deionized water.
Overall Potentiostat Scheme
The overall system was based on the ARM Cortex-M4 74 MHz CPU microcontroller with an analog part, which includes an ultralow bias current DiFET operational amplifier, a gain selectable amplifier, an analog switch, a precision operational amplifier, a programmable gain instrumentation amplifier, and an ultralow offset voltage operational amplifier (Figure S2). The sensor data are processed byusing the chip built into the potentiostat circuit, Bluetooth was chosen for wireless communication of the sensor with the user’s smartphone because bluetooth low energy (BLE) has low power consumption and is implemented in all modern devices as a standard communication mode. In this way, our device is compatible with all smartphones without any specialized hardware.
Potentiostat Software Design
The application (https://drive.google.com/file/d/1_zEojyo0MhxXjmrLe_ofLQTb9uyC60Py/view) is written in Java for Android mobile OS. Standard libraries—Bluetooth and BluetoothSocket for working with BLE–were used in development. Third-party libraries: Retrofit—for client–server interaction and Gson were used for data conversion. The SQLite database is used to store the test results on the device. Details are provided in Supporting Information.
CF-based electrode preparation, composition, and connection are highlighted in Figure 2.
Ag/AgCl RE Construction
CF was cut into 80 mm length pieces, which were covered with nail polish, leaving 15 mm uncovered at both ends. Then, the applied coat of nail polish was dried according to the instruction. Following this step, one of the ends was coated with silver conductive glue and left to dry in air for 30 min.
After that, the end, coated with silver, was immersed into 1 M HCl and rinsed with deionized water. Thus, AgCl-coated CF was obtained. The working area of the electrode in the following was modified using the LbL assembly. It was plunged sequentially for 30 s into the PEI solution at first and then into the PSS solution. The tight end was rinsed between dips with deionized water. Finally, 64 layers (32 layers of PEI and 32 layers of PSS) were assembled. The free end of the CF was attached to a paper clip. The precursor of the membrane was prepared by dissolving 0.5 g of the membrane components (335 mg of o-NPOE and 165 mg of PVC) in 1 mL of THF. The mixture was stirred for 20 min before using it. The prepared mixture can be stored at 4 ± 2 °C. The part of the fiber, coated with polymers, was dipped into the membrane mixture four times with 2 min breaks for drying. Then, the electrode was hung vertically for membrane setting for 40–90 min at room temperature.
WE Modification
CF was partially insulated with nail polish. One of the uninsulated parts was covered with PE-assembled multilayers and mercury salt. The LbL technique was used for the CF electrode modification. The LbL assembly of PEI and PSS layers was carried out using the aqueous solutions with a concentration of 2 mg/mL. Each PE was deposited for 5 min, and then the CF electrode was washed for 1 min with DI water. Concentration of the Hg2+ deposition solution was varied from 1.6 to 12 mg/mL. Between each layer deposition, the electrode was rinsed with DI water (Figure S3).
Electrochemical Assay
The SWASV technique was used for zinc detection. For this purpose, the three-electrode system consisting of a working CF-modified electrode, a reference CF-based Ag/AgCl electrode, and a CF counter electrode (CE) was used. An electrochemical cell volume of 1 mL was used. The acetate buffer (pH 3.6) was set as the background solution. All electroanalytical measurements were repeated at least three times for the statistical evaluation of the results.
Acknowledgments
The authors acknowledge RSF grant no. 19-73-00315 for financial support. ITMO Fellowship and Professorship program is acknowledged for infrastructural support.
Supporting Information Available
The Supporting Information is available free of charge at https://pubs.acs.org/doi/10.1021/acsomega.0c02279.
Author Contributions
The manuscript was written through contributions of all authors. All authors have given approval to the final version of the manuscript.
The authors declare no competing financial interest.
Supplementary Material
References
- Gernand A. D.; Schulze K. J.; Stewart C. P.; West K. P.; Christian P. Micronutrient deficiencies in pregnancy worldwide: health effects and prevention. Nat. Rev. Endocrinol. 2016, 12, 274–289. 10.1038/nrendo.2016.37. [DOI] [PMC free article] [PubMed] [Google Scholar]
- Gombart A. F.; Pierre A.; Maggini S. A review of micronutrients and the immune system–working in harmony to reduce the risk of infection. Nutrients 2020, 12, 236. 10.3390/nu12010236. [DOI] [PMC free article] [PubMed] [Google Scholar]
- Skalny A.; Rink L.; Ajsuvakova O. P.; Aschner M.; Gritsenko V. A.; Alekseenko S.; Svistunov A. A.; Petrakis D.; Spandidos D. A.; Aaseth J.; Tsatsakis A. Zinc and respiratory tract infections: Perspectives for COVID-19 (Review). Int. J. Mol. Med. 2020, 46, 17–26. 10.3892/ijmm.2020.4575. [DOI] [PMC free article] [PubMed] [Google Scholar]
- Ward Jones S. E.; Chevallier F. G.; Paddon C. A.; Compton R. G. General Theory of Cathodic and Anodic Stripping Voltammetry at Solid Electrodes: Mathematical Modeling and Numerical Simulations. Anal. Chem. 2007, 79, 4110–4119. 10.1021/ac070046b. [DOI] [PubMed] [Google Scholar]
- da Silva S. M.; Squissato A. L.; Rocha D. P.; Vasconcellos M. L. S.; de Q.; Ferreira R.; Richter E. M.; Munoz R. A. A. Improved anodic stripping voltammetric detection of zinc on a disposable screen-printed gold electrode. Ionics 2020, 26, 2611. 10.1007/s11581-019-03379-6. [DOI] [Google Scholar]
- Ermakov S. S.; Sheremet A. A.; Moskvin L. N. Determination of zinc in aqueous solutions by a combined no-standard electrochemical method with preliminary electrolytic separation of copper. Russ. J. Appl. Chem. 2008, 81, 420–422. 10.1134/s1070427208030142. [DOI] [Google Scholar]
- Wang J.; Lu J.; Hocevar S. B.; Farias P. A. M.; Ogorevc B. Bismuth-Coated Carbon Electrodes for Anodic Stripping Voltammetry. Anal. Chem. 2000, 72, 3218–3222. 10.1021/ac000108x. [DOI] [PubMed] [Google Scholar]
- Pei X.; Kang W.; Yue W.; Bange A.; Heineman W. R.; Papautsky I. Disposable Copper-Based Electrochemical Sensor for Anodic Stripping Voltammetry. Anal. Chem. 2014, 86, 4893–4900. 10.1021/ac500277j. [DOI] [PMC free article] [PubMed] [Google Scholar]
- Kang W.; Pei X.; Rusinek C. A.; Bange A.; Haynes E. N.; Heineman W. R.; Papautsky I. Determination of Lead with a Copper-Based Electrochemical Sensor. Anal. Chem. 2017, 89, 3345–3352. 10.1021/acs.analchem.6b03894. [DOI] [PMC free article] [PubMed] [Google Scholar]
- Gao W.; Nyein H. Y. Y.; Shahpar Z.; Fahad H. M.; Chen K.; Emaminejad S.; Gao Y.; Tai L.-C.; Ota H.; Wu E.; Bullock J.; Zeng Y.; Lien D.-H.; Javey A. Wearable Microsensor Array for Multiplexed Heavy Metal Monitoring of Body Fluids. ACS Sens. 2016, 1, 866–874. 10.1021/acssensors.6b00287. [DOI] [Google Scholar]
- Opoka W.; Jakubowska M.; Baś B.; Sowa-Kućma M. Development and Validation of an Anodic Stripping Voltammetric Method for Determination of Zn2+ Ions in Brain Microdialysate Samples. Biol. Trace Elem. Res. 2011, 142, 671–682. 10.1007/s12011-010-8790-2. [DOI] [PMC free article] [PubMed] [Google Scholar]
- Skorb E. V.; Anna V. V.; Daria V. A. Layer-by-Layer Approach for Design of Chemical Sensors and Biosensors. Curr. Org. Chem. 2015, 19, 1097–1116. 10.2174/1385272819666150318221914. [DOI] [Google Scholar]
- Ryzhkov N. V.; Mamchik N. A.; Skorb E. V. Electrochemical triggering of lipid bilayer lift-off oscillation at the electrode interface. J. R. Soc., Interface 2019, 16, 20180626. 10.1098/rsif.2018.0626. [DOI] [PMC free article] [PubMed] [Google Scholar]
- Andreeva D. V.; Kollath A.; Brezhneva N.; Sviridov D. V.; Cafferty B. J.; Möhwald H.; Skorb E. V. Using a chitosan nanolayer as an efficient pH buffer to protect pH-sensitive supramolecular assemblies. Phys. Chem. Chem. Phys. 2017, 19, 23843–23848. 10.1039/c7cp02618h. [DOI] [PubMed] [Google Scholar]
- Brezhneva N.; Nikitina A.; Ryzhkov N.; Klestova A.; Vinogradov A. V.; Skorb E. V. Importance of buffering nanolayer position in Layer-by-Layer assembly on titania based hybrid photoactivity. J. Sol-Gel Sci. Technol. 2019, 89, 92–100. 10.1007/s10971-018-4728-5. [DOI] [Google Scholar]
- Stekolshchikova A. A.; Radaev A. V.; Orlova O. Y.; Nikolaev K. G.; Skorb E. V. Thin and Flexible Ion Sensors Based on Polyelectrolyte Multilayers Assembled onto the Carbon Adhesive Tape. ACS Omega 2019, 4, 15421–15427. 10.1021/acsomega.9b01464. [DOI] [PMC free article] [PubMed] [Google Scholar]
- Anastasiadou Z.; Panagiotis J.; Stella G. Square wave anodic stripping voltammetry determination of eco-toxic metals in samples of biological and environmental importance. Open Chem. 2010, 8, 999–1008. 10.2478/s11532-010-0091-2. [DOI] [Google Scholar]
- Zakharchuk N. F.; Saraeva S. Y.; Kolyadina L. I.; Sudaeva O. I.; Brainina K. Z. Direct Measurements of Cadmium, Lead and Copper in Whole Blood Using the Stripping Voltammetric Method with Modified Thick-Film Graphite Electrodes. Chem. Sustainable Dev. 2003, 11, 775–786. [Google Scholar]
- Jothimuthu P.; Wilson R. A.; Sukavasi S.; Herren J.; Wong H.; Beyette F. R.; Heineman W. R.; Papautsky I.. In Lab-on-a-chip sensor for measuring zinc in blood serum. SENSORS, 2010 IEEE, Nov 1–4, 2010; IEEE, 2010; pp 1222–1225.
- Crew A.; Cowell D.; Hart J. Development of an anodic stripping voltammetric assay, using a disposable mercury-free screen-printed carbon electrode, for the determination of zinc in human sweat. Talanta 2008, 75, 1221–1226. 10.1016/j.talanta.2008.01.043. [DOI] [PubMed] [Google Scholar]
- Lim G. N.; Ross A. E. Purine Functional Group Type and Placement Modulate the Interaction with Carbon-Fiber Microelectrodes. ACS Sens. 2019, 4, 479–487. 10.1021/acssensors.8b01504. [DOI] [PubMed] [Google Scholar]
- Farajikhah S.; Innis P. C.; Paull B.; Wallace G. G.; Harris A. R. Facile Development of a Fiber-Based Electrode for Highly Selective and Sensitive Detection of Dopamine. ACS Sens. 2019, 4, 2599–2604. 10.1021/acssensors.9b01583. [DOI] [PubMed] [Google Scholar]
- Sweilam M. N.; Varcoe J. R.; Crean C. Fabrication and Optimization of Fiber-Based Lithium Sensor: A Step toward Wearable Sensors for Lithium Drug Monitoring in Interstitial Fluid. ACS Sens. 2018, 3, 1802–1810. 10.1021/acssensors.8b00528. [DOI] [PubMed] [Google Scholar]
- Li W.; Chen R.; Qi W.; Cai L.; Sun Y.; Sun M.; Li C.; Yang X.; Xiang L.; Xie D.; Ren T. Reduced Graphene Oxide/Mesoporous ZnO NSs Hybrid Fibers for Flexible, Stretchable, Twisted, and Wearable NO2 E-Textile Gas Sensor. ACS Sens. 2019, 4, 2809–2818. 10.1021/acssensors.9b01509. [DOI] [PubMed] [Google Scholar]
- Yang C.; Trikantzopoulos E.; Nguyen M. D.; Jacobs C. B.; Wang Y.; Mahjouri-Samani M.; Ivanov I. N.; Venton B. J. Laser Treated Carbon Nanotube Yarn Microelectrodes for Rapid and Sensitive Detection of Dopamine in Vivo. ACS Sens. 2016, 1, 508–515. 10.1021/acssensors.6b00021. [DOI] [PMC free article] [PubMed] [Google Scholar]
- Zhu W.; Zhang Y.; Gong J.; Ma Y.; Sun J.; Li T.; Wang J. Surface Engineering of Carbon Fiber Paper toward Exceptionally High-Performance and Stable Electrochemical Nitrite Sensing. ACS Sens. 2019, 4, 2980–2987. 10.1021/acssensors.9b01474. [DOI] [PubMed] [Google Scholar]
- Brainina K.; Henze G.; Stojko N.; Malakhova N.; Faller C. Thick-film graphite electrodes in stripping voltammetry. Fresenius. J. Anal. Chem. 1999, 364, 285–295. 10.1007/s002160051339. [DOI] [Google Scholar]
- Roeser J.; Heinrich B.; Bourgogne C.; Rawiso M.; Michel S.; Hubscher-Bruder V.; Arnaud-Neu F.; Méry S. Dendronized Polymers with Silver and Mercury Cations Recognition: Complexation Studies and Polyelectrolyte Behavior. Macromolecules 2013, 46, 7075–7085. 10.1021/ma400348v. [DOI] [Google Scholar]
- Lee A. A.; Kostinski S. V.; Brenner M. P. Controlling Polyelectrolyte Adsorption onto Carbon Nanotubes by Tuning Ion-Image Interactions. J. Phys. Chem. B 2018, 122, 1545–1550. 10.1021/acs.jpcb.7b11398. [DOI] [PubMed] [Google Scholar]
- Sharma V.; Sundaramurthy A. Multilayer capsules made of weak polyelectrolytes: a review on the preparation, functionalization and applications in drug delivery. Beilstein J. Nanotechnol. 2020, 11, 508–532. 10.3762/bjnano.11.41. [DOI] [PMC free article] [PubMed] [Google Scholar]
- Mauser T.; Déjugnat C.; Möhwald H.; Sukhorukov G. B. Microcapsules Made of Weak Polyelectrolytes: Templating and Stimuli-Responsive Properties. Langmuir 2006, 22, 5888–5893. 10.1021/la060088f. [DOI] [PubMed] [Google Scholar]
- Delcea M.; Möhwald H.; Skirtach A. G. Stimuli-responsive LbL capsules and nanoshells for drug delivery. Adv. Drug Delivery Rev. 2011, 63, 730–747. 10.1016/j.addr.2011.03.010. [DOI] [PubMed] [Google Scholar]
- Van der Meeren L.; Li J.; Parakhonskiy B. V.; Krysko D. V.; Skirtach A. G. Classification of analytics, sensorics, and bioanalytics with polyelectrolyte multilayer capsules. Anal. Bioanal. Chem. 2020, 412, 5015. 10.1007/s00216-020-02428-8. [DOI] [PubMed] [Google Scholar]
- Nestler P.; Paßvogel M.; Ahrens H.; Soltwedel O.; Köhler R.; Helm C. A. Branched Poly(ethylenimine) as Barrier Layer for Polyelectrolyte Diffusion in Multilayer Films. Macromol 2015, 48, 8546–8556. 10.1021/acs.macromol.5b01065. [DOI] [Google Scholar]
- Uludag Y.; Özbelge H. Ö.; Yilmaz L. Removal of mercury from aqueous solutions via polymer-enhanced ultrafiltration. J. Membr. Sci. 1997, 129, 93–99. 10.1016/s0376-7388(96)00342-0. [DOI] [Google Scholar]
- Yasri N. G.; Sundramoorthy A. K.; Chang W.-J.; Gunasekaran S. Highly Selective Mercury Detection at Partially Oxidized Graphene/Poly(3,4-Ethylenedioxythiophene): Poly(Styrene-sulfonate) Nanocomposite Film-Modified Electrode. Front. Mater. 2014, 1, 33. 10.3389/fmats.2014.00033. [DOI] [Google Scholar]
- Bago Rodriguez A. M.; Binks B. P.; Sekine T. Emulsions Stabilized with Polyelectrolyte Complexes Prepared from a Mixture of a Weak and a Strong Polyelectrolyte. Langmuir 2019, 35, 6693–6707. 10.1021/acs.langmuir.9b00897. [DOI] [PubMed] [Google Scholar]
- Nikolaev K. G.; Ulasevich S. A.; Luneva O.; Orlova O. Y.; Vasileva D.; Vasilev S.; Novikov A. S.; Skorb E. V. Humidity-Driven Transparent Holographic Free-Standing Polyelectrolyte Films. ACS Appl. Polym. Mater. 2020, 2, 105–112. 10.1021/acsapm.9b01151. [DOI] [Google Scholar]
- Yang M.; Shi J.; Schlenoff J. B. Control of Dynamics in Polyelectrolyte Complexes by Temperature and Salt. Macromolecules 2019, 52, 1930–1941. 10.1021/acs.macromol.8b02577. [DOI] [Google Scholar]
- Wang Q.; Schlenoff J. B. The Polyelectrolyte Complex/Coacervate Continuum. Macromol 2014, 47, 3108–3116. 10.1021/ma500500q. [DOI] [Google Scholar]
- Tinkov A. A.; Skalnaya M. G.; Ajsuvakova O. P.; Serebryansky E. P.; Chao J. C. J.; Aschner M.; Skalny A. V. Selenium, Zinc, Chromium, and Vanadium Levels in Serum, Hair, and Urine Samples of Obese Adults Assessed by Inductively Coupled Plasma Mass Spectrometry. Biol. Trace Elem. Res. 2020, 10.1007/s12011-020-02177-w. [DOI] [PubMed] [Google Scholar]
- Crăciun E. C.; Bjørklund G.; Tinkov A. A.; Urbina M. A.; Skalny A. V.; Rad F.; Dronca E. Evaluation of whole blood zinc and copper levels in children with autism spectrum disorder. Metab. Brain Dis. 2016, 31, 887–890. 10.1007/s11011-016-9823-0. [DOI] [PubMed] [Google Scholar]
Associated Data
This section collects any data citations, data availability statements, or supplementary materials included in this article.


