

Abstract
Developmental changes in the biological processes involved in the disposition of drugs, such as membrane transporter expression and activity, may alter the drug exposure and clearance in pediatric patients. Physiologically based pharmacokinetic (PBPK) models take these age-dependent changes into account and may be used to predict drug exposure in children. As a result, this mechanistic-based tool has increasingly been applied to improve pediatric drug development. Under the Prescription Drug User Fee Act VI, the US Food and Drug Administration has committed to facilitate the advancement of PBPK modeling in the drug application review process. Yet, significant knowledge gaps on developmental biology still exist, which must be addressed to increase the confidence of prediction. Recently, more data on ontogeny of transporters have emerged and supplied a missing piece of the puzzle. This article highlights the recent findings on the ontogeny of transporters specifically in the intestine, liver, and kidney. It also provides a case study that illustrates the utility of incorporating this information in predicting drug exposure in children using a PBPK approach. Collaborative work has greatly improved the understanding of the interplay between developmental physiology and drug disposition. Such efforts will continue to be needed to address the remaining knowledge gaps to enhance the application of PBPK modeling in drug development for children.
Keywords: children, model-informed drug development, ontogeny, PBPK, pediatric, physiologically based pharmacokinetic modeling, transporters
The off-label use of drugs in doses that are insufficiently studied is extensive in pediatric medicine.1 This is mainly because drug development for treatment in pediatric patients is challenged by ethical concerns and logistical issues.2 Because children widely differ from adults due to developmental changes in the biological processes involved in the disposition of drugs, this leaves them at risk for subtherapeutic or toxic exposures.3 The establishment of the Best Pharmaceuticals for Children Act in 2002 and the Pediatric Research Equity Act in 2003, which were made permanent under the Food and Drug Administration Safety and Innovation Act in 2012, and the European Paediatric Regulation (regulation no. 1901–2/2006) in 2006 have highlighted the commitment of the US Food and Drug Administration (FDA) and the European parliament and council to conduct studies in pediatric patients and thereby fill the pediatric gaps in drug development to increase the safety and efficacy of pediatric drug therapy.4–6
With the advancement of in silico technologies, novel methodologies such as model-informed drug development (MIDD) can leverage our existing understanding of pediatric physiology, disease states, and pharmacology. This provides quantitative information to streamline decision making in drug development, such as clinical trial design and dose optimization, which can increase the success of pediatric clinical trials.7 To support this, the FDA has committed to advance MIDD under the Prescription Drug User Fee Act VI, with approaches that include convening a series of workshops to identify best practices for MIDD, conducting a pilot meeting program for MIDD approaches, publishing or revising an existing draft guidance on MIDD, and engaging in regulatory science research to develop expertise and capacity in MIDD approaches.7,8
Physiologically based pharmacokinetic (PBPK) modeling is 1 of the mechanistic-based MIDD tools that has been increasingly incorporated into drug development programs to support submissions to the FDA and the European Medicines Agency.9,10 Of all the PBPK analyses that were included in the New Drug Application submissions to the FDA between 2008 and 2017, 60% were utilized to assess enzyme-mediated drug-drug interactions (DDIs). This was followed by 15% of the submissions that supported the evaluation of pediatric-related issues such as initial dose recommendation for clinical trials and 7% that analyzed transporter-mediated DDIs.9 During the FDA Advisory Committee for Pharmaceutical Science and Clinical Pharmacology Meeting in March 2012, some experts expressed concerns regarding the routine use of PBPK modeling in pediatric drug development because pediatric PBPK models still had significant knowledge gaps in areas such as the ontogeny of membrane transporters and thereby may not predict drug exposure well.11
New data on the ontogeny of membrane transporters have emerged since 2012, and the objective of this article is to review findings from recent studies that have evaluated pediatric developmental changes in the membrane transporters.
Ontogeny of Membrane Transporters
Membrane transporters facilitate the active movement of drug molecules and endogenous compounds into and out of cells of various organs, affecting drug absorption, distribution, and excretion.12 Hence, they have a critical role in impacting pharmacokinetics (PK) and pharmacodynamics of drugs and should be considered and assessed carefully during drug development. In the FDA 2017 draft on in vitro DDI guidance, the FDA recommended the evaluation of DDI potential by studying whether a new drug is a potential substrate or inhibitor of the following 9 transporters (see Table 1 for full, protein, and gene names): P-glycoprotein (P-gp), breast cancer resistance protein (BCRP), multidrug and toxin extrusion 1 (MATE1), MATE2-K, organic-anion-transporting polypeptide (OATP)1B1, OATP1B3, organic anion transporter (OAT)1, OAT3, and organic cation transporter (OCT)2.13
Table 1.
Full Names, Protein Names, and Gene Names of Membrane Transporters Discussed in This Article
| Full Name | Protein Name | Gene Name |
|---|---|---|
| P-glycoprotein | P-gP | ABCB1 |
| Breast cancer resistance protein | BCRP | A8CG2 |
| Multidrug and toxin extrusion 1 | MATE 1 | SLC47A1 |
| Multidrug and toxin extrusion 2-K | MATE2-K | SLC47A2 |
| Organic anion transporting polypeptide 1A2 | OATP1A2 | SLCO1A2 |
| Organic anion transporting polypeptide 1B1 | OATP1B1 | SLCO1B1 |
| Organic anion transporting polypeptide 1B3 | OATP1B3 | SLCO1B3 |
| Organic anion transporting polypeptide 2B1 | OATP2B1 | SLCO2B1 |
| Organic anion transporter 1 | OAT1 | SLC22A6 |
| Organic anion transporter 3 | OAT3 | SLC22A8 |
| Organic cation transporter 1 | OCT1 | SLC22A1 |
| Organic cation transporter 2 | OCT2 | SLC22A2 |
| Multidrug resistance-associated protein 1 | MPR1 | ABCC1 |
| Multidrug resistance-associated protein 2 | MRP2 | ABCC2 |
| Multidrug resistance-associated protein 3 | MRP3 | ABCC3 |
| Multidrug resistance-associated protein 4 | MRP4 | ABCC4 |
| Multidrug resistance-associated protein 6 | MRP6 | ABCC6 |
| Peptide transporter 1 | PEPT1 | SLCI5A1 |
| Sodium/taurocholate cotransporting polypeptide | NTCP | SLCIOA1 |
| Bile salt export pump | BSEP | ABCB11 |
| Glucose transporter 1 | GLUTI | SLC2A1 |
| Glucose transporter 2 | GLUT2 | SLC2A2 |
| Monocarboxylate transporter 1 | MCT1 | SLCI6A1 |
| Uric acid transporter 1 | URAT1 | SLC22A12 |
There is a wealth of information on how alterations in the transporter activity, mainly due to genetic polymorphisms and DDIs, can lead to variability in drug safety and efficacy in adults. However, less is known about age-related changes in transporter expression levels and activities and how that relates to the safety and efficacy of pediatric drug use. In 2015 the Pediatric Transporter Working Group performed a comprehensive review on the data available for the ontogeny of clinically relevant membrane transporters.14 Further, the working group also provided recommendations to address and overcome some of the challenges in filling the pediatric knowledge.14 These include building multidisciplinary and international collaborative networks to facilitate data sharing, increasing awareness of clinicians about the importance of transporters in pediatric drug disposition, and identifying biomarkers for transporter activity in children. In the discussion that follows and in Table 2, human data presented in that review are highlighted, and updated information from recent literature is provided. Figure 1 also depicts the human membrane transporters in the intestine, liver, and kidneys that are mentioned in this article.
Table 2.
Human Ontogeny Data of Membrane Transporters in Intestine, Liver, and Kidney Highlighted in This Article GA indicates gestational age; TM50, age at which half of the adult value is reached.
| Membrane Transporter, Protein Name (Gene Name) | Types of Ontogeny Data Available | Reported Ontogeny Pattern | Reference |
|---|---|---|---|
| Intestinal transportersa | |||
| P-gp (ABCB1) | Gene expression | Overall, the mRNA levels in neonates and infants were comparable to those in adults | Mizuno et al,20 Fakhouryetal,21,22 Miki et al,24 van Kalken et al,25 Mooij et al26 |
| BCRP (ABCG2) | Immunohistochemistry | BCRP distribution was similar in fetal (5.5–28 wk of gestation) and adult samples | Konieczna et al27 |
| MRPI (ABCC1) | Immunohistochemistry | MRPI distribution was similar in adults and fetal samples (9–28 wk of gestation) | Konieczna et al27 |
| MRP2 (ABCC2) | Gene expression | mRNA level was stable from neonates to adults | Mooij et al26 |
| OATP2B1 (SLCO2B1) | Gene expression | mRNA level was higher in neonates than in adults | Mooij et al26 |
| PEPT1 (SLCI5A1) | Gene expression | mRNA was slightly lower in neonates than in older counterparts | Mooij et al28 |
| Liver transporters | Immunohistochemistry | Tissue distribution was relatively stable from preterm neonates to adolescents | Mooij et al28 |
| OCT1 (SLC22A1) | Gene expression | Transcript levels in pediatric livers were comparable with those in adults | Hayashi et al36 |
| Western blot | Age-dependent increase in OCT1 protein expression from birth up to 8–12 y | Hahn et al37 | |
| Quantitative proteomics | Age-dependent increase in protein expression level; TM50 was approximately 6 mo | van Groen et al,33 Prasad et al34 | |
| OATP1B1 (SLCO1B1) | Gene expression | mRNA expression of OATP1B1 in fetal liver was 20-fold lower than that in adults. Neonates and infants have even lower levels than fetus (500-fold and 90-fold lower than adults, respectively) | Mooij et al26 |
| Quantitative proteomics | van Groen et al reported higher protein expression in fetal livers compared with that in term neonates. The protein expressions in infants to adults were similar. Genetic polymorphism was not associated with expression levels in this study. Prasad et al reported that when all samples were considered, no age-dependent changes in the protein expression was found. Protein levels were higher in *IAI*IA > 1-y-old cohort than the 0- to 12-mo group | van Groen et al,33 Prasad et al34 | |
| OATP1B3 (SLCO1B3) | Gene expression | mRNA levels in fetus, neonates and infants were lower than that in adults | Mooij et al26 |
| Quantitative proteomics | No age-dependent changes were found in van Groen et al; age-dependent increase reported in Prasad et al with TM50 approximately 6 mo | van Groen et al,33 Prasad et al34 | |
| OATP2B1 (SLCO2B1) | Gene expression | mRNA level was significantly higher in adult liver compared with that in fetus (GA 18–23 weeks) | Sharma et al39 |
| Quantitative proteomics | Comparable protein expression levels in livers from fetus to adults | van Groen et al,33 Prasad et al3440 | |
| NTCP (SLCIOAI) | Gene expression | mRNA level was low in fetal liver compared with adults | Sharma et al,39 Chen et al41 |
| Western blot | Relative expression was stable in livers samples from neonates and adults | Yanni et al42 | |
| Quantitative proteomics | Prasad et al reported stable protein expression from neonates to adults, van Groen et al showed that protein expression was significantly lower in fetuses than in term neonates, infants, children, and adults | van Groen et al,33 Prasad et al34 | |
| P-gp (ABCB1) | Gene expression | Detected in fetal liver; mRNA level increased rapidly during first 12 mo of life in infants | Mooij et al26 |
| Western blot | No significant differences in the relative protein expression from 0.3 to 12 y old | Tang et al43 | |
| Quantitative proteomics | Protein level increase from fetus to adults with TM50 approximately 2.9 y old | van Groen et al,33 Prasad et al34 | |
| MRP2 (ARCC2) | Gene expression | mRNA level increased; levels in fetal, neonatal, and infant livers were substantially lower than that in older children up to 12 y old | Mooij et al,26 Klaassen and Aleksunes44 |
| Quantitative proteomics | van Groen et al reported that MRP2 level was much lower in fetal and term newborn livers than that in adults. Prasad et al found no age-dependent changes | van Groen et al,33 Prasad et al34 | |
| MRP3 (ABCC3) | Gene expression | mRNA level was lower in fetal livers than that in adults | Sharma et al39 |
| Quantitative proteomics | van Groen et al reported that protein abundance was lower in fetus and term neonates than in adults. In Prasad et al, lower protein abundance was found in infants and adolescents than adults. | van Groen et al,33 Prasad et al34 | |
| MRP1 (ABCC1) | Quantitative proteomics | Protein levels were lower in fetus and term neonates than adults | van Groen et al33 |
| MRP4 {ABCC4) | Gene expression | No age-dependent changes in mRNA level | Sharma et al39 |
| MRP6 (ABCC6) | Gene expression | mRNA level increase from neonates to older children and adults | Klaassen and Aleksunes44 |
| BCRP (ABCG2) | Immunohistochemistry Gene expression | Detected in fetus as young as GA 5.5 weeks mRNA level was lower in fetal livers than in adults | Konieczna et al27 Sharma et al,39 Klaassen and Aleksunes44 |
| Quantitative proteomics | Stable across age groups from fetus to adults but age-dependent decrease observed in fetal and newborn cohorts | van Groen et al,33 Prasad et al34 | |
| BSEP (ABCB11) | Quantitative proteomics | Significantly lower in fetal livers compared with that in adults; no age-dependent changes after birth | van Groen et al,33 Prasad et al34 |
| MATE1 (SLC47A1) | Gene expression | mRNA showed age-dependent increase | Klaassen and Aleksunes44 |
| Quantitative proteomics | No age-dependent changes in protein abundance | Prasad et al34 | |
| GLUTI (SLC2A1) | Quantitative proteomics | Protein abundance was high in fetus and lower in other age groups | van Groen et al33 |
| MCTI (SLC16A1) | Quantitative proteomics | No age-dependent changes in protein abundance | van Groen et al33 |
| Kidney transporters | |||
| BCRP (ABCG2) | Gene expression | mRNA level was higher in term neonates than older counterparts | Cheung et al46 |
| Quantitative proteomics | No age-dependent changes in protein abundance | Cheung et al46 | |
| MATE1 (SLC47A1) | Gene expression | No age-dependent changes in mRNA level | Cheung et al46 |
| Quantitative proteomics | No age-dependent changes in protein abundance | Cheung et al46 | |
| MATE2-K (SLC47A2) | Gene expression | mRNA level was lower in term newborns than in adults | Cheung et al46 |
| Quantitative proteomics | No age-dependent changes in protein abundance | Cheung et al46 | |
| MRP2 (ABCC2) | Gene expression | No age-dependent changes in mRNA level | Cheung et al46 |
| MRP4 (ABCC4) | Gene expression | No age-dependent changes in mRNA level | Cheung et al46 |
| Immunohistochemistry | Proper localization observed in renal cortical fetal sample as early as GA 27 wk | Cheung et al46 | |
| URAT1 (SLC22A12) | Gene expression | mRNA levels increased with age from term newborn to adults | Cheung et al46 |
| Quantitative proteomics | Protein levels increased with age from term newborn to adults | Cheung et al46 | |
| P-gp (ABCB1) | Immunohistochemistry | Localization detected as early as end of first trimester of fetal life | van Kalken et al25 |
| Gene expression | mRNA levels were lower in preterm newborns, term newborns, and infants compared with older counterparts | Cheung et al46 | |
| Quantitative proteomics | Protein levels increased with age with TM50 approximately 1 mo | Cheung et al46 | |
| GLUT2 (SLC2A2) | Gene expression | No age-dependent changes in mRNA level | Cheung et al46 |
| Quantitative proteomics | No age-dependent changes in protein abundance | Cheung et al46 | |
| OATI (SLC22A6) | Gene expression | mRNA level increased with age | Cheung et al46 |
| Quantitative proteomics | Protein abundance increased with age. TM50 was approximately 5 mo | Cheung et al46 | |
| OAT3 (SLC22A8) | Gene expression | mRNA level increased with age | Cheung et al46 |
| Quantitative proteomics | Protein abundance increased with age. TM50 was approximately 8 mo | Cheung et al46 | |
| OCT2 (SLC22A2) | Gene expression Quantitative proteomics | mRNA level increased with age Protein expression increased with age. TM50 was approximately 1 mo | Cheung et al46 Cheung et al46 |
See Brouwer et al for a more detailed review.14
Figure 1.
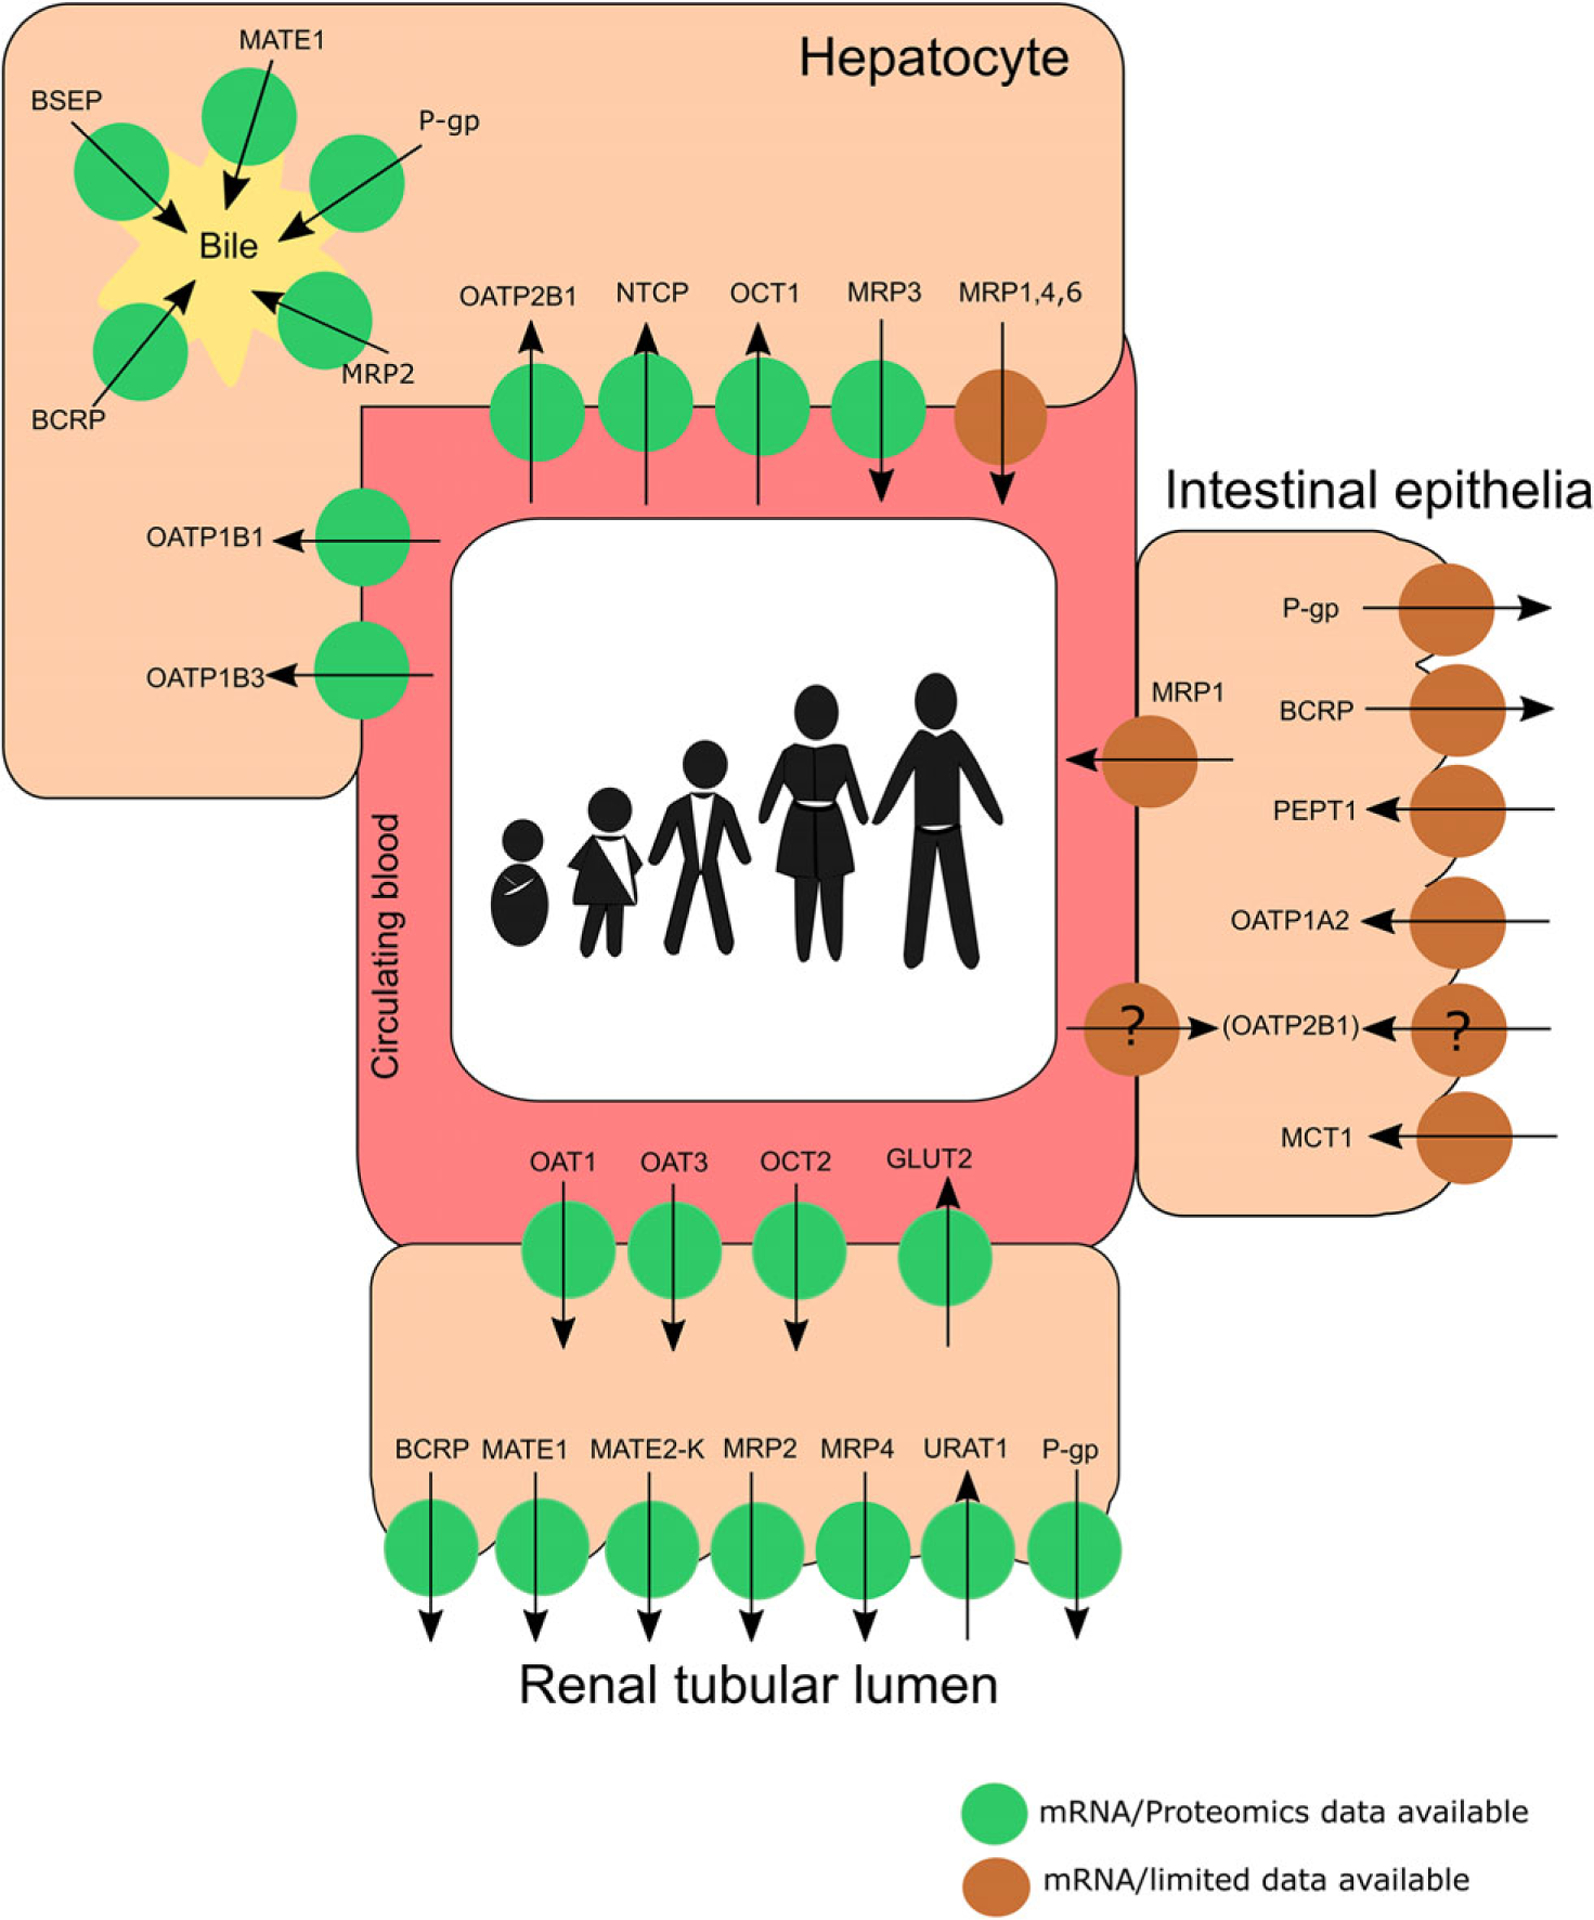
Summary of the human membrane transporters in the intestine, liver, and kidneys that are mentioned in this review. Transporters with only mRNA or limited data are depicted in brown circles, whereas those that have both gene expression and protein abundance data are depicted in green circles. (Adapted/modified from Brouwer et al14 and Chu et al.67) Noteworthy, the localization of OATP2B1 remains questionable. Future investigation is needed to ascertain if its localization is subject to developmental changes. BCRP, breast cancer resistance protein; BSEP, bile salt export pump; GLUT, glucose transporter; MATE, multidrug and toxin extrusion; MCT, monocarboxylate transporter; MRP, multidrug resistance-associated protein; NTCP, sodium/taurocholate cotransporting polypeptide; OAT, organic anion transporter; OATP, organic anion transporting polypeptide; OCT, organic cation transporter; PEPT1, peptide transporter 1; P-gp, P-glycoprotein; URAT1, uric acid transporter 1.
Ontogeny of Intestinal Transporters
Most drugs prescribed to children are administered orally.15 The intestine is a major absorption site of drugs that are administered via the oral route. Transporters that are present in the enterocytes on the gut wall mucosa govern the initial access into the systemic circulation of molecules such as sugars, amino acids, vitamins, but also of drug substrates.16,17 P-gp, multidrug resistance-associated protein 2(MRP2), and BCRP, for instance, are major efflux transporters that are responsible for limiting drug absorption. OATP1A2 and OATP2B1 have been suggested to participate in the intestinal absorption of drugs in humans.18 Further, peptide transporter (PEPT)1 is a major uptake transporter that facilitates absorption of peptide-like drugs in the systemic circulation such as β-lactam antibiotics.16,19 Therefore, drug absorption in children will be highly dependent on the expression and activity of these intestinal transporters.
P-gp, BCRP, MRPs, OATP2B1, and PEPT1.
In their review, Brouwer et al noted that ontogeny of intestinal transporters was mainly revealed by mRNA expression and localization data using immunohistochemistry.14 P-gp and MRP2 mRNA expression levels in neonates and infants appeared to be comparable to those in adults.20–27 Localization data suggested that BCRP and MRP1 distributions were similar in adult and fetal samples (5.5–28 weeks and 9–28 weeks of gestation, respectively).27 In contrast to the other intestinal transporters, OATP2B1 gene expression levels were much higher in neonates than in adults.26 Interestingly, the localization of OATP2B1 remains questionable; 2 studies observed localization of the transporter to the apical membrane of human enterocytes, but another research group, which studied mainly pediatric intestinal tissue samples, detected OATP2B1 in the basolateral membrane.28–31 This basolateral localization was also reported by another independent group using 6 healthy human adult jejunal tissue samples.32 Future studies are warranted to elucidate the localization of OATP2B1 and to ascertain if it is subject to developmental changes. Using a total of 26 intestinal tissues samples, which included 19 preterm and term neonates, 1 infant 13.9 weeks old, 2 children, and 4 adolescents, Mooij and colleagues studied the developmental changes in PEPT1 mRNA expression and localization.28 Although PEPT1 expression appeared to be slightly lower in neonates than in their older counterparts, the tissue distribution was relatively stable among all the samples studied.
Although changes in the gene expression and localization of these transporters during development were stressed in various published studies, data on their protein expression levels are still missing. In addition, the ontogeny patterns of other human intestinal transporters, such as OATP1A2 and monocarboxylate transporter (MCT)1, remain uncertain. Because many drugs are administered orally, it is crucial to fill this knowledge gap in intestinal transporter ontogeny.
Ontogeny of Liver Transporters
In comparison to intestinal transporters, data on developmental changes in hepatic transporters have grown quite rapidly recently. Classic analytical approaches include quantitative real-time polymerase chain reaction, which measures gene expression levels, immunohistochemistry, which visualizes localization, and Western blot, which measures the relative protein expression. In addition, quantitative proteomics via liquid chromatography/tandem mass spectrometry has been increasingly utilized to measure the absolute protein abundance of these transporters, allowing the quantification of many transporters in only a small amount of tissue. Proteomics data generated from 2 independent laboratories complemented each other in terms of age range of the samples and provided a more complete picture of the developmental patterns of hepatic transporters with higher confidence than what was known previously.33–35 In 1 study the protein abundance of 11 hepatic transporters was measured in approximately 69 postmortem tissue samples that covered the whole pediatric age range (4 neonates, 19 infants, 32 children, and 14 adolescents) and in 41 adult samples (>16 years old).34 In another study the absolute protein expression of 13 liver transporters was quantified in a pediatric cohort with a focus on the fetus and newborn up to postnatal 18 weeks of age that consisted of 62 pediatric tissue samples (36 fetuses, 12 premature newborns, 10 term newborns, 4 pediatric patients, and 8 tissue samples from adults).33 The findings in these 2 studies and other previous studies are discussed below.
OCT1: As previously reported, OCT1 mRNA levels in pediatric livers appeared to be comparable to those in adult livers.14,36 Nonetheless, OCT1 protein levels have been shown to undergo an age-dependent increase.33,34,37 This was supported by a recently published clinical study in neonates who were admitted to the neonatal intensive care unit where postmenstrual age as well as OCT1 genotype impacted the PK of the OCT1 substrate morphine.38 Further, the age at which half of adult level is reached (TM50) was also estimated using a sigmoidal maximum effect (Emax) model and was reported to be about 6 months.
OATP1B1: mRNA expression of OATP1B1 in fetal liver was 20-fold lower than that in adults, and that in neonates and infants was even lower (500-fold and 90-fold, respectively).14,26 Recent quantification of protein expression, nonetheless, revealed different findings. In their sample set van Groen et al found that the OATP1B1 expression was significantly higher in the fetal livers compared with that in term neonatal livers. The protein expressions in infants, children, and adults were similar.33 OATP1B1 is highly polymorphic. The impact of genetic variants on developmental changes in OATP1B1 expression was investigated in this cohort, but no association was identified for the studied genotypes. When all tissue samples were considered, Prasad et al reported that OAPT1B1 did not show age-dependent changes in the protein expression.34 Yet, when the analysis was performed on samples from donors with the OATP1B1 reference allele, *1A/*1A, samples from >1 year old were found to have higher protein expression than the 0-to 12-months group. Notably, in the >1-year-old cohort, OATP1B1 expression was about 2.5-fold higher in samples from donors with *14/*1A than from those with *15/*1A.
OATP1B3: Similar to OATP1B1, mRNA expression of OATP1B3 was reported to be much lower in fetuses, neonates, and infants compared with adults.14,26 Although proteomics data in 1 study showed that OATP1B3 expression was not associated with age, another illustrated that the expression of the transporter was subjected to age-dependent increase, and by 6 months of age, similar to OCT1, the protein expression would have reached 50% of the adult level.33,34
OATP2B1: mRNA levels of OAT2B1 were significantly higher in adult livers compared with those in livers from fetus at gestational age 18–23 weeks.14,39 However, quantitative proteomics suggested that OATP2B1 expression in liver from fetus of median 23.4 (range 15.2–41.3) weeks was comparable to that from preterm and term neonates, children, and adults.33 This lack of correlation with age was supported by 2 other analyses.34,40
Sodium taurocholate cotransporting polypeptide (NTCP): Various studies suggested that maturation of NTCP starts during perinatal stage and that the expression reaches adult levels at birth.14,34,39,41,42 Protein expression of NTCP revealed a similar trend in which NTCP expression was significantly lower in fetuses than in term neonates, infants, children, and adults and was lower in preterm neonates than in adults.33
P-gp: Previously it has been reported that P-gp is subject to developmental changes in the mRNA expression.14 The transcript level of P-gp was detected as early as 14 weeks gestational age, and the level increased rapidly during the first 12 months of life in infants and then reached a level comparable to that in adults.26 Despite the developmental changes in gene expression, 1 study reported no age-related differences in the relative protein expression in patients from 0.3 to 12 years old.43 Interestingly, however, the results from the 2 recent proteomic studies were in agreement with the mRNA data: P-gp protein expression was low in fetal liver tissues but increased with age.33,34 Further, TM50 was also estimated to be 2.94 years of age, suggesting that the P-gp expression continued to increase postnatally and would achieve adult level later on in children.34
MRP2: Using gene expression analysis, previous studies have shown that MRP2 mRNA levels were substantially lower in fetal, neonatal, and infant livers compared with older children up to 12 years of age.14,26,44 The result reported in 1 of the recent proteomic studies was in agreement with these findings in that MRP2 protein expression was approximately 3-fold lower in fetal and term newborn livers compared with adults.33 Yet, in another study, it was reported that MRP2 expression was not age dependent in their cohort.34
MRP3: MRP3 mRNA was detected in fetal hepatocytes as early as 18 weeks gestational age and was significantly lower than that found in adult livers.39 Proteomic data from recent studies agree with this observation. The fetal MRP3 protein level was approximately 3-fold lower than the adult level.33 Interestingly it was found in 1 study that the transporter expression appeared to be lower in adolescents than in adults.34
MRP1, MRP4, MRP6: Developmental information on these 3 MRPs is scarce. In their study, van Groen et al showed that MRP1 levels in livers from fetus and term neonates were about 2-fold lower than those in adults.33 MRP4 mRNA did not change with age.14,39 Although MRP6 mRNA expression was shown to increase from neonates to older children and adults, no proteomic data are currently available to determine if the actual protein expression shows a similar age-dependent change.44
BCRP: Localization of BCRP in the hepatocytes was detected in fetus as young as 5.5 weeks gestational age.27 BCRP mRNA expression was lower in fetal samples compared with adults.39,44 BCRP protein levels appeared to be comparable in fetus and after birth in all age groups.33,34 However, when the data set was analyzed as continuous data by postnatal age and postmenstrual age within the fetal and newborn cohort, BCRP expression interestingly showed an age-dependent decrease with Spearman correlation coefficients of −0.345 and −0.421, respectively.33
Bile salt export pump (BSEP): A functional study was conducted using sandwich-cultured fetal and adult hepatocytes, which showed that the biliary excretion index for taurocholate, an endogenous BSEP substrate, was lower in the fetal liver cells than in those of adults.39 Results from quantitative proteomics studies coincide with this observation; the fetal liver tissues expressed significantly lower BSEP compared with term newborns and adults.33 Maturation of BSEP appeared to occur mainly during the perinatal period, as no significant age-dependent changes were seen from neonates onward.33,34
MATE1: In contrast to the age-dependent increase in mRNA reported previously, protein expression of MATE1 appeared to be independent of age.14,34,44
Glucose transporter 1 (GLUT1): Developmental information for GLUT1 was previously lacking, but a recent proteomic study indicated that GLUT1 expression showed an age-dependent decrease with fetal liver tissues expressing the highest protein abundance and lower expression in the other age groups.33 This age-dependent decrease was more apparent in analyses of the expression levels in the youngest cohorts, fetus and newborn, based on the postnatal age and postmenstrual age with Spearman correlation coefficients of −0.51 and −0.59, respectively.
MCT1: Similarto GLUT1, the ontogeny of MCT1 was missing. The absolute protein abundance of this transporter was found to be comparable in fetal liver and in other age groups after birth.33
Recent Knowledge Gain on Liver Transporters.
Recent proteomics studies provided valuable ontogeny information for the liver transporters. Although gaps in the developmental changes in various liver transporters such as OAT2 and OAT7 still exist, the understanding in the association between transporter expression and age has been improved substantially, particularly for those transporters that have been shown to be clinically important: BCRP, P-gp, MATE1, and OATP1B1/3.13
Ontogeny of Renal Transporters
The kidney is the major site for elimination of many drugs. Three major processes are involved in drug disposition: glomerular filtration, active secretion, and reabsorption. Maturation of glomerular filtration has been studied quite extensively, but information on ontogeny of renal membrane transporters, which are key players in the active secretion, has been relatively scarce.14,45 Yet, information on the developmental changes in renal membrane transporters has emerged recently. Gene expression of 11 transporters was analyzed from a total of 184 frozen human renal cortical samples from preterm newborn to 75 years of age. The protein expression of 9 transporters and localization of MRP4 using immunohistochemistry were also studied using a subset of the kidney samples.46
BCRP: The mRNA level of BCRP was significantly higher in term neonates compared with other age groups, but the protein abundance appeared to be comparable across all age groups from term neonates to adults. Further studies are warranted to investigate this lack of gene-protein correlation, as only 1 term neonate was included for the proteomic analysis in that study.46
MATE1 and MATE2-K: mRNA and protein levels of MATE1 were independent of age.46 Although the transcript level of MATE2-K in term newborns was significantly lower than that in adults, the protein level was found to be comparable across all the age groups studied from term newborn to adults. However, similar to BCRP, the cohort of term neonates for proteomic analysis would need to be expanded in order to better characterize the correlation between gene and protein expression.
MRP2 and MRP4: mRNA levels of MRP2 and MRP4 appeared to be stable in preterm newborn, term newborn, infants, children, and their older counterparts. Interestingly, proper MRP4 localization was detected as early as gestational age 27 weeks, postnatal 9 days old. This result appeared to accompany the stable gene expression during development.46
Uric acid transporter 1 (URAT1): The mRNA and protein abundance of URAT1 increased with age from term newborn to adults.46
P-gp: Similarly to those of the liver and intestine, the ontogeny of renal P-gp was studied relatively extensively. P-gp localization was detected as early as the end of first trimester of fetal life.25 Results from gene expression analysis and quantitative proteomics expanded the understanding of the developmental changes of P-gp in kidney. P-gp mRNA levels were significantly lower in preterm newborns, newborns, and infants as compared with children, adolescents, and adults. This observation appeared to be translated well to protein expressions. A sigmoidal Emax model described this age-dependent increase, and the TM50 was approximately 1 month.46
GLUT2: An efficient carrier of glucose, GLUT2 did not show age-dependent changes in its mRNA expression and protein abundance.46
OAT1 and OAT3: The ontogeny of these 2 organic anion transporters was reflected in clinical data.45 For instance, 1 study showed that the secretion capacity of p-aminohippurate, an OAT1/3 substrate, appeared to be about one fifth of the adult level at birth.47–49 These observed age-related changes in the PK of transporter substrates are likely due to a combination of maturation in both transporter expression and glomerular filtration. Yet, the changes in transcript levels and protein abundance aligned with the clinical observations. mRNA and protein expressions for both OAT1 and OAT3 increased with age with a TM50 of approximately 5 months and 8 months, respectively. Further, intertransporter correlation analysis also demonstrated that these 2 transporters were highly correlated in their gene and protein expressions.46
OCT2: Similar to OATs and P-gp, the OCT2 mRNA levels and protein abundance are age dependent with the levels in newborns being significantly lower than those in children and adults. As with P-gp, OCT2 would reach half of the adult level about 1 month after birth.46
Recent Knowledge Gain on Renal Transporters.
The data from gene expression analysis, quantitative proteomics, and immunohistochemistry have painted a more complete picture for the ontogeny of renal membrane transporters. Of the 6 transporters that are clinically important and should be carefully considered in drug development, 4 of them, P-gp, OAT1, OAT3, and OCT2, showed age-dependent increases in their expression levels. This implies that drug substrates of these transporters would also be subject to age-dependent changes and might impact the elimination of these drugs in pediatric patients. Despite this increase in knowledge, more studies on term and preterm neonates are needed to better capture the variability in the age-related changes of transporter expression and also the interplay with maturation of glomerular filtration during this rapid developmental phase of life.50,51
Application of Ontogeny of Transporters to MIDD in Children
Overall, there has been a recent surge in data on the ontogeny of membrane transporters, which will greatly enhance our understanding in not only the disposition of drug substrates but the involvement of these transporters in developmental physiology in children. Although scarce data on the ontogeny of intestinal transporters still limit their application to modeling and simulation of oral drugs, the wealth of data in the domains of hepatic and renal transporter ontogeny present an opportunity to be leveraged for pediatric PBPK modeling, especially for intravenously administrated drugs, to assist the prediction in drug disposition and clearance in children.
The workflow of pediatric PBPK model development has been previously described (see Figure 2).52–55 In most cases an adult PBPK model is first established, verified, and refined. This model is comprised of the drug profile as well as the virtual adult population in which transporter protein abundance data and kinetics parameters, such as the Michaelis constant and maximum rate, can be incorporated to predict the organ-specific clearance (CL).56 Following the finalization and verification of the robust adult PBPK model, pediatric models could be generated by modifying the population-specific inputs (eg, blood flow to organs, organ weights, and protein abundance of drug-metabolizing enzymes and transporters) using algorithms or parameters such as ontogeny scaling factor for transporter abundance or intrinsic clearance. These are expressed as a function of age and can be derived from the developmental changes in the expression data described in previous section. Of note, although pediatric PBPK models can also be established based on drug physiological properties and preclinical data alone, this approach could lead to a lower confidence in the prediction compared with a model that is verified with adult clinical data.
Figure 2.
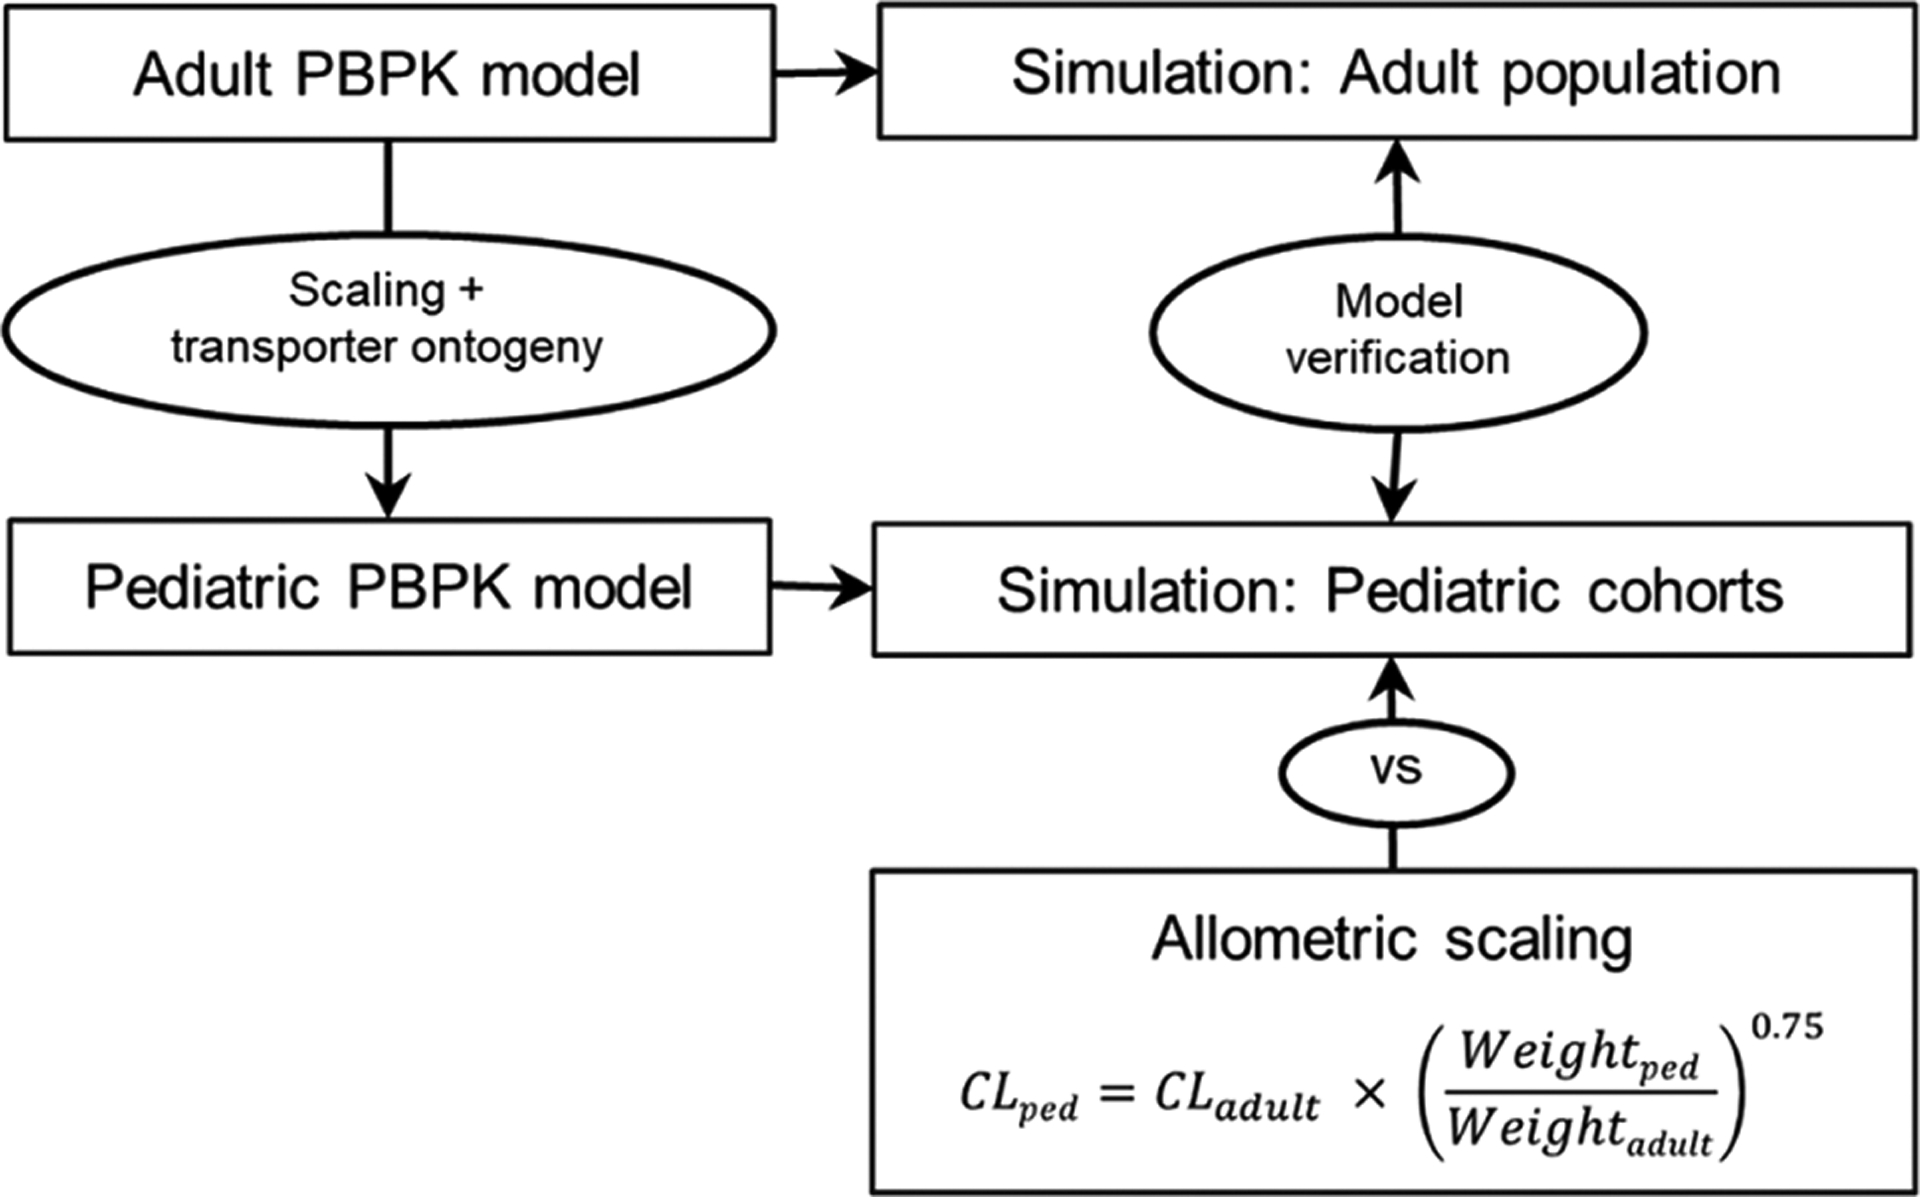
Workflow of the pediatric physiologically based pharmacokinetic model (PBPK) establishment to simulate drug exposure in children. An adult PBPK model was first established and verified by comparing the output from the simulations to that in observed data.After ensuring that the adult model was robust, the pediatric model was generated by scaling the anatomical and physiological parameters using default age-dependent algorithms and incorporating ontogeny information for the transporters that are pertinent to this study. The pediatric PBPK model was verified, once again, by comparing the output from the simulation input with observed data from literature. Predictive performance of allometry and PBPK in estimating the clearance in children was also evaluated. CL indicates clearance; ped, pediatric; vs, versus.
The success and confidence of PBPK modeling and simulation that involves transporter-mediated disposition using a bottom-up approach are critically dependent on factors such as the quality and availability of transporter kinetic data and understanding of in vitro–in vivo correlation. The following case study illustrates that the utility of leveraging transporter ontogeny data in PBPK modeling, with sufficient information gathered, can be useful to simulate drug exposure in pediatric patients.57
PBPK Modeling With Integrated Transporter Ontogeny Reasonably Predicted the Exposure of an Actively Renally Secreted Drug in Children
Tazobactam is a β-lactamase inhibitor. Currently, it is formulated as an intravenously administered combination product with either piperacillin, a β-lactam, or ceftolozane, a cephalosporin, as a broad-spectrum antibiotic.58,59 Tazobactam is prescribed for infections that could potentially be life threatening when left untreated. Hence, sufficient exposure is needed to assure therapeutic action without adverse events. As much as 80% of tazobactam is renally cleared in adults.59,60 In addition to glomerular filtration, tazobactam undergoes active tubular secretion that is mediated by OAT1 and OAT3.60,61 The remaining tazobactam is either converted to the inactive metabolite, M1, via hydrolysis and then eliminated renally, or it undergoes biliary excretion (Figure 3).60,62
Figure 3.
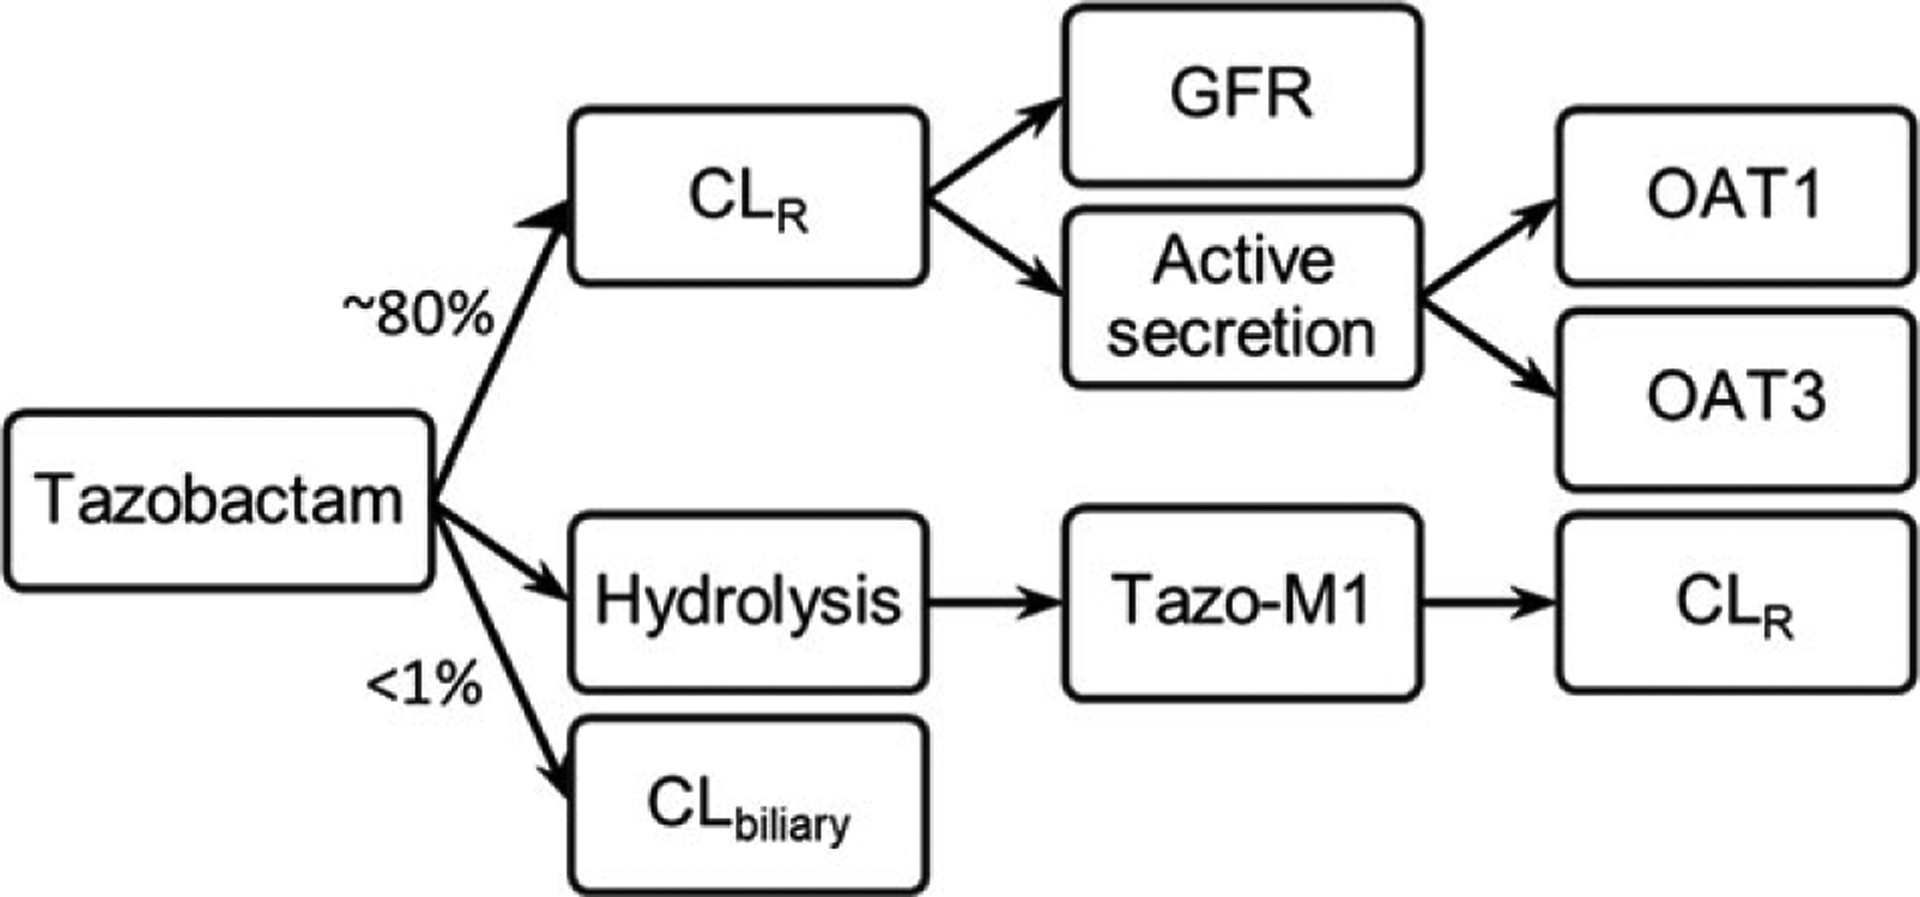
The elimination pathway of tazobactam. After intravenous administration, approximately 80% of tazobactam would be cleared renally by glomerular filtration and active secretion via OAT1 and OAT3. The majority of the rest of tazobactam would undergo hydrolysis to form the inactive metabolite, tazo-M1, which, similar to the parent drug, will be eliminated renally. A small amount (<1%) of tazobactam would undergo biliary excretion. CL indicates clearance; CLR, renal clearance; GFR, glomerular filtration rate; OAT, organic anion transporter.
The workflow of the adult and pediatric PBPK model establishment is summarized in Figure 2. OAT1/3 protein abundance and transporter kinetics from in vitro studies are obtained from the literature.46,61 The ontogeny scaling factors, which are the sigmoidal Emax functions, of OAT1/3 were incorporated.46 To address the argument on whether PBPK modeling is preferred over an allometric scaling approach in predicting the PK for pediatric patients <2 years old, the clearance in the pediatric cohorts was also estimated based on allometry and compared with that predicted using PBPK models.9 Noteworthy, previous studies have noted that the allometric exponent may be different for various pediatric age groups. However, since a validated exponent has not been established for neonates and infants, a fixed allometric exponent of 0.75 was applied to the pediatric cohorts in this study for simplicity.
The PBPK model captured the exposure of tazobactam after a 500-mg 60-minute IV infusion in adults well with the predicted maximal concentration, area under the curve, and clearance (CL) between 1.02- to 1.2-fold of the observed data (Figure 4a).63 After verifying and ensuring that the adult model was robust, 3 virtual pediatric populations were generated using the approach as outlined above: 0 to 3 months, 3 months to 2 years old, and 2 to 7 years old. Maximal concentration, area under the curve, and CL were all within 1.5-fold of observed data when the simulation was performed in these 3 cohorts, suggesting that the pediatric PBPK model predicted the exposure of tazobactam adequately in neonates, infants, and children (Figure 4b).64 Significantly, allometric scaling approaches resulted in CL estimations that were comparable to those predicted using PBPK. However, for the youngest age group, 0–3 months old, the PBPK model performed slightly better, as allometry slightly overpredicted the CL (1.2-fold versus 1.8-fold of observed CL).
Figure 4.
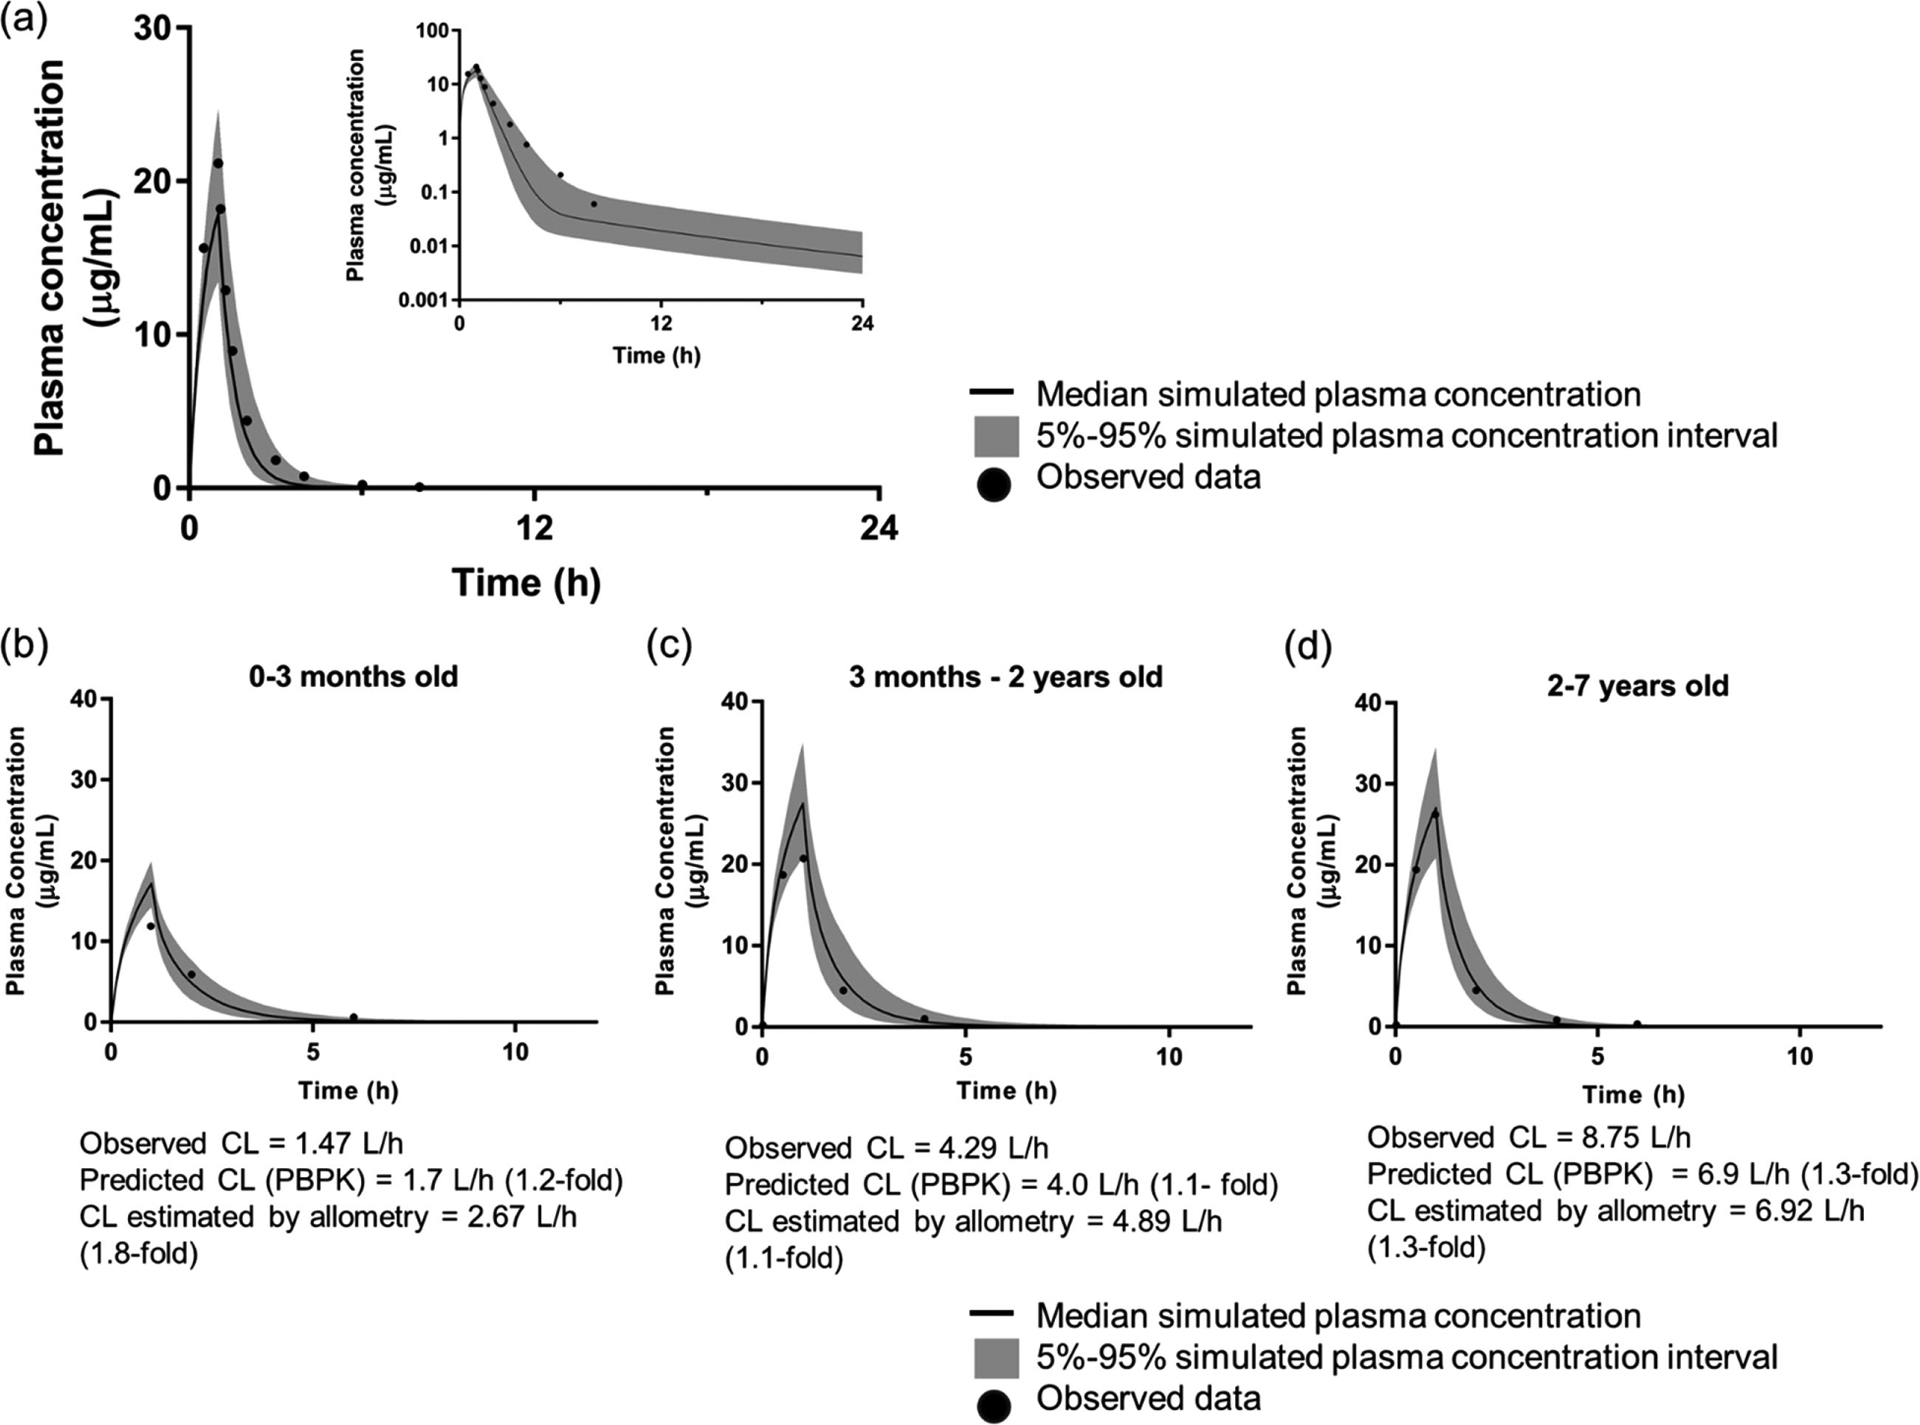
Simulation of tazobactam exposure in adult population (a) and 3 pediatric cohorts (b-d) using PBPK (PK-Sim v7.3, Bayer, St. Louis, Missouri). Following a 500-mg 60-minute infusion in the virtual adult population, the predicted Cmax, AUC, and CL were between 1.02- and 1.2-fold of the observed data.63 Three pediatric cohorts were generated: 0–3 months old (b), 3 months to 2 years old (c), and 2–7 years old (d). By taking into account the physiological and anatomical changes during development, and the ontogeny of transporters that are pertinent to the disposition of tazobactam, the tazobactam exposure was predicted reasonably well with Cmax, AUC, and CL were all within 1.5-fold of observed data.64 Allometric scaling approach resulted in CL estimation that were comparable to that predicted using PBPK. However, for the youngest age group, 0–3 months old (b), the PBPK model performed slightly better, as allometry slightly overpredicted the CL (1.2-fold vs 1.8-fold of observed CL). AUC indicates area under the concentration-time curve; CL, clearance; Cmax, peak plasma concentration; PBPK, physiologically based pharmacokinetics.
This case study illustrates the utility of a pediatric PBPK model with integrated renal transporter ontogeny function in simulating exposure of a drug that is actively renally secreted in pediatric patients. It exemplifies how this approach could be applied in pediatric drug development to support decision making on dosing to limit unnecessary exposure in pediatric patients. Further, it also highlights how a PBPK model can be used to complement the allometric scaling approach by predicting the whole PK (concentration-time) profile rather than just the drug clearance.
Considerations
The recent emergence of quantitative proteomics data on the expression and ontogeny of transporters substantially improves the predictive power of pediatric PBPK models for drug substrates. Nonetheless, there are important factors that need to be considered when incorporating protein abundance into PBPK models. Although liquid chromatography/tandem mass spectrometry-based quantitative proteomics provides a powerful tool by using peptide sequences to measure the absolute abundance of transporter proteins, it could not acknowledge if the transporters are successfully localized to the membrane, nor could it distinguish truncated protein and splice variants from properly formed proteins or glycosylated from nonglycosylated protein.65 Consequently, these would undermine the assumed correlation between transporter expression and activity. Further, scaling from the protein abundance data per crude membrane protein or per gram tissue level to per organ level is the first step in integrating such data into PBPK. This should be done carefully, as parameters that are used to scale, such as membrane protein yield per gram of tissue, could also be subject to age-related changes.33 Last, it is important to reiterate that the success of PBPK simulation in children using a bottom-up approach depends highly on knowledge of the drug disposition pathway and the data available for the ontogeny of the metabolic enzymes and transporters involved. For instance, with a good understanding of the maturational differences between UGT enzymes and sulfotransferase, 1 study successfully predicted the exposure, as well as metabolic formation and elimination, of acetaminophen, which is mainly glucuronidated in adults but almost exclusively sulfated in newborns due to age-dependent changes in the UGT enzymes expression and activity, in various pediatric age groups using PBPK.66 Nonetheless, for drugs that are substrates of certain metabolic enzymes and transporters of which the developmental changes are not fully understood, results from the simulation should be interpreted carefully.
Conclusion/Future Direction
Collectively, international collaborative efforts have greatly improved the understanding of the role(s) of transporters in drug PK, pharmacodynamics, safety, and efficacy not only in adults but also in specific populations such as pediatrics. This understanding is supported by the expansion of knowledge in the ontogeny of membrane transporters, especially those in the liver and kidney. This increased knowledge has significant implications for PBPK modeling for drug substrates and therefore is of great importance for pediatric drug development. However, knowledge gaps in the ontogeny of transporters in the intestine and other important barrier tissues such as the blood-brain barrier remain and are waiting to be addressed through future collaborative work. Further investigation would also be required to elucidate how gene and protein expression relate to transporter activity. Last, as illustrated in the case study, in addition to ontogeny, a thorough understanding of the disposition of drugs and their interplay is critical in the application of PBPK to adequately predict drug exposure in children.
Funding
Funding for this work was made possible, in part, by the US FDA through the Medical Countermeasures Initiative, and grant U01FD004979/U01FD005978, which supports the UCSF-Stanford Center of Excellence in Regulatory Science and Innovation.
Dr. Kit Wun Kathy Cheung was supported, in part, by the appointments to the Research Participation Program at the Center for Drug Evaluation and Research, administered by the Oak Ridge Institute for Science and Education through an interagency agreement between the US Department of Energy and the US FDA.
Footnotes
Conflicts of Interest
The authors declare no conflicts of interest for this work.
Disclaimer
The contents of this article reflect the views of the authors and should not be construed to represent the US FDA’s views or policies. No official support or endorsement by the US FDA is intended or should be inferred. The mention of commercial products, their sources, or their use in connection with material reported herein is not to be construed as either an actual or implied endorsement of such products by the US FDA.
References
- 1.t’Jong GW, Eland IA, Sturkenboom MCJM, van den Anker JN, Stricker BHC. Unlicensed and off label prescription of drugs to children: population based cohort study. BMJ. 2002;324(7349):1313–1314. [DOI] [PMC free article] [PubMed] [Google Scholar]
- 2.Institute of Medicine (US) Forum on Drug Discovery, Development, and Translation. Addressing the barriers to pediatric drug development: workshop summary In: The National Academies Collection: Reports Funded by National Institutes of Health. Washington, DC: National Academies Press; 2008. [PubMed] [Google Scholar]
- 3.Rodieux F, Wilbaux M, van den Anker JN, Pfister M. Effect of kidney function on drug kinetics and dosing in neonates, infants, and children. Clin Pharmacokinet. 2015;54(12):1183–1204. [DOI] [PMC free article] [PubMed] [Google Scholar]
- 4.Food US and Administration Drug. Best Pharmaceuticals for Children Act and Pediatric Research Equity Act. https://www.da.gov/science-research/pediatrics/best-pharmaceuticals-children-act-and-pediatric-research-equity-act Accessed May 16, 2019.
- 5.European Medicines Agency. Paediatric Regulation. https://www.ema.europa.eu/en/human-regulatory/overview/paediatric-medicines/paediatric-regulation. Accessed June 13, 2019. [Google Scholar]
- 6.European Commission. State of Paediatric Medicines in the EU. 10 years of the EU Paediatric Regulation. 2017. https://ec.europa.eu/health/sites/health/files/files/paediatrics/docs/2017_childrensmedicines_report_en.pdf.
- 7.Wang Y, Zhu H, Madabushi R, Liu Q, Huang S-M, Zineh I. Model-informed drug development: current US regulatory practice and future considerations. Clin Pharmacol Ther. 2019;105(4):899–911. [DOI] [PubMed] [Google Scholar]
- 8.Food US and Administration Drug. PDUFA reauthorization performance goals and procedures fiscal years 2018. through 2022. https://www.fda.gov/industry/prescription-drug-user-fee-amendments/pdufa-vi-fiscal-years-2018–2022. Accessed May 14, 2019.
- 9.Grimstein M, Yang Y, Zhang X, et al. Physiologically based pharmacokinetic modeling in regulatory science: an update from the US Food and Drug Administration’s office of clinical pharmacology. J Pharm Sci. 2019;108(1):21–25. [DOI] [PubMed] [Google Scholar]
- 10.Committee for Human Medicinal Products, European Medicines Agency. ICH E11(R1) guideline on clinical investigation of medicinal products in the pediatric population. https://www.ema.europa.eu/en/documents/scientific-guideline/iche-11r1-guideline-clinical-investigation-medicinal-products-pediatric-population-revision-1_en.pdf. Accessed June 12, 2019.
- 11.US Food and Drug Administration. Pharmaceutical Science and Clinical Pharmacology Advisory Committee. 2012 Meeting Materials, Pharmaceutical Science and Clinical Pharmacology Advisory Committee. http://wayback.archive-it.org/7993/20170111202603/http://www.fda.gov/AdvisoryCommittees/CommitteesMeetingMaterials/Drugs/AdvisoryCommitteeforPharmaceuticalScienceandClinicalPharmacology/ucm286697.htm. Accessed May 19, 2019.
- 12.Zhang L, Huang S-M, Reynolds K, Madabushi R, Zineh I. Transporters in drug development: scientific and regulatory considerations. Clin Pharmacol Ther. 2018;104(5):793–796. [DOI] [PubMed] [Google Scholar]
- 13.US Food and Drug Administration. In Vitro Metabolism-and Transporter- Mediated Drug-Drug Interaction Studies Guidance for Industry. 2017. https://www.fda.gov/regulatory-information/search-fda-guidance-documents/vitro-metabolism-and-transporter-mediated-drug-drug-interaction-studies-guidance-industry. Accessed May 15, 2019.
- 14.Brouwer KLR, Aleksunes LM, Brandys B, et al. Human ontogeny of drug transporters: review and recommendations of the Pediatric Transporter Working Group. Clin Pharmacol Ther. 2015;98(3):266–287. [DOI] [PMC free article] [PubMed] [Google Scholar]
- 15.Mooij MG, de Koning BAE, Huijsman ML, de Wildt SN. Ontogeny of oral drug absorption processes in children. Expert Opin Drug Metab Toxicol. 2012;8(10):1293–1303. [DOI] [PubMed] [Google Scholar]
- 16.Müller J, Keiser M, Drozdzik M, Oswald S. Expression, regulation and function of intestinal drug transporters: an update. Biol Chem. 2017;398(2):175–192. [DOI] [PubMed] [Google Scholar]
- 17.Estudante M, Morais JG, Soveral G, Benet LZ. Intestinal drug transporters: an overview. Adv Drug Deliv Rev. 2013;65(10):1340–1356. [DOI] [PubMed] [Google Scholar]
- 18.Tamai I Oral drug delivery utilizing intestinal OATP transporters. Adv Drug Deliv Rev. 2012;64(6):508–514. [DOI] [PubMed] [Google Scholar]
- 19.Transporters Kramer W., Trojan horses and therapeutics: suitability of bile acid and peptide transporters for drug delivery. Biol Chem. 2011;392(1–2):77–94. [DOI] [PubMed] [Google Scholar]
- 20.Mizuno T, Fukuda T, Masuda S, et al. Developmental trajectory of intestinal MDR1/ABCB1 mRNA expression in children. Br J Clin Pharmacol. 2014;77(5):910–912. [DOI] [PMC free article] [PubMed] [Google Scholar]
- 21.Fakhoury M, Lecordier J, Medard Y, Peuchmaur M, Jacqz-Agrain E. Impact of inflammation on the duodenal mRNA expression of CYP3A and P-glycoprotein in children with Crohn disease. Inflamm Bowel Dis. 2006;12(8):745–749. [DOI] [PubMed] [Google Scholar]
- 22.Fakhoury M, de Beaumais T, Guimiot F, et al. mRNA expression of MDR1 and major metabolising enzymes in human fetal tissues. Drug Metab Pharmacokinet. 2009;24(6):529–536. [DOI] [PubMed] [Google Scholar]
- 23.Fakhoury M, Litalien C, Medard Y, et al. Localization and mRNA expression of CYP3A and P-glycoprotein in human duodenum as a function of age. Drug Metab Dispos. 2005;33(11):1603–1607. [DOI] [PubMed] [Google Scholar]
- 24.Miki Y, Suzuki T, Tazawa C, Blumberg B, Sasano H. Steroid and xenobiotic receptor (SXR), cytochrome P450 3A4 and multidrug resistance gene 1 in human adult and fetal tissues. Mol Cell Endocrinol. 2005;231(1–2):75–85. [DOI] [PubMed] [Google Scholar]
- 25.Van Kalken CK, Giaccone G, van der Valk P, et al. Multidrug resistance gene (P-glycoprotein) expression in the human fetus. Am J Pathol. 1992;141(5):1063–1072. [PMC free article] [PubMed] [Google Scholar]
- 26.Mooij MG, Schwarz UI, de Koning BAE, et al. Ontogeny of human hepatic and intestinal transporter gene expression during childhood: age matters. Drug Metab Dispos. 2014;42(8):1268–1274. [DOI] [PMC free article] [PubMed] [Google Scholar]
- 27.Konieczna A, Erdösová B, Lichnovská R, Jandl M, Cížková K, Ehrmann J. Differential expression of ABC transporters (MDR1, MRP1, BCRP) in developing human embryos. J Mol Histol. 2011;42(6):567–574. [DOI] [PubMed] [Google Scholar]
- 28.Mooij MG, de Koning BEA, Lindenbergh-Kortleve DJ, et al. Human intestinal PEPT1 transporter expression and localization in preterm and term infants. Drug Metab Dispos. 2016;44(7):1014–1019. [DOI] [PubMed] [Google Scholar]
- 29.Kobayashi D, Nozawa T, Imai K, Nezu J, Tsuji A, Tamai I. Involvement of human organic anion transporting polypeptide OATP-B (SLC21A9) in pH-dependent transport across intestinal apical membrane. J Pharmacol Exp Ther. 2003;306(2):703–708. [DOI] [PubMed] [Google Scholar]
- 30.Sai Y, Kaneko Y, Ito S, et al. Predominant contribution of organic anion transporting polypeptide OATP-B (OATP2B1) to apical uptake of estrone-3-sulfate by human intestinal Caco-2 cells. Drug Metab Dispos. 2006;34(8):1423–1431. [DOI] [PubMed] [Google Scholar]
- 31.Oswald S Organic anion transporting polypeptide (OATP) transporter expression, localization and function in the human intestine. Pharmacol Ther. 2019;195:39–53. [DOI] [PubMed] [Google Scholar]
- 32.Keiser M, Kaltheuner L, Wildberg C, et al. The organic anion-transporting peptide 2B1 is localized in the basolateral membrane of the human jejunum and Caco-2 monolayers. J Pharm Sci. 2017;106(9):2657–2663. [DOI] [PubMed] [Google Scholar]
- 33.Van Groen BD, van de Steeg E, Mooij MG, et al. Proteomics of human liver membrane transporters: a focus on fetuses and newborn infants. Eur J Pharm Sci. 2018;124:217–227. [DOI] [PubMed] [Google Scholar]
- 34.Prasad B, Gaedigk A, Vrana M, et al. Ontogeny of hepatic drug transporters as quantified by LC-MS/MS proteomics. Clin Pharmacol Ther. 2016;100(4):362–370. [DOI] [PMC free article] [PubMed] [Google Scholar]
- 35.Mooij MG, van de Steeg E, van Rosmalen J, et al. Proteomic analysis of the developmental trajectory of human hepatic membrane transporter proteins in the first three months of life. Drug Metab Dispos. 2016;44(7):1005–1013. [DOI] [PubMed] [Google Scholar]
- 36.Hayashi M, Hui A, DeKeyser J, Louie S, Shou M, Xu L. Evaluation of uptake transporters in human adult and pediatric hepatocytes. Abstracts of the 17th North American Regional ISSX International Society for the Study of Xenobiotics. Drug Metab Rev. 2011;43:198. [Google Scholar]
- 37.Hahn D, Emoto C, Vinks AA, Fukuda T. Developmental changes in hepatic organic cation transporter OCT1 protein expression from neonates to children. Drug Metab Dispos. 2017;45(1):23–26. [DOI] [PMC free article] [PubMed] [Google Scholar]
- 38.Hahn D, Emoto C, Euteneuer JC, Mizuno T, Vinks AA, Fukuda T. Influence of OCT1 ontogeny and genetic variation on morphine disposition in critically ill neonates: lessons from PBPK modeling and clinical study. Clin Pharmacol Ther. 2019;105(3):761–768. [DOI] [PubMed] [Google Scholar]
- 39.Sharma S, Ellis ECS, Gramignoli R, et al. Hepatobiliary disposition of 17-OHPC and taurocholate in fetal human hepatocytes: a comparison with adult human hepatocytes. Drug Metab Dispos. 2013;41(2):296–304. [DOI] [PMC free article] [PubMed] [Google Scholar]
- 40.Prasad B, Evers R, Gupta A, et al. Interindividual variability in hepatic organic anion-transporting polypeptides and P-glycoprotein (ABCB1) protein expression: quantification by liquid chromatography tandem mass spectroscopy and influence of genotype, age, and sex. Drug Metab Dispos. 2014;42(1): 78–88. [DOI] [PMC free article] [PubMed] [Google Scholar]
- 41.Chen H-L, Chen H-L, Liu Y-J, et al. Developmental expression of canalicular transporter genes in human liver. J Hepatol. 2005;43(3):472–477. [DOI] [PubMed] [Google Scholar]
- 42.Yanni SB, Smith PB, Benjamin DK, Augustijns PF, Thakker DR, Annaert PP. Higher clearance of micafungin in neonates compared with adults: role of age-dependent micafungin serum binding. Biopharm Drug Dispos. 2011;32(4):222–232. [DOI] [PMC free article] [PubMed] [Google Scholar]
- 43.Tang L Age-associated hepatic drug transporter expression and its implication. 2007. Theses and Dissertations (ETD). Paper 260. 10.21007/etd.cghs.2007.0312 [DOI]
- 44.Klaassen CD, Aleksunes LM. Xenobiotic, bile acid, and cholesterol transporters: function and regulation. Pharmacol Rev. 2010;62(1):1–96. [DOI] [PMC free article] [PubMed] [Google Scholar]
- 45.Fernandez E, Perez R, Hernandez A, Tejada P, Arteta M, Ramos JT. Factors and mechanisms for pharmacokinetic differences between pediatric population and adults. Pharmaceutics. 2011;3(1):53–72. [DOI] [PMC free article] [PubMed] [Google Scholar]
- 46.Cheung KWK, van Groen BD, Spaans E, et al. A comprehensive analysis of ontogeny of renal drug transporters: mRNA analyses, quantitative proteomics and localization [published online ahead of print 2019]. Clin Pharmacol Ther. 10.1002/cpt.1516 [DOI] [PMC free article] [PubMed] [Google Scholar]
- 47.Alcorn J, McNamara PJ. Ontogeny of hepatic and renal systemic clearance pathways in infants: part II. Clin Pharmacokinet. 2002;41(13):1077–1094. [DOI] [PubMed] [Google Scholar]
- 48.Burckhardt G, Bahn A, Wolff NA. Molecular physiology of renal p-aminohippurate secretion. News Physiol Sci. 2001;16:114–118. [DOI] [PubMed] [Google Scholar]
- 49.Cha SH, Sekine T, Fukushima JI, et al. Identification and characterization of human organic anion transporter 3 expressing predominantly in the kidney. Mol Pharmacol. 2001;59(5):1277–1286. [DOI] [PubMed] [Google Scholar]
- 50.Rhodin MM, Anderson BJ, Peters AM, et al. Human renal function maturation: a quantitative description using weight and postmenstrual age. Pediatr Nephrol. 2009;24(1):67–76. [DOI] [PubMed] [Google Scholar]
- 51.Faa G, Gerosa C, Fanni D, et al. Morphogenesis and molecular mechanisms involved in human kidney development. J Cell Physiol. 2012;227(3):1257–1268. [DOI] [PubMed] [Google Scholar]
- 52.Maharaj AR, Edginton AN. Physiologically based pharmacokinetic modeling and simulation in pediatric drug development. CPT Pharmacometrics Syst Pharmacol. 2014;3:e150. [DOI] [PMC free article] [PubMed] [Google Scholar]
- 53.Hornik CP, Wu H, Edginton AN, Watt K, Cohen-Wolkowiez M, Gonzalez D. Development of a pediatric physiologically-based pharmacokinetic model of clindamycin using opportunistic pharmacokinetic data. Clin Pharmacokinet. 2017;56(11):1343–1353. [DOI] [PMC free article] [PubMed] [Google Scholar]
- 54.Leong R, Vieira MLT, Zhao P, et al. Regulatory experience with physiologically based pharmacokinetic modeling for pediatric drug trials. Clin Pharmacol Ther. 2012;91(5): 926–931. [DOI] [PubMed] [Google Scholar]
- 55.Salerno SN, Burckart GJ, Huang S-M, Gonzalez D. Pediatric drug-drug interaction studies: barriers and opportunities. Clin Pharmacol Ther. 2019;105(5):1067–1070. [DOI] [PMC free article] [PubMed] [Google Scholar]
- 56.Guo Y, Chu X, Parrott NJ, et al. Advancing predictions of tissue and intracellular drug concentrations using in vitro, imaging and physiologically based pharmacokinetic modeling approaches. Clin Pharmacol Ther. 2018;104(5):865–889. 10.1002/cpt.1183 [DOI] [PMC free article] [PubMed] [Google Scholar]
- 57.Cheung KWK, Zhang L, Huang S-M, Giacomini K. PBPK models with integrated renal transporter ontogeny predict systemic exposure to tazobactam, oseltamivir and oseltamivir carboxylate in children. Clin Pharmacol Ther. 2019;105(S1):S8. [Google Scholar]
- 58.Zosyn [package insert]. New York: Pfizer; 2017. [Google Scholar]
- 59.Zerbaxa [package insert]. Kenilworth, NJ: Merck; 2014. [Google Scholar]
- 60.Sörgel F, Kinzig M. The chemistry, pharmacokinetics and tissue distribution of piperacillin/tazobactam. J Antimicrob Chemother. 1993;31(suppl A):39–60. [DOI] [PubMed] [Google Scholar]
- 61.Wen S, Wang C, Duan Y, et al. OAT1 and OAT3 also mediate the drug-drug interaction between piperacillin and tazobactam. Int J Pharm. 2018;537(1–2):172–182. [DOI] [PubMed] [Google Scholar]
- 62.Westphal JF, Brogard JM, Caro-Sampara F, et al. Assessment of biliary excretion of piperacillin-tazobactam in humans. Antimicrob Agents Chemother. 1997;41(8):1636–1640. [DOI] [PMC free article] [PubMed] [Google Scholar]
- 63.Miller B, Hershberger E, Benziger D, Trinh M, Friedland I. Pharmacokinetics and safety of intravenous ceftolozane-tazobactam in healthy adult subjects following single and multiple ascending doses. Antimicrob Agents Chemother. 2012;56(6): 3086–3091. [DOI] [PMC free article] [PubMed] [Google Scholar]
- 64.Bradley JS, Ang JY, Arrieta AC, et al. Pharmacokinetics and safety of single intravenous doses of ceftolozane/tazobactam in children with proven or suspected Gram-negative infection. Pediatr Infect Dis J. 2018;37(11):1130–1136. [DOI] [PubMed] [Google Scholar]
- 65.Achour B, Dantonio A, Niosi M, et al. Data generated by quantitative liquid chromatography-mass spectrometry proteomics are only the start and not the endpoint: optimization of quantitative concatemer-based measurement of hepatic uridine-5’-diphosphate-glucuronosyltransferase enzymes with reference to catalytic activity. Drug Metab Dispos. 2018;46(6):805–812. [DOI] [PubMed] [Google Scholar]
- 66.Jiang X-L, Zhao P, Barrett JS, Lesko LJ, Schmidt S. Application of physiologically based pharmacokinetic modeling to predict acetaminophen metabolism and pharmacokinetics in children. CPT Pharmacometrics Syst Pharmacol. 2013;2:e80. [DOI] [PMC free article] [PubMed] [Google Scholar]
- 67.Chu X, Liao M, Shen H, et al. Clinical probes and endogenous biomarkers as substrates for transporter drug-drug interaction evaluation: perspectives from the International Transporter Consortium. Clin Pharmacol Ther. 2018;104(5):836–864. [DOI] [PubMed] [Google Scholar]