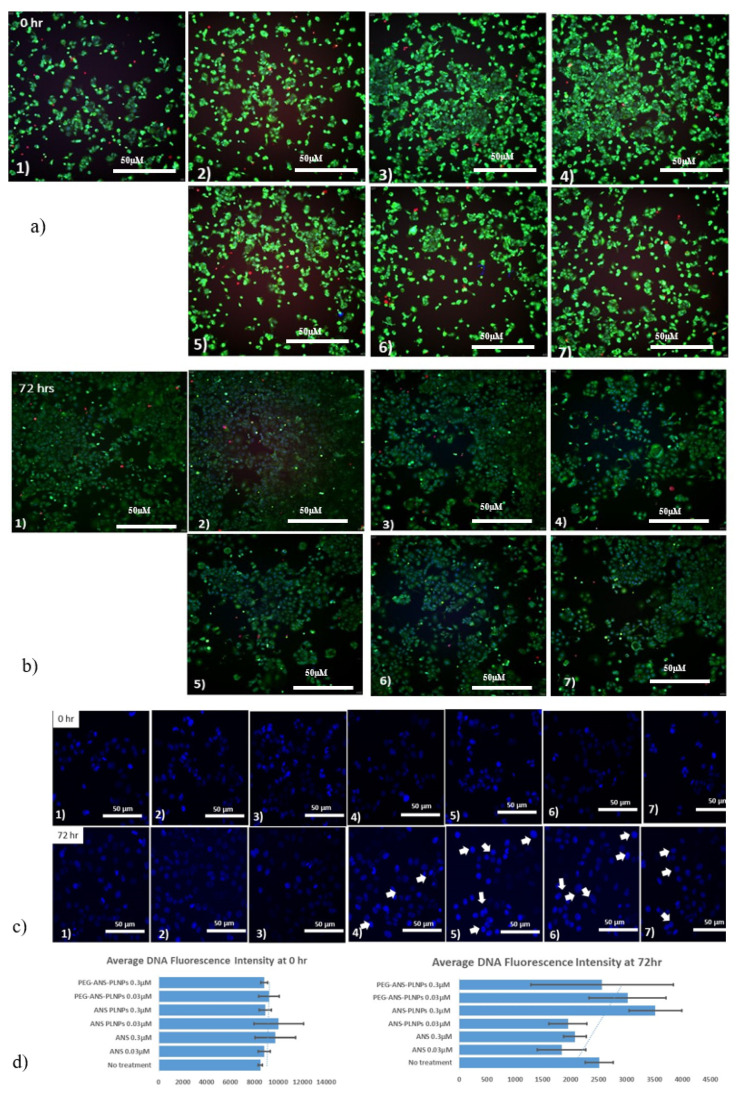
Figure 6.
Fluorescence high content imaging of MCF-7 cells. MCF-7 cells were treated with (1) vehicle, (2) 0.03 µM anastrozole, (3) 0.3 µM anastrozole, (4) 0.03 µM PEG-ANS-PLNPs, (5) 0.3 µM PEG-ANS-PLNPs, (6) 0.03 µM ANS-PLNPs, and (7) 0.3 µM ANS-PLNPs for 0 h and 72 h. After treatment, cells were stained with calcein AM (2 μg/mL), HOECHST33342 (5 μg/mL), and propidium iodide (2.5 μg/mL) for 20 min. (a,b) Represent the merged images at times 0 and 72 h; (c) Represents the cells stained with HOECHST 33342; and (d) Represents the bar graphs of average nuclear fluorescence intensities of the MCF-7 cells at times 0 and 72 h. Scale bar of all images is 50 µm.

