Abstract
Purpose
The purpose of this study was to use chromatic pupil campimetry (CPC) for an objective evaluation of local retinal function in exudative age-related macular degeneration (AMD) and to assess disease activity.
Methods
Gaze-controlled CPC was performed in 19 subjects with optical coherence tomography–confirmed exudative AMD (75 ± 4 years; 11 women) and the results compared with those of an age-matched control group (n = 11; 72 ± 6 years; 8 women). Local retinal function was evaluated by measuring pupil responses to 3° red stimuli (60 cd/m2, 1 second) at 41 positions covering 30° of the central visual field on a dim blue background (test duration 6 minutes). Primary outcome parameters were relative maximal pupil constriction amplitude (% from baseline) and latency to constriction onset.
Results
Pupil constriction amplitudes were significantly reduced in the macular region, and especially in the fovea in AMD (16% ± 4.7%; mean ± standard deviation), compared with the control group (24% ± 6%; P = 0.00036). Receiver operating characteristic values were 0.84 for the constriction amplitude in the fovea, and 0.9 for the steepness angle between periphery and center. Mean latency to constriction onset in the fovea in AMD was significantly longer (333 ± 53 ms; normals 273 ± 59 ms, P = 0.0072), and particularly in the active compared with the inactive status of exudative AMD (P = 0.01).
Conclusions
CPC detected functional changes in exudative AMD with high sensitivity. Time dynamics of active exudative AMD differed from disease inactivity.
Translational Relevance
With the combination of short recording time, objectiveness of the measurement and gaze-correction for fixation problems, this method presents a suitable complement to the currently used clinical functional tests of the macula.
Keywords: pupil campimetry, pupillometry, objective measurement, retinal function, age-related macular degeneration, exudative AMD
Introduction
Age-related macular degeneration (AMD) is one of the most common causes of legal blindness in elderly people worldwide. The prevalence is increasing and represents a socioeconomic challenge. More than 30 million people worldwide are suffering from AMD-related visual impairment, which is entailing economic costs of approximately $294 billion in 2020.1
Objective and reliable measurements are crucial for early detection and treatment, as well as for follow-up evaluation in patients with exudative AMD. A milestone in the detection and evaluation of AMD has been the development of optical coherence tomography (OCT). It quickly became the gold standard diagnostic tool to morphologically assess the need of therapy, in the form of intravitreal injections of anti-angiogenetic substances. Although OCT essentially improves the retinal evaluation morphologically, it allows no direct measurement of retinal functionality.
Conventional static perimetry is capable of measuring the subjective perception of static visual stimuli but requires concentration and cooperation from the examined person; thus becoming particularly difficult with disease progress and loss of central vision in AMD. Static perimetry, flicker perimetry, and microperimetry might be helpful as diagnostic tools in AMD,2–5 but—as all subjective devices—remain restricted in validity. Evaluating the visual field by analyzing pupillary responses to local light stimuli has the advantage of an objective assessment of local retinal function. Pupil perimetry and pupil campimetry, in which the classical perimetric hemisphere is exchanged by a flat monitor for stimulus presentation, are methods to successfully detect certain visual field defects,6–11 and help in distinguishing functional origin of visual field defects.7,8,12 Sabeti et al.13 reported differences in multifocal pupillography before and after a 3-month series of intravitreal injection of the vascular endothelial growth factor (VEGF)–inhibitor ranibizumab in exudative AMD, as well as altered pupillary responses according to the extent of retinal damage in atrophic AMD.14 The pupillary light reflex consists of responses from rhodopsin-driven rods and opsin-driven S-/M-/L- cones, as well as a melanopsin-driven direct activation of intrinsically photosensitive retinal ganglion cells (ipRGCs). By election of suitable stimulus parameters, particularly the wavelength of the used stimuli, chromatic pupillography has been shown to allow insight in the interaction of classical photoreceptors and ipRGCs and to detect certain diseases like glaucoma,15–17 retinitis pigmentosa,18,19 and also AMD.20,21 The advantage of pupil campimetry or perimetry over full-field chromatic pupillometry is the possibility to measure local retinal function and to detect local functional defects that can be reliably further monitored in follow-up examinations. We recently presented a new pupillometric device with implemented gaze tracking (chromatic pupil campimetry [CPC]), which enables a retinotopic visual field examination regardless of fixation problems.8 It combines focal with chromatic stimulation by presenting light stimuli of adjustable size, intensity, and wavelength at different locations of the visual field, and measuring the respective pupillary responses to assess photoreceptor-specific local retinal function. The present study focuses on an objective evaluation of retinal function in patients with exudative AMD in regard to (1) detection of functional defects in the macular region, and (2) differentiation of disease activity and disease inactivity.
Methods
Participants and Ethical Aspects
Nineteen adult patients (8 men, 11 women; 75 ± 4 years) with a confirmed diagnosis of exudative AMD and ability to consent were included in the study. The study was approved by the local institutional ethics committee (project number: 783/2017BO2) and followed the tenets of the Declaration of Helsinki. Before the experiments, detailed information had been given to and written informed consent was obtained from all volunteers. They were recruited via the Day Clinic for Macular Degeneration of the Department for Ophthalmology, University Hospital, Tübingen. As part of their routine controls in the Day Clinic for Macular Degeneration, patients were examined and, if suitable, asked for voluntary participation in the pupillographic study. Afterward, the regular examinations in the Day Clinic were continued and, if necessary, an intravitreal anti-VEGF injection was terminated or directly performed. The pupillographic measurements were completely independent of this process. The clinical routine examination included history, visual acuity (decimal mean visual acuity, 0.45 ± 0.33), slit lamp examination, ophthalmoscopy, OCT, and fundus autofluorescence (Spectralis-OCT, Heidelberg Engineering GmbH, Heidelberg, Germany). The number of received anti-VEGF injections of the examined eye in the past were 23.7 ± 12; range 7 to 55.
Patients were measured twice within their consecutive clinical follow-ups in the Day Clinic for Macular Degeneration. Nine subjects changed in the status of the disease (“active” vs. “inactive”) between the two measurements, four subjects remained in active status in both measurements, and for six subjects the status of the disease was inactive in both measurements.
Eleven age-matched adults served as a control (3 men, 8 women; 72 ± 6 years). Before study participation, they underwent an ophthalmologic examination including history, visual acuity (decimal mean visual acuity, 1.1 ± 0.12), swinging-flashlight test, slit lamp examination, ophthalmoscopy, and OCT to test for exclusion criteria. These were a history of any other relevant eye disease, pupillomotor disorders caused by iris defects or innervation impairment, ophthalmic and systemic diseases, as well as use of medication with influence on the pupil or relevant impaired media opacity (particularly severe cataract), and additional ophthalmic disorders with influence of the retinal functionality (e.g., glaucoma, retinal detachment, high refractive error >8 dpt) or measurement performance (e.g., nystagmus). Mild age-expected cataract was not considered as an exclusion criterion.
Chromatic Pupil Campimetry
The basic components and software of the pupil campimeter were described in detail elsewhere.8 The device consisted of an OLED-monitor (Samsung/LG OLED 55C7V; Samsung, Seoul, South Korea) for stimulus presentation, which was located at a fixed distance of 40 cm from the participant's eye, and an infrared camera for continuous recording of the pupil diameter (temporal resolution 10 ms). A combined chin- and headrest ensured a comfortable stabilization of the subject's head. In addition to a central dim fixation mark at the monitor as a fixation aid, implemented gaze-tracking of the software automatically recognized and corrected for subtle eye movements and allowed a retinotopic stimulus presentation, which is especially important in AMD patients with central impaired vision.
For a reliable gaze-tracking, a short individual calibration with four fixation marks, one in each quadrant, was performed. For the subsequent experiment, one eye was patched, the other eye was stimulated, and the direct pupillary response was measured.
The CPC-device is depicted in a recent publication.22
Stimuli were presented at 41 different locations at central (0°), 3°, 6°, 12°, 20°, and 30° eccentricity of the visual field, and repeated four times in the center (0°) and twice for the other locations (3°–30°). Stimuli were automatically repeated in case of strong artefacts (e.g., severe blinking during stimulus presentation) or if at least 90% of the initial baseline pupil diameter was not reached. The mean value of the pupillary responses was calculated per location.
Stimulus characteristics were as follows: baseline period 500 ms, stimulus radius 3°, stimulus duration 1 second, stimulus intensity 60 cd/m2, stimulus wavelength 620 ± 30 nm FWHM (full width at half maximum), ≙1.7 × 10⁻⁵ watt, and interstimulus interval 4.5 seconds on a dim blue background (0.01 cd/m2; wavelength 460 ± 30 nm FWHM; ≙ 2.1 × 10⁻⁸ watt). Stimulus characteristics were according to the recommendation of current standards in pupillography23 and specifically validated including the test-retest reliability.22
The whole examination lasted approximately 6 to 8 minutes for one tested eye.
Statistics
Statistical analyses were performed to test for a group difference between the pupillary responses of AMD patients and age-matched control subjects by two-tailed t-tests. For AMD patients, to preserve the independence of observations, only the first measurement was taken for the between-group statistical analyses.
Pupillary response parameters were the maximal constriction amplitude and the latency to constriction onset, which was calculated from the intersection between the estimated linear fit during pupillary constriction and the linear fit of the mean baseline diameter. Latency to constriction onset was chosen as it reflects the time dynamic of the neuronal network of the pupillary circuitry without additional confounding factors. The receiver operating characteristic (ROC) curve with calculated area under the curve (AUC) was used to evaluate sensitivity and specificity of several parameters of the pupillary responses, which are the aforementioned maximal constriction amplitude and the latency to constriction onset and additionally of the steepness angle of the line between the constriction amplitudes at peripheral locations in comparison to central locations.
For each individual AMD patient, the mean pupillary responses over all stimulus locations within the affected macular region (determined by OCT and autofluorescence) were taken for further subgroup analyses. As all AMD patients were measured twice, analyses were performed to compare for differences with regard to disease activity. For that purpose, all measurements of the AMD patients were classified as status active or inactive depending on whether the OCT scans of the macular region showed fluid or not. According to this attribution, three AMD subgroups were identified:
-
1.
AMD patients showing at one measurement status active and at one measurement status inactive → subgroup 1: status active/inactive (n = 9)
-
2.
AMD patients showing at both measurement status active → subgroup 2: status active/active (n = 4)
-
3.
AMD patients showing at both measurement status inactive → subgroup 3: status inactive/inactive (n = 6).
Results are presented in mean ± standard deviation. P < 0.05 was considered statistically significant. For region-specific analyses, P value was adjusted according to Bonferroni correction to 0.008 (six nonindependent t-tests).
Results
Pupillary Responses of AMD Patients Differ Significantly in the Macular Region Compared with Age-Matched Control Subjects
The mean pupil baseline diameter was comparable and did not show a statistically significant difference between the groups: 4.1 ± 1.1 mm (range 2.5–6.5 mm) for AMD patients, and 4.2 ± 0.9 mm (range 2.6–5.3 mm) for the control group (P = 0.9).
The mean absolute maximal pupil constriction amplitude was significantly reduced in the macular region in AMD patients compared with the control group. At the central stimulation at the fovea (0°), the mean absolute maximal pupil constriction amplitude was 0.67 ± 0.29 mm (range 0.27–1.2 mm) for AMD patients, and 1.0 ± 0.36 mm (range 0.58–1.6 mm) for the control group (P = 0.00036). In the peripheral locations outside the macular region, AMD patients showed similar results compared with age-matched normal subjects.
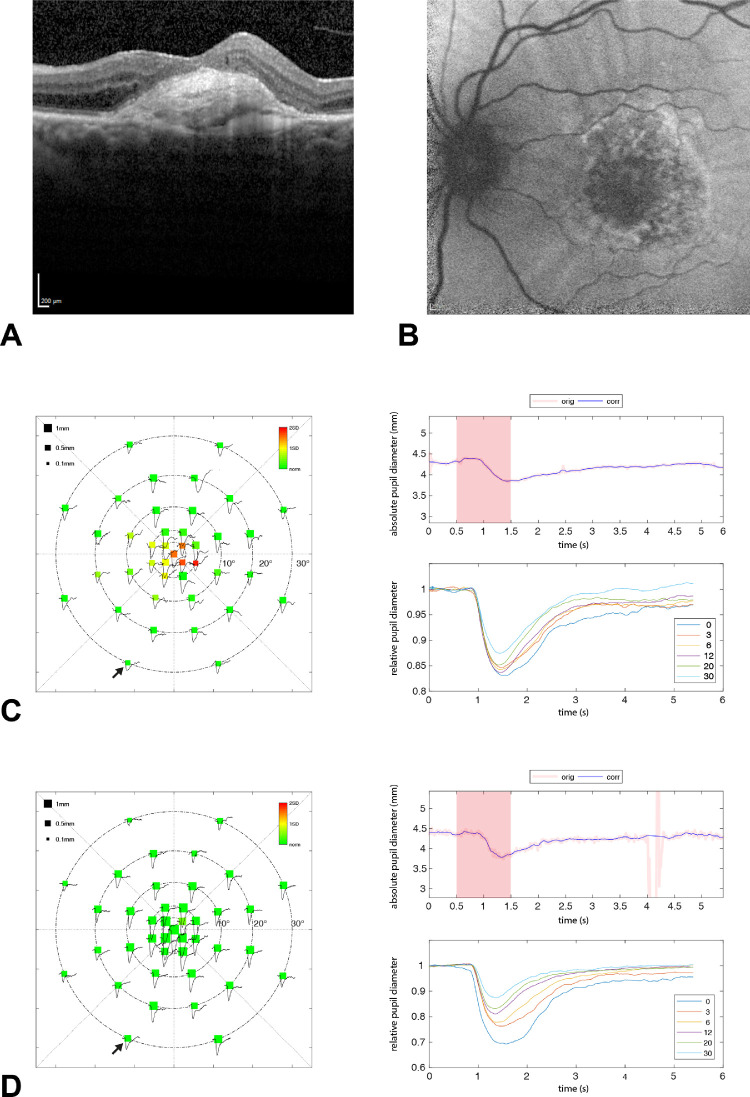
The pupillographic results of one AMD patient are exemplarily shown in Figure 1, with the corresponding horizontal OCT scan and autofluorescence of the macula. A strong consistency between the central pupillographic functional defects and the central structural defects is demonstrated.
Figure 1.
Results of the left eye of AMD patient number 5. Horizontal OCT scan (A) and autofluorescence (B) of the macula with corresponding pupillographic results (C). The pupillographic results of one control subject are depicted as a comparison (D). The left column shows the averaged absolute values of the maximal constriction amplitudes per stimulus location within the 30° visual field. The size of the squares represents the amount of pupil constriction (in mm) after the respective local light stimulation. Color scale indicates a deviation from the mean of the age-matched control group from green to red. The upper right column shows the raw data of one exemplary pupillographic trace (location marked by a small black arrow). The reddish square area represents the time period of stimulus presentation. The averaged relative pupillary traces corrected for baselines and sorted by their eccentricity from the center with 0° to 30° are presented at the lower right column. A strong consistency between the central pupillographic functional defects and the central structural defects of the AMD patient is demonstrated.
For further analyses, the relative pupil constriction amplitude in percent from baseline was used to correct for baseline differences.
Relative Maximal Pupil Constriction Amplitude
The Table shows the mean relative maximal constriction amplitudes for all stimulus eccentricities from 0° to 30° for the AMD group and the control group, with the respective P values for statistical significance. Relative pupil constriction amplitudes differed statistically significantly in the macular region, with the largest reduction in the fovea in AMD compared with the control group.
Table.
Relative Maximal Pupil Constriction Amplitudes in % from Baseline as an Average Over All Subjects for AMD and Control Subjects, Respectively, for Different Stimulus Location Eccentricities from 0° to 30°
| Mean Relative Maximal Constriction Amplitudes for Different Stimulus Locations | AMD (n = 19) | Normal Controls (n = 11) | P Value (Bonferroni-Corrected Significance P < 0.008) |
|---|---|---|---|
| 0° (1 spot) | 16.0% ± 4.7% | 24.0% ± 6.0% | 0.00036 |
| 3° (4 spots) | 14.8% ± 5.1% | 22.7% ± 5.7% | 0.00057 |
| 6° (8 spots) | 13.3% ± 4.7% | 19.1% ± 4.9% | 0.0033 |
| 12° (8 spots) | 11.2% ± 4.6% | 15.6% ± 4.8% | 0.017 |
| 20° (12 spots) | 9.6% ± 4.2% | 12.1% ± 4.0% | 0.12 |
| 30° (8 spots) | 7.7% ± 3.7% | 8.8% ± 2.6% | 0.38 |
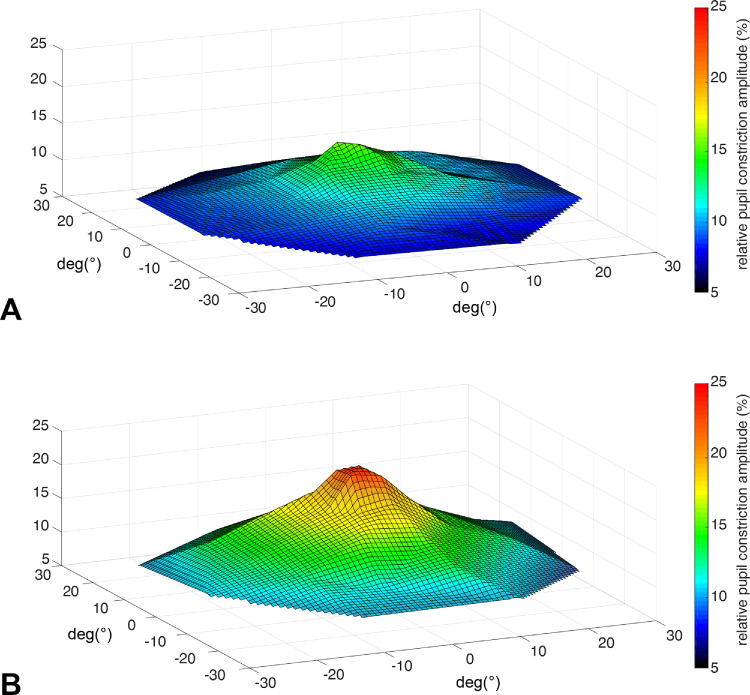
In Figure 2, a topology of the relative constriction amplitudes as an average over all AMD patients and the control group is depicted showing the lack of the typical central hill because of the centrally located retinal defects in AMD.
Figure 2.
Topology of pupillary responses (relative pupil constriction amplitude in percent from baseline) for AMD patients (A) and the control group (B); average over all subjects.
ROC analyses with the calculated AUC confirmed a high accuracy to detect central functional retinal defects in AMD patients compared with the age-matched control group. The AUC for the maximal constriction amplitude in the fovea was 0.84, and the AUC for the steepness angle between 30°-peripheral and central stimulation/pupil responses was 0.9 (Figs. 3A, 3B). Thus the steepness angle between peripheral and central responses revealed to be a promising parameter to distinguish macular defects from healthy subjects.
Figure 3.
ROC analyses for sensitivity and 1-specificity for different pupillary parameters with AUC: maximal constriction amplitude in the fovea (A), steepness angle between 30°-peripheral and central stimulation (B), and latency to constriction onset in the fovea (C).
Latency to Constriction Onset
The mean latency to constriction onset in the fovea in AMD patients was significantly longer than in the control group (AMD: 333 ± 53 ms; normal: 273 ± 59 ms; P = 0.0027), with relatively high discrimination in the ROC-analysis (AUC = 0.79; Fig. 3C).
In Figure 4, individual values for the steepness angle of pupillary constriction amplitudes between periphery and fovea and the latency to constriction onset are presented in a two-dimensional scatter plot.
Figure 4.
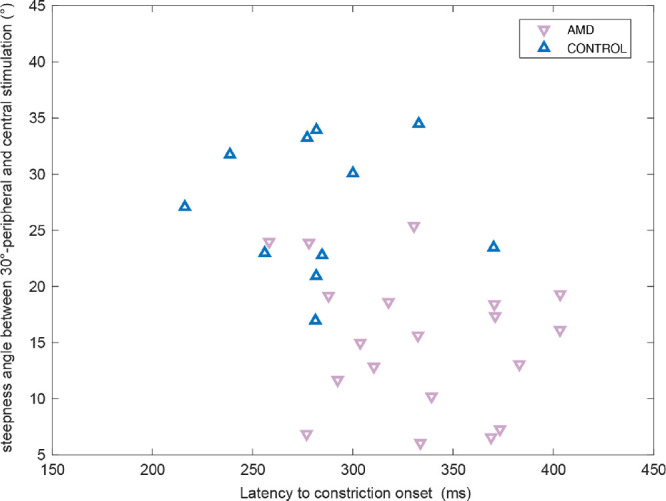
Scatter plot of the steepness angle of pupillary constriction amplitudes between 30°-peripheral and central stimulation, and the latency to constriction onset in the fovea for each individual AMD subject (red down-pointing triangle) and age-matched control subjects (blue up-pointing triangle).
Pupillary Responses Differ Related to Disease Activity in AMD Patients
All AMD patients were measured twice and classified to three subgroups according to their disease activity (for details see Methods section). Nine AMD patients changed between active and inactive status in OCT between the two independent measurements (subgroup 1: status active/inactive), four AMD patients remained active (subgroup 2: status active/active), and six AMD patients remained inactive (subgroup 3: status inactive/inactive) in both measurements.
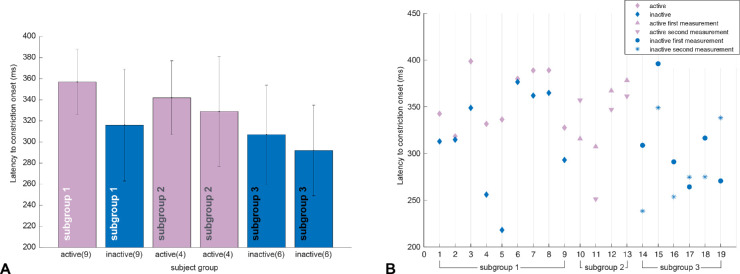
Comparing the pupillary results of the affected retina from active versus inactive measurements in the earlier mentioned subgroup 1, no statistically significant difference in the maximal constriction amplitude could be observed (paired t-test; Fig. 5). However, latency to constriction onset was significantly prolonged in status active compared with status inactive. This effect was seen in the subgroup average (active: 357 ± 31 ms; inactive: 316 ± 53 ms; paired t-test, P = 0.01; Fig. 6A) and in every individual AMD patient of subgroup 1 (Fig. 6B). The two unchanging subgroups 2 and 3 confirmed longer latencies in both measurements in the active status compared with the inactive status (Fig. 6A).
Figure 5.
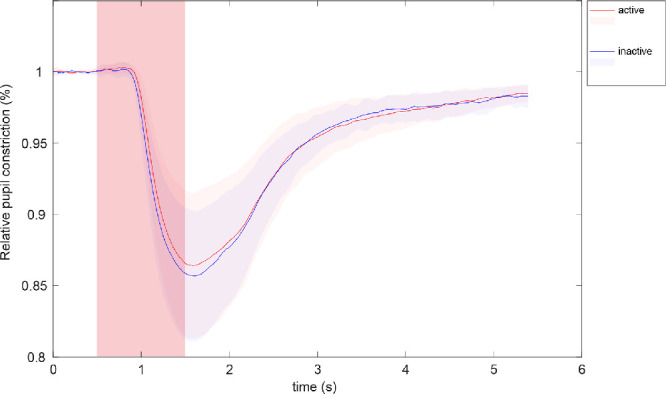
Comparison of the mean relative pupil constriction amplitude (%) averaged over all stimulus locations within the damaged retina for each AMD patient who changed between status active (red) and status inactive (blue)—according to OCT—between the two measurements (n = 9). The reddish square area represents the time period of stimulus presentation.
Figure 6.
Latency to constriction onset (in ms) averaged over all stimulus locations within the damaged retina for each AMD patient, separated for subgroups according to their activity in two measurements: subgroup 1: status active/inactive (n = 9), subgroup 2: status active/active (n = 4), and subgroup 3: status inactive/inactive (n = 6). A prolonged latency is observed in disease activity compared with inactivity in group comparisons (A) and is also evident in the subgroup 1 of AMD patients with a status change active/ inactive between the two measurements in every individual patient (B).
Discussion
In this study, we demonstrated that an objective detection of functional defects in the macular region in patients with exudative AMD is possible by analyzing pupillary responses to focal light stimulation with the method of gaze-controlled CPC. This means an appropriate complement to the currently used few clinical functional tests of the macula and surpasses current methods by its high accuracy. The method is particularly suitable owing to its objectiveness of the measurement, its short and contactless characteristics, and the ensured retinotopic stimulation with gaze-correction for fixation problems in this patient group.
Comparing the results of exudative AMD patients with those of age-matched control subjects, a clear reduction of the pupil constriction amplitude and a prolonged latency to constriction onset after stimulation could be observed in the macular region (Figs. 1, 2, 4) with intact responses outside the macula. ROC analysis proved high precision to detect functional macular defects (AUC = 0.79–0.9; Fig. 3). Similar results were reported for decibel response amplitudes with a multifocal strategy in exudative AMD.24
Particularly the steepness angle between peripheral and central responses revealed to be a promising parameter to distinguish macular defects from healthy subjects. However, although functional defects were detectable with high accuracy in exudative AMD, we caution not to consider them as disease-specific. Similar pupillary responses occur in macular defects caused by other etiologies, for example in Stargardt disease, or other maculopathies. Reduced pupil constriction amplitudes were recently reported in Best vitelliform macular dystrophy,9 thus this parameter alone does not allow for an objective diagnosis or rather differentiation of AMD and Best vitelliform macular dystrophy. However time dynamics of the pupillary responses seem to differ characteristically. Ben Ner et al.9 reported faster pupillary responses in Best vitelliform macular dystrophy, whereas we demonstrated significantly prolonged latencies to constriction onset in the affected retina in exudative AMD (Fig. 6). Latency to constriction onset might be a parameter with the potential to differentiate disease activity and disease inactivity in exudative AMD. In all nine subjects of our cohort who changed from status active/inactive between the two measurements (determined in accordance with evidence of fluid in the OCT), latency to constriction onset was longer for the active versus the inactive status (P = 0.01; Fig. 6). Thus morphologic changes of the macula detected by OCT were reflected in altered retinal function detected by CPC, namely prolonged latencies of the pupillary responses.
As our normal sample was age-matched, we regard this effect to be related to the disease and not to age. Advantageous is the assumption of Fotiou et al.25 based on a cohort of 100 healthy subjects that the latency of the pupil light reaction remains unaltered with age, whereas other parameters like baseline, maximum constriction velocity, and acceleration are suggested to be influenced by age.
We hypothesize that the morphologic changes that occur in active exudative AMD increase the time dynamic response of the neuronal network but do not necessarily affect the number of responding photoreceptors immediately. Therefore the amplitude of the pupillary response, which is primarily driven by the summation of photoreceptor activity, could stay unaltered, whereas the latency might already be prolonged. After some time, in the course of the disease, the number of responding photoreceptors will decrease, resulting in a decline in the amplitude of the pupillary response.
Our finding of a stronger change of the time dynamic parameter than the constriction amplitude of pupillary responses in tracking functional changes in exudative AMD is also in accordance with work by Sabeti et al.,13 who demonstrated a larger effect of intravitreal ranibizumab injections on time to peak responses than on constriction amplitudes. However, a direct comparison between our study and the aforementioned study of Sabeti´s group is not possible as their method used a multifocal stimulation strategy, whereas we purposely stimulated one location after the other to prevent possible summation and inhibitory effects within the retina. Furthermore, our stimulus characteristics were chosen to predominantly stimulate cones; the protocol has been previously established and validated in a normal cohort and example cases of patients with PDE6A-retinitis pigmentosa and CNGA3-achromatopsia, respectively, as a proof of concept.22
A limitation of the current study is the relatively small number of subjects changing between active and inactive status in the course of the disease. Moreover, as we only have one measurement session for the control group and subgroup 2 and 3 revealed relatively big differences between two measurements for some individuals, we are limited in the interpretation of the results regarding latency in AMD patients.
Conclusions
An objective detection of functional defects in the macular region in patients with exudative AMD is possible using CPC. Change in disease activity to active status of exudative AMD was always accompanied by a prolongation of latency to constriction onset. However, the variation in this parameter in individual subjects is high and should be carefully interpreted. Further investigations in exudative AMD are needed to explore the full potential of pupillary responses as a biomarker for functional defects in AMD.
Acknowledgments
The authors thank Irena Stingl for her graphics support with the figures.
Supported by the Egon Schumacher-Stiftung, Barnstorf, Germany, a private foundation without commercial interest.
Abstract for Poster Presentation at the ARVO Annual Meeting, April 28 to May 2 2019, Vancouver, Canada.
Disclosure: C. Kelbsch, None; J. Lange, None; H. Wilhelm, None; B. Wilhelm, None; T. Peters, None; M. Kempf, None; L. Kuehlewein, None; K. Stingl, None
References
- 1. Access Economics Pty Limited for AMD Alliance International. The global economic cost of visual impairment. Available at: http://www.icoph.org/resources/146/The-Global-Economic-Cost-of-Visual-Impairment.html. Accessed July 3, 2019.
- 2. Phipps JA, Dang TM, Vingrys AJ, Guymer RH. Flicker perimetry losses in age-related macular degeneration. Invest Ophthalmol Vis Sci. 2004; 45: 3355–3360. [DOI] [PubMed] [Google Scholar]
- 3. Nowomiejska K, Oleszczuk A, Zubilewicz A, et al.. Assessment of the macula function by static perimetry, microperimetry and rarebit perimetry in patients suffering from dry age related macular degeneration. Klin Oczna. 2007; 109: 131–134. [Polish]. [PubMed] [Google Scholar]
- 4. Cassels NK, Wild JM, Margrain TH, Chong V, Acton JH. The use of microperimetry in assessing visual function in age-related macular degeneration. Surv Ophthalmol. 2018; 63: 40–55. [DOI] [PubMed] [Google Scholar]
- 5. Luu CD, Dimitrov PN, Wu Z, et al.. Static and flicker perimetry in age-related macular degeneration. Invest Ophthalmol Vis Sci. 2013; 54: 3560–3568. [DOI] [PubMed] [Google Scholar]
- 6. Schmid R, Luedtke H, Wilhelm BJ, Wilhelm H. Pupil campimetry in patients with visual field loss. Eur J Neurol. 2005; 12: 602–608. [DOI] [PubMed] [Google Scholar]
- 7. Skorkovská K, Lüdtke H, Wilhelm H, Wilhelm B. Pupil campimetry in patients with retinitis pigmentosa and functional visual field loss. Graefes Arch Clin Exp Ophthalmol. 2009; 247: 847–853. [DOI] [PubMed] [Google Scholar]
- 8. Stingl K, Peters T, Strasser T, et al.. Pupillographic campimetry: an objective method to measure the visual field. Biomed Tech (Berl). 2018; 63: 729–734. [DOI] [PubMed] [Google Scholar]
- 9. Ben Ner D, Sher I, Hamburg A, et al.. Chromatic pupilloperimetry for objective diagnosis of Best vitelliform macular dystrophy. Clin Ophthalmol. 2019; 13: 465–475. [DOI] [PMC free article] [PubMed] [Google Scholar]
- 10. Naber M, Roelofzen C, Fracasso A, et al.. Gaze-contingent flicker pupil perimetry detects scotomas in patients with cerebral visual impairments or glaucoma. Front Neurol. 2018; 9: 558. [DOI] [PMC free article] [PubMed] [Google Scholar]
- 11. Tan L, Kondo M, Sato M, Kondo N, Miyake Y. Multifocal pupillary light response fields in normal subjects and patients with visual field defects. Vision Res. 2001; 41: 1073–1084. [DOI] [PubMed] [Google Scholar]
- 12. Rajan MS, Bremner FD, Riordan-Eva P. Pupil perimetry in the diagnosis of functional visual field loss. J R Soc Med. 2002; 95: 498–500. [DOI] [PMC free article] [PubMed] [Google Scholar]
- 13. Sabeti F, Maddess T, Essex RW, James AC. Multifocal pupillography identifies ranibizumab-induced changes in retinal function for exudative age-related macular degeneration. Invest Ophthalmol Vis Sci. 2012; 53: 253–260. [DOI] [PubMed] [Google Scholar]
- 14. Sabeti F, James AC, Essex RW, Maddess T. Multifocal pupillography identifies retinal dysfunction in early age-related macular degeneration. Graefes Arch Clin Exp Ophthalmol. 2013; 251: 1707–1716. [DOI] [PubMed] [Google Scholar]
- 15. Kelbsch C, Maeda F, Strasser T, et al.. Pupillary responses driven by ipRGCs and classical photoreceptors are impaired in glaucoma. Graefes Arch Clin Exp Ophthalmol. 2016; 254: 1361–1370. [DOI] [PubMed] [Google Scholar]
- 16. Feigl B, Mattes D, Thomas R, Zele AJ. Intrinsically photosensitive (melanopsin) retinal ganglion cell function in glaucoma. Invest Ophthalmol Vis Sci. 2011; 52: 4362–4367. [DOI] [PubMed] [Google Scholar]
- 17. Najjar RP, Sharma S, Atalay E, et al.. Pupillary responses to full-field chromatic stimuli are reduced in patients with early-stage primary open-angle glaucoma. Ophthalmology. 2018; 125: 1362–1371. [DOI] [PubMed] [Google Scholar]
- 18. Kelbsch C, Maeda F, Lisowska J, et al.. Analysis of retinal function using chromatic pupillography in retinitis pigmentosa and the relationship to electrically evoked phosphene thresholds. Acta Ophthalmol. 2017; 95: e261–e269. [DOI] [PubMed] [Google Scholar]
- 19. Kardon R, Anderson SC, Damarjian TG, Grace EM, Stone E, Kawasaki A. Chromatic pupillometry in patients with retinitis pigmentosa. Ophthalmology. 2011; 118: 376–381. [DOI] [PubMed] [Google Scholar]
- 20. Feigl B,, Zele AJ. Melanopsin-expressing intrinsically photosensitive retinal ganglion cells in retinal disease. Optom Vis Sci. 2014; 91: 894–903. [DOI] [PubMed] [Google Scholar]
- 21. Maynard ML, Zele AJ, Feigl B. Melanopsin-mediated post-illumination pupil response in early age-related macular degeneration. Invest Ophthalmol Vis Sci. 2015; 56: 6906–6913. [DOI] [PubMed] [Google Scholar]
- 22. Kelbsch C, Ka Stingl, Kempf M, et al.. Objective measurement of local rod and cone function using gaze-controlled chromatic pupil campimetry in healthy subjects. Trans Vis Sci Tech. 2019; 8: 19.. [DOI] [PMC free article] [PubMed] [Google Scholar]
- 23. Kelbsch C, Strasser T, Chen Y, et al.. Standards in pupillography. Front Neurol. 2019; 10: 129. [DOI] [PMC free article] [PubMed] [Google Scholar]
- 24. Rosli Y, Bedford SM, James AC, Maddess T. Photopic and scotopic multifocal pupillographic responses in age-related macular degeneration. Vision Res. 2012; 69: 42–48. [DOI] [PubMed] [Google Scholar]
- 25. Fotiou DF, Brozou CG, Tsiptsios DJ, et al.. Effect of age on pupillary light reflex: evaluation of pupil mobility for clinical practice and research. Electromyogr Clin Neurophysiol. 2007; 47: 11–22. [PubMed] [Google Scholar]


