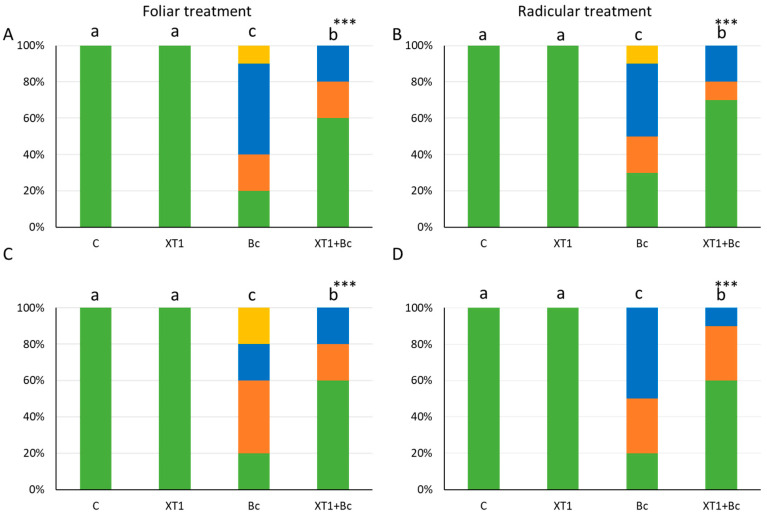
Figure 3.
Severity of damage (%) caused by B. cinerea in tomato (A,B) and strawberry (C,D) plants after foliar and radicular treatment with XT1. C: non-inoculated control plants; XT1: XT1-treated plants; Bc: B. cinerea-infected non-treated plants; XT1+Bc: XT1-treated B. cinerea-infected plants. Statistical differences according to the Kruskal–Wallis test *** (p ≤ 0.001). Significant differences between treatments are indicated by different letters (a,b,c).

