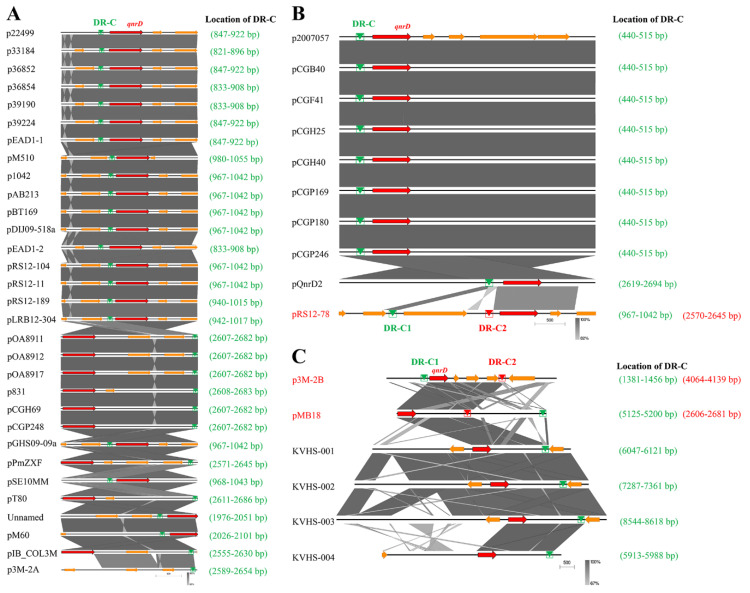
Figure 6.
Comparative linear maps of qnrD-carrying plasmids of (A) 2.7 kb, (B) 4.3 kb, and (C) larger than 4.3 kb; qnrD and other predicted coding sequences (CDS) are denoted by red and orange arrows, respectively. The size of the arrows is to scale. The green and red triangles represent the regions sharing high sequence identity with DR-C in p3M-2B.

